
 WELLINGTON CITY
Client:
WELLINGTON CITY
Client:
Wellington City Council
INCLUSIONARY ZONING
Project No: 52114
ECONOMIC ASSESSMENT
Date:
August 2021
INITIAL DATA FINDINGS
W: www.propertyeconomics.co.nz E: [email address] P: 09 479 9311 PO: Box 315596, Silverdale 0944


 SCHEDULE
Code
Date
Information / Comments
Project Leader
SCHEDULE
Code
Date
Information / Comments
Project Leader
52114.1
August 2021
Draft Report
Tim Heath / Phil Osborne
DISCLAIMER
This document has been completed, and services rendered at the request of, and for the
purposes of Wellington City Council only.
Property Economics has taken every care to ensure the correctness and reliability of all the
information, forecasts and opinions contained in this report. All data utilised in this report has
been obtained by what Property Economics consider to be credible sources, and Property
Economics has no reason to doubt its accuracy.
made in reliance of any report by Property Economics. It is the responsibility of all parties acting
on information contained in this report to make their own enquiries to verify correctness.
COPYRIGHT
© 2021 Property Economics Limited. All rights reserved.
CONTACT DETAILS
Tim Heath
Mob: 021 557713
Email:
[email address]
Web:
www.propertyeconomics.co.nz
W: www.propertyeconomics.co.nz
2

52114.1
THEORETICAL CAPACITY
•
Property Economics utilised the results from WCC Theoretical Capacity modelling
•
Only Comprehensive redevelopment was considered
•
Apartment options came in three different sizes, small, medium and large apartments
which averaged 70sqm, 100sqm and 150sqm respectively.
As a caveat Property Economics consider the average apartment sizes applied in the
WCC Theoretical Capacity Model are high, particularly for the purposes of this study and
potential reconciliation with demand.
The assessment of inclusionary zoning has been undertaken across three different suburbs and
zones, including:
1. Te Aro - Central Area zone
2. Johnsonville - Centre and Medium Density Residential zones
3. Tawa - Rapid Transit zone
Appendix 1 shows a map of each of these three suburbs as well as the sub-zones that have been
incorporated as part of this assessment.
Capacity is mutually exclusive between the three typology options. Building Large Apartments
removes the capacity for Medium or Small.
TABLE 1: THEORETICAL CAPACITY – TOTAL YIELD
Theoretical
Entire Suburb
Within Centre Zones
Large
Medium
Small
Large
Medium
Small
Capacity
Apartment
Apartment
Apartment
Apartment
Apartment
Apartment
Johnsonville
20,345
31,215
45,150
4,079
6,226
8,982
Tawa
37,405
57,099
81,865
14,963
23,028
32,599
Te Aro
3,464
5,290
7,655
2,235
3,415
4,942
Total
61,214
93,604
134,670
21,277
32,669
46,523
Source: Property Economics, WCC
Accounting for the number of dwellings removed from the theoretical capacity.
TABLE 2: EXISTING DWELLINGS BY SUBURB
Existing
Within
Entire
Centre
Dwellings
Suburb
Zones
Johnsonville
3,149
561
Tawa
4,420
1,748
Te Aro
526
336
Total
8,095
2,645
Source: Property Economics
W: www.propertyeconomics.co.nz
3


52114.1
1.1.
FEASIBLE CAPACITY
Feasible Capacity what is viableto build at an assumed 20% profit margin.
TABLE 3: FEASIBLE CAPACITY
Entire Suburb
Within Centre Zones
Large
Medium
Small
Large
Medium
Small
Apartments
Apartments
Apartments
Apartments
Apartments
Apartments
la y Johnsonville
20,345
31,215
45,150
4,079
6,226
8,982
ci
tic Tawa
37,405
57,099
81,865
14,963
23,028
32,599
etr a p Te Aro
3,464
5,290
7,655
2,235
3,415
4,942
eo
a
h
C
T
Total
61,214
93,604
134,670
21,277
32,669
46,523
y
Johnsonville
325
911
882
301
851
829
e l
ti
bi
c
Tawa
103
297
344
77
205
211
s
a
p
ea
a Te Aro
797
1,924
2,703
769
1,674
2,475
F
C
Total
1,225
3,132
3,929
1,147
2,730
3,515
y
Johnsonville
1.6%
2.9%
2.0%
7.4%
13.7%
9.2%
tili
Tawa
0.3%
0.5%
0.4%
0.5%
0.9%
0.6%
bi
%
s
Te Aro
23.0%
36.4%
35.3%
34.4%
49.0%
50.1%
eaF
Total
2.0%
3.3%
2.9%
5.4%
8.4%
7.6%
Source: Property Economics
1.2.
FEASIBLE CAPACITY - MAXIMUM PROFIT OPTION
This section utilises the highest profit typology option for each site. Net Yield shows total built
capacity adjusted for demolished dwellings.
TABLE 4: FEASIBLE CAPACITY - MAXIMUM PROFIT OPTION FOR CENTRE ZONES
Medium
Small
Maximum Profit
Total Yield
Net Yield
Apartments Apartments
Johnsonville
851
851
813
Tawa
205
205
200
Te Aro
571
1,744
2,315
2,185
Total
1,627
1,744
3,371
3,198
Source: Property Economics
W: www.propertyeconomics.co.nz
4


52114.1
2.
INCLUSIONARY ZONING OPTIONS
WCC is investigating the two potential inclusionary zoning options. The first option will require
any developer building more than 2,400sqm of floorspace to provide between 1 10% of the
new floorspace as assisted housing.
opments
that may have a negative impact on their feasibility.
In contrast, the second option incentivises developers to provide assisted housing through an
increase in the height restriction. Specifically, WCC has proposed to allow developers to build
an additional 25% floorspace in return for 10% - 50% of this additional floorspace being
provided as assisted housing.
Ultimately, the impact that these inclusionary zoning options will have on the modelled
feasibility is highly dependent on what the developer receives from the assisted housing
dwellings. For the purposes of this assessment, we have run two revenue scenarios using a 30%
and 50% reduction in the revenue received for an assisted home in comparison to one sold at
full price. Additionally, we estimate the number of assisted homes provided from each
inclusionary zoning option at both the upper end of the spectrum (i.e. 10% and 50% for
inclusionary zoning options 1 and 2 respectively) and in the middle of the proposed spectrum
(i.e. 5% and 25% respectively). This result in a total of four different scenarios tested for each of
the two inclusionary zoning options.
Specifically, these assumptions can be written as follows:
•
The developer sells the assisted housing at a 30% or 50% reduction in sale price.
This also translates to a reduction in real estate fees and GST. All other costs
associated with building the home are identical between the full price and assisted
housing options as it is assumed they will be of the same quality.
•
For the first inclusionary zoning option, if the additional floorspace is greater than
2,400sqm, then the number of assisted houses is equal to either 5% or 10% rounded
down. For example, if a development is posed to construct 32 dwellings, then 10%
of the development would equate to 3.2 dwellings. This is rounded down to 3
dwellings which in this instance, represents under 10% of the d
floorspace (approximately 9.4%). The same methodology is applied for the 5%
scenario which in this instance, would result in a single assisted dwelling.
•
For the second inclusionary zoning option, the number of homes built on each site
has been increased by 25% rounded down. Of these additional homes, either 25%
or 50% is assumed to be built as assisted housing. In the case of the 32-dwelling
development, a 25% increase in housing results in an additional 8 dwellings. Under
the 25% and 50% assisted housing assumption, 2 and 4 of these dwellings would be
considered assisted housing respectively.
W: www.propertyeconomics.co.nz
5

52114.1
2.1.
INCLUSIONARY ZONING OPTION 1
The four scenarios assessed are as follows:
Scenario 1: Up to 10% of the development is contributed to assisted housing at a 30%
discount. This results in up to a 3% decrease in revenue (10% * 30%).
Scenario 2: Up to 10% of the development is contributed to assisted housing at a 50%
discount. This results in up to a 5% decrease in revenue.
Scenario 3: Up to 5% of the development is contributed to assisted housing at a 30%
discount. This results in up to a 2.5% decrease in revenue.
Scenario 4: Up to 5% of the development is contributed to assisted housing at a 50%
discount. This results in up to a 1.5% decrease in revenue.
TABLE 5: COMPARISON OF OPTION 1’S IMPACT ON FEASIBLE CAPACITY
Feasible
Without
Assisted Housing 10% Assisted Housing 5%
Assisted
Capacity
30%
50%
30%
50%
Housing
Discount
Discount
Discount
Discount
Johnsonville
723
526
420
558
526
Tawa
205
148
116
205
148
Te Aro
319
319
319
319
319
Total
1,247
993
855
1,082
993
Source: Property Economics
TABLE 6: NUMBER OF FEASIBLE ASSISTED HOMES BUILT UNDER OPTION 1
Assisted
Assisted Housing 10%
Assisted Housing 5%
Housing
30% Discount
50% Discount
30% Discount
50% Discount
Johnsonville
47
38
19
18
Tawa
13
10
7
5
Te Aro
28
28
12
12
Total
88
76
38
35
Source: Property Economics
W: www.propertyeconomics.co.nz
6

52114.1
2.2.
INCLUSIONARY ZONING OPTION 2
As with the first inclusionary zoning option, we have assessed four different scenarios which are
as follows:
Scenario 1: Up to 50% of the additional homes is contributed to assisted housing at a
30% discount.
Scenario 2: Up to 50% of the additional homes is contributed to assisted housing at a
50% discount.
Scenario 3: Up to 25% of the additional homes is contributed to assisted housing at a
30% discount.
Scenario 4: Up to 25% of the additional homes is contributed to assisted housing at a
50% discount.
TABLE 7: COMPARISON OF OPTION 2’S IMPACT ON FEASIBLE CAPACITY
Assisted Housing
Feasible
Without
Assisted Housing 50%
25%
Assisted
Capacity
Housing
30%
50%
30%
50%
Discount
Discount
Discount
Discount
Johnsonville
851
1,087
607
1,411
1,249
Tawa
205
369
148
635
527
Te Aro
2,315
3,207
2,809
3,653
3,531
Total
3,371
4,663
3,564
5,699
5,307
Source: Property Economics
W: www.propertyeconomics.co.nz
7

52114.1
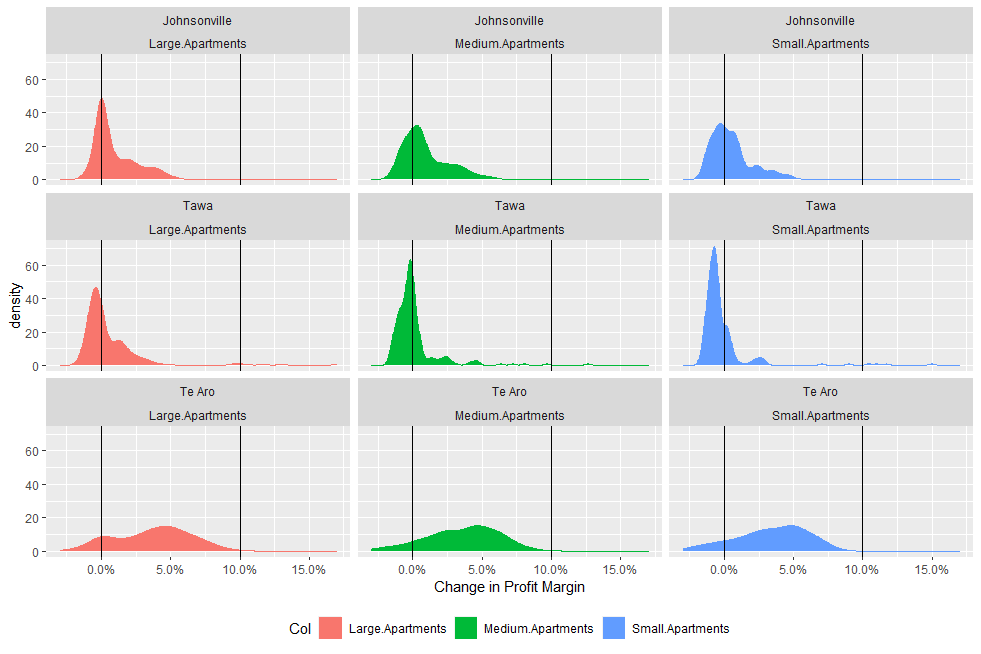
FIGURE 1: IMPACT OF INCLUSIONARY ZONING OPTION 2 ON NET PROFIT % - SCENARIO 1
Source: Property Economics
TABLE 8: NUMBER OF FEASIBLE ASSISTED HOMES BUILT UNDER OPTION 2
Assisted
Assisted Housing 50%
Assisted Housing 25%
Housing
30% Discount
50% Revenue
30% Discount
50% Revenue
Johnsonville
82
5
54
42
Tawa
19
0
26
21
Te Aro
212
108
88
72
Total
313
113
168
135
Source: Property Economics
W: www.propertyeconomics.co.nz
8

52114.1
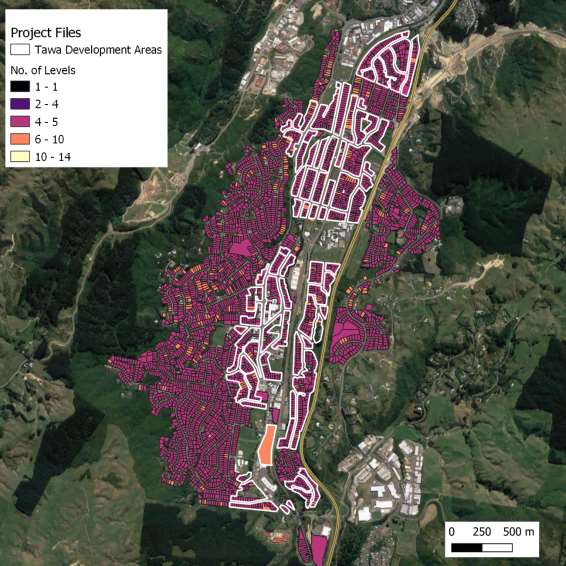
APPENDIX 1 – DEVELOPMENT SITE MAPS
FIGURE 2: TAWA DEVELOPMENT AREAS
Source: Property Economics
W: www.propertyeconomics.co.nz
9

52114.1
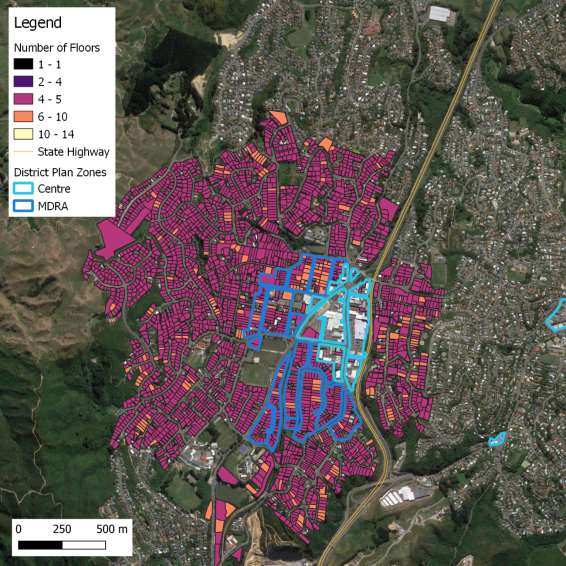
FIGURE 3: JOHNSONVILLE DEVELOPMENT AREAS
Source: Property Economics
W: www.propertyeconomics.co.nz
10

52114.1
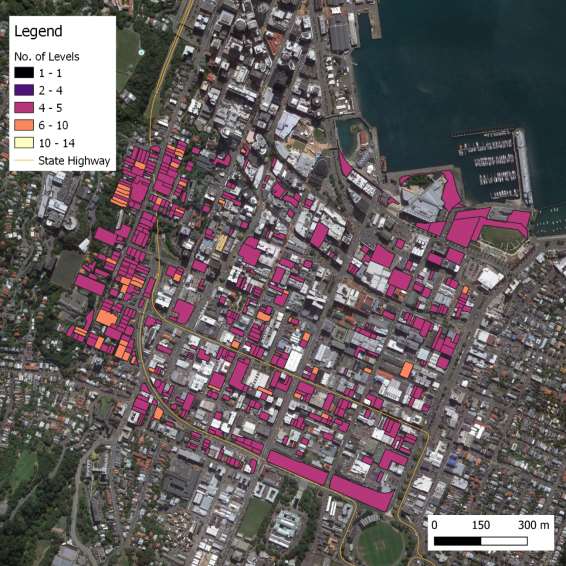
FIGURE 4: TE ARO DEVELOPMENT AREAS
Source: Property Economics
W: www.propertyeconomics.co.nz
11