

Report
MACC - EECA Programme 2B Energy Efficiency Review
(Building Services)
Prepared for Wellington City Council
By Beca Ltd
3 June 2016
/


MACC - EECA Programme 2B Energy Efficiency Review (Building Services)
Revision History
Revision Nº
Prepared By
Description
Date
1
Shaan Cory
Issued for information
7 June 2016
2
3
4
5
Document Acceptance
Action
Name
Signed
Date
Prepared by
Shaan Cory
2 June 2016
Reviewed by
Ben Masters
3 June 2016
Approved by
Ben Masters
7 June 2016
on behalf of
Beca Ltd
© Beca 2016 (unless Beca has expressly agreed otherwise with the Client in writing).
This report has been prepared by Beca on the specific instructions of our Client. It is solely for our Client’s use for the purpose for which
it is intended in accordance with the agreed scope of work. Any use or reliance by any person contrary to the above, to which Beca has
not given its prior written consent, is at that person's own risk.
Beca // 3 June 2016
5138221 // NZ1-12429047-20 0.20 // i
MACC - EECA Programme 2B Energy Efficiency Review (Building Services)
Executive Summary
The following is a summary overview of the selected building services energy efficiency opportunities assessed as part of the EECA Programme 2B energy efficiency advisory service for the proposed Museum and Convention
Centre (MACC) project. The energy efficiency review has used computer simulation modelling to benchmark annual energy use savings against a theoretical baseline building model.
Table 1 - Comparison of Building Services Energy Efficiency Opportunities
Annual Energy and Emissions Savings Benchmark
Financial Performance Indicator
Scenario
Description
Energy Use
kWh/m² per
Tonnes CO2-
Indicative
Payback
kWh per yr
$ per year
20 year NPV3
20 year IRR
(kWh/m²)
yr
e/ year
Capital Cost1
Period2
1
l
Baseline: EECA 2A report Combined Enhanced Envelope
278
-
-
-
-
-
-
-
-
tro
2
n
Baseline + Daylight Harvesting in FOH Areas
277
1
12,000
$ 1,600
2
$21k
12 years
$800
7.0%
3
Co
s
Baseline + Economiser
274
3
51,000
$ 7,000
7
$5k
1 years
$89,000
142.5%
e
ti
4
i
n
Baseline + Exhaust Air Heat Recovery
272
6
96,000
$ 5,000
22
$20k
5 years
$42,000
25.2%
5
HVAC
rtu
Baseline + Demand Control Ventilation (DCV)
258
20
312,000
$ 14,000
71
$15k
2 years
$174,000
96.8%
o
6
d
p
Baseline + Movie Museum Gallery HVAC Off Overnight
250
27
429,000
$ 42,000
78
$0k
0 years
$561,000
NA
e
c
p
n
O
a
Combined HVAC Control Opportunities (Baseline +
7
h
233
44
700,000
$ 60,000
134
$61k
2 years
$742,000
101.0%
En
Scenarios 2, 3, 4, 5 and 6)
8
n
Scenario 7 + Condensing Loop Heat Pump
232
1
13,000
$ 500
3
$40k
80 years
-$34,000
-9.0%
ig
9
s
Scenario 7 + Magnetic Bearing Water Cooled Chiller
231
2
38,000
$ 4,000
7
$118k
30 years
-$67,000
-1.7%
De
t
Scenario 7 + Low Specific Fan Power (SFP) Central Air
10
n
225
9
136,000
$ 15,000
23
$17k
1 years
$284,000
134.9%
ie
Handling
c
s
11
fi
e
iti
Scenario 7 + Variable Speed Cooling Tower
216
18
278,000
$ 28,000
50
$10k
1 years
$361,000
280.1%
12
Ef
n
y
Scenario 7 + Air Sourced Heat Pump
216
18
278,000
$ 5,000
44
$39k
7 years
$31,000
14.4%
rtu
13
rg
o
e
Scenario 7 + Waste Water Heat Pump
215
19
293,000
$ 7,000
47
$264k
38 years
-$174,000
-3.5%
p
n
p
14
Scenario 7 + Variable Volume Condensing Water Loop
211
22
351,000
$ 35,000
62
$50k
2 years
$419,000
72.6%
E
O
15
d
e
Scenario 7 + Energy Piles
203
30
475,000
$ 47,000
85
$303k
6 years
$338,000
17.2%
c
n
Combined Efficient Design Opportunities (Scenario 7 +
16
a
165
69
1,079,000
$ 86,000
188
$419k
6 years
$495,000
17.8%
h
Scenarios 10, 11, 12, 13, and 15)
En
17
Scenario 16 + Roof Mounted Photovoltaics
149
16
250,000
$ 25,000
45
$344k
12 years
-$10,000
6.2%
The findings are as follows:
The combined savings of implementing Daylight Harvesting, Economiser, DCV, Exhaust Air Heat Recovery, and switching the Movie Museum Galleries HVAC Off overnight is indicated as a substantial reduction of 44kWh/m2 per
year and 134 tonnes of associated Greenhouse Gas (GHG) emissions per year. The opportunities indicate a payback period of 2 years, with a NPV of approximately $740K and an IRR of 101% across a 20 year period.
Further energy reductions can be achieved by installing Variable Speed Cooling Tower Fans, a Variable Volume Condensing Water Loop, an Air Sourced Heat Pump, Energy Piles and designing for a Low SFP central air
handling (includes efficient motors). The combination of the these opportunities is indicated to reduce energy consumption by 69kWh/m2 per year, $86K of cost savings per year, and a reduction of 188 tonnes of associated GHG
emissions per year. They are indicated to have a short payback period of 6 years, even with the low energy rates WCC are currently paying. The 20 year NPV is indicated to be just under $500K with an IRR of 17.8%, which
suggests these options would result in a favourable return on investment.
Incorporating the combined envelope measures outlined in the EECA 2A report, the combined HVAC controls and combined HVAC design opportunities is indicated to reduce energy consumption by approximately 40%
(125kWh/m2 per year, $150k of cost savings per year, and a reduction of 365 tonnes of associated GHG emissions per year). The 40% reduction in energy consumption is indicated to have a short payback period of under 5
years and an indicative 20 year NPV of over $1 million dollars with an IRR of over 20%. All suggesting that the combination of the building envelope and system options would result in a favourable return on investment. These
figures exclude roof mounted PV which should be considered given the visual statement and marketing opportunity a PV installation would represent.
High efficiency motors will be specified during the selection process. For example, selections with EC motors will be undertaken as EC motors have mid-high 90% efficiencies. Note: the 60-70% efficiency displayed on the AHU
fan data sheets provided by suppliers represent the total efficiency of the entire fan assembly, which takes into account the EC motor efficiency, the fan scroll efficiency and any losses.
1
Based on indicative increased capital cost over baseline option. Order of capital costs TBC by Cost Consultant. Excluding GST, contractor P+G and margins, contingency allowance, and professional fees. These estimates are for comparison purposes
only, and not to establish construction budget or estimate operating expenses. 2
Based on WCC electricity rate of 10ȼ/kWh and gas rate of 5ȼ/kWh with a 2.5% annual inflation rate assumed
3
Assumes a 6.5% discount rate
Beca // 3 June 2016
5138221 // NZ1-12429047-20 0.20 // i
MACC - EECA Programme 2B Energy Efficiency Review (Building Services)
Contents
1 Introduction
3
2 Project Description
3
2.1
MACC
3
3 Energy Efficiency Overview
4
3.1
Efficiency Optimises Lifetime Costs
4
3.2
Energy Efficiency Adds Value
4
4 Computer Simulation Models
4
4.1
Weather File
4
4.2
Baseline Model
4
5 Energy Efficiency Opportunities
6
5.1
Control Opportunities
6
5.2
Design Opportunities
6
6 Findings
7
7 Financial Analysis
9
8 Comments & Recommendations
10
9 Energy Management
11
10 Next Steps
11
Appendices
Appendix A – Computer Simulation Model Inputs
Appendix B – Financial Performance Analysis
Beca // 3 June 2016
5138221 // NZ1-12429047-20 0.20 // ii


MACC - EECA Programme 2B Energy Efficiency Review (Building Services)
1
Introduction
2
Project Description
This energy efficiency advisory service has been requested by Wellington City Council (WCC) to review selected
2.1
MACC
energy efficiency opportunities available to the proposed Museum and Convention Centre (MACC). The scope of
services provided aligns with the objectives of the Energy Efficiency & Conservation Authority (EECA)
WCC is planning to construct a new MACC with an approximate useable floor area of 15,751m2. MACC is a 5
Programme 2B Advisory service requirements.
storey building. The lower four floors consist of two 10m high floor to ceiling mezzanine split levels that house the
museum exhibits. The top floor houses the convention centre. MACC is comprised of:
As summarised by EECA:
11 large exhibition pieces
The objective of Programme 2B is to ensure that energy efficiency features [Building Services]
are incorporated
1,100 person convention centre,
into the more detailed design and construction of the Building. Where the Building has been part of a Programme
Kitchen,
2A Project, it will be important that the recommendations from the Programme 2A report are included in the
detailed design and construction (if possible).
Offices, and
Lobby area.
The EECA Programme 2A report has been carried out in parallel with this report and is focussed on an energy
efficient building envelope.
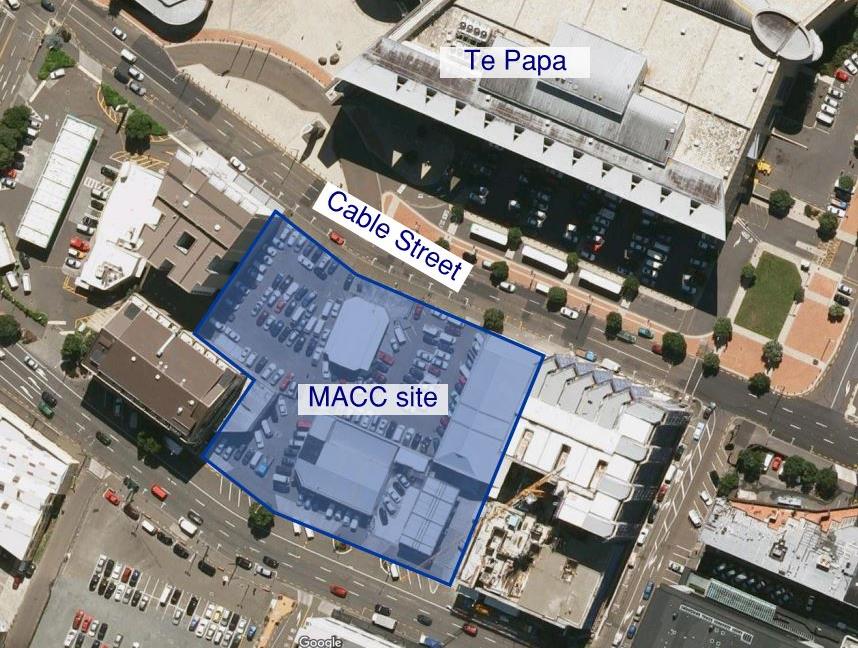
Figure 1 shows that MACC is located across the street from Te Papa and situated between three existing
buildings.
The energy efficiency review uses computer simulation modelling to benchmark the energy performance benefit
of selected energy efficiency opportunities against a theoretical baseline model and the proposed design.
Project summary details are as follows:
Each opportunity has been considered purely from an energy, Greenhouse Gas (GHG) emissions and energy
Location: Cable Street, Wellington
cost perspective only. Other criteria including internal environmental quality (e.g. occupancy thermal comfort, air
Client: Wellington City Council
quality, daylight availability, access to external views etc), architectural, construction, cost, emissions, cleaning,
Design Stage: Preliminary Design
safety in design and all other aspects which inform to the performance and aesthetic requirements of the building
design should be considered separately by the project team.
N
Limitations
This study has been prepared for the purposes of helping to inform the development of the building design. The
computer simulation models are only intended to help inform the building design and the predicted values may
overestimate or underestimate the actual building performance in use. Note that the energy benchmark
calculations use standard benchmarking criteria for occupancy, lighting, power and plant usage and benchmark
weather data. Actual operating variables will differ in reality (e.g. weather, fitout and usage patterns, blinds
control etc.). We point out that the weather files used for the computer simulations represent a typical weather
year only and does not account for periods of unseasonably high (or low) temperature or humidity.
The energy benchmarks are not an estimate of predicted energy use and as such cannot be guaranteed that the
actual building energy use will be within the target limits as this will be determined by many variables, including
those listed above.
All costs are high level estimates only based on suppliers quotes and may not reflect the actual costs. These will
need to be confirmed by further design and the project quantity surveyor.
Figure 1 – Proposed site location on the existing Cable Street site
Beca // 3 June 2016
5138221 // NZ1-12429047-20 0.20 // page 3
MACC - EECA Programme 2B Energy Efficiency Review (Building Services)
3
Energy Efficiency Overview
4
Computer Simulation Models
Commercial and industrial buildings account for around 8% of New Zealand’s total energy consumption a year,
A 3D computer simulation model was created for the building using IES Virtual Environment software. IES
and 5% of total CO2 emissions.
simulation software is of the dynamic thermal simulation type that is capable of predicting building thermal
performance and estimating annual energy consumption in a building.
Studies have shown there can be as much as a ten-fold difference in actual energy consumption between similar
buildings with design and construction-related issues and operational issues the main contributors to the
The program is based upon finite difference methods as recommended by CIBSE Part A for energy and
differences.
environmental modelling to model the transmission and storage of heat in the building fabric.
3.1
Efficiency Optimises Lifetime Costs
The thermal model was created using IES Virtual Environment Version 2015. This has been independently
verified to meet ANSI/ASHRAE Standard 140-2004 (Building Thermal Envelope and Fabric Test Loads)
Designing energy-efficient buildings makes sense on a number of levels – not the least of which is the overall
performance criteria. The
Apache HVAC module has been used to accurately simulate Heating, Ventilation, and
economics.
Air-Conditioning (HVAC) energy.
Typical costs relative to initial construction costs over the life of a typical building are:
Environmental consultant fees
0.01 to 0.03
4.1
Weather File
Professional fees
0.10 to 0.15
Each model has been simulated using the NIWA Wellington TMY2 weather file (Data Source - TMY2 NIWA
Construction costs
1.00
18234 D14482 WMO Station 934360). This represents a historical average year of Wellington weather data as
Energy, operating and maintenance costs 3.00
recorded at the Kelburn weather station. It must be noted that the weather data does not account for any
Business costs (salaries, rental/space)
200.00
unseasonable weather conditions and does not account for any localised micro climate effects at the site
Even taken together the design fees and costs of construction are a small portion of total lifetime costs of a
location.
building. Focusing on these initial construction costs alone will almost certainly result in a project that does not
optimise its lifetime costs.
4.2
Baseline Model
The thermal envelope has been modelled to represent the combined EECA 2A proposed building thermal
The extra initial cost of letting the architects and engineers evaluate the design thoroughly and determine an
envelope performance:
energy-efficient outcome is an investment that should repay itself many times over the life of the building.
External walls: R 2 m2.K/W (including thermal bridging effects)
Business costs are by far the most significant lifetime cost of a project, and to influence them, the potential effect
Roof: Total R-value: R 3 m2.K/W (including thermal bridging effects)
of a building on the productivity and health of its users must be taken into account.
R 1.3 ground floor
Vision Glazing:
Energy-efficient design can also play a significant role in providing healthier, more productive environments. For
– Uwindow: U 3.0 W/m2.K (including frame effect)
example:
– Shading Coefficient: 0.40
–
Increased levels of thermal insulation results in improved winter thermal comfort
G value: 0.35
External shading to control summer cooling loads also reduces direct solar gain which may cause discomfort
for building occupants. Well-designed shading also means users do not need to use their blinds as much,
The baseline model includes the external solar shading surrounding the building and the adjacent buildings.
allowing more access to daylight and exterior views.
The baseline model has full air conditioning to all occupied areas with a combination of centralised Variable Air
Energy-efficient high frequency lighting may reduce headache producing flicker
Volume (VAV) Air Handling Units (AHU) with zone reheat and a 4 pipe fan coil unit system providing heating and
3.2
Energy Efficiency Adds Value
cooling via a water cooled chiller plant and gas boiler plant (condensing type). Mechanical ventilation is provided
as per the current design provision. Internal lighting is assumed to be predominantly provided by LED lighting
All stakeholders in the building stand to gain from more energy-efficient design.
technology. HVAC plant and equipment efficiencies align with the Department of Building and Housing’s
Guidelines for Energy Efficient HVAC plant (MEPS).
Owners/occupiers and building users enjoy lower operating costs, and potentially greater operational flexibility
and an environment that encourages greater productivity. The benefits also contribute to the long-term value of
The operating and occupancy profile used in the model has been set to align with the forecast average 10 year
the asset for owners and portfolio holders.
projection for movie museum usage from “Wellington City Council - Indicative business case for a new movie
museum” document from November 2015 and projected year 5 convention centre usage from “Wellington City
The benefits of energy efficiency wil become more obvious and more valuable as energy costs rise, employees’
Council - Indicative business case for a new convention centre” document from December 2015.
pressure for healthier environments increases, regulation becomes a more distinct possibility and overall
environmental awareness improves.
Further details of the baseline computer model inputs are described in Appendix A.
Sample images of the 3D computer model can be seen in the following figures:
Beca // 3 June 2016
5138221 // NZ1-12429047-20 0.20 // page 4
MACC - EECA Programme 2B Energy Efficiency Review (Building Services)
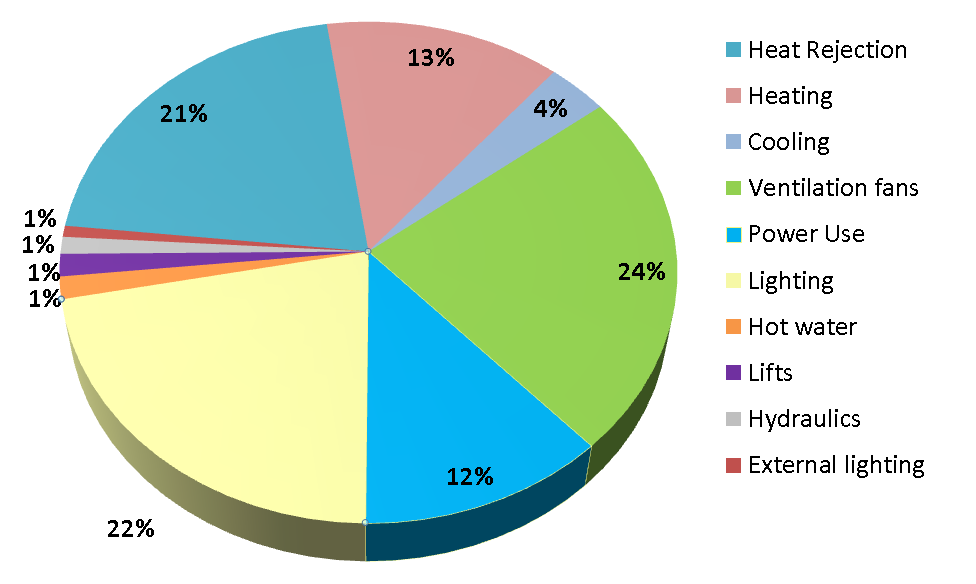
Benchmark Energy End Use Breakdown
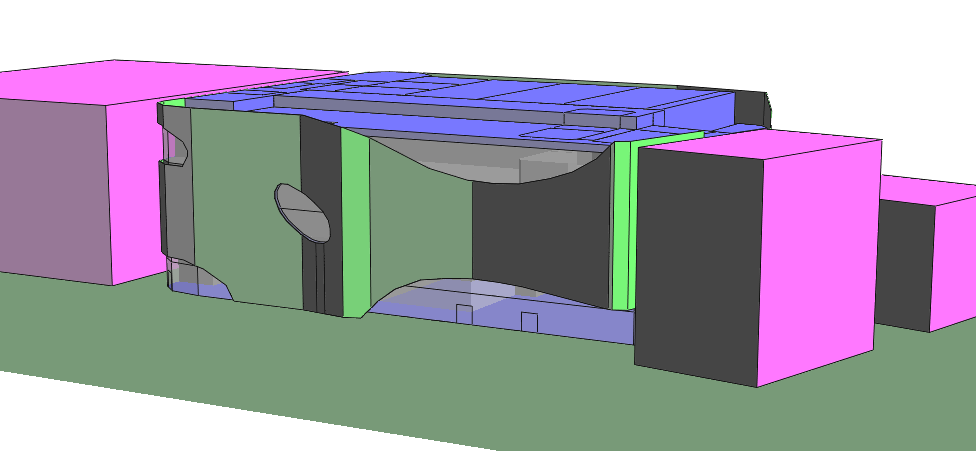
Adjacent Buildings
The benchmark annual energy end-use breakdown for the theoretical baseline model can be seen in the
following figure:
Solar Shading
Figure 2 - Computer simulation model showing proposed façade design, view from north.
Figure 4 - Baseline Model, Benchmark Energy End Use Breakdown
It can be seen that heating, cooling, ventilation fans, and heat rejection energy makes up 62% of the annual
energy use for the baseline model. Ventilation fans energy is the highest HVAC end use at 24% and is
comprised of AHUs, supply air fans, fan coil units, and miscellaneous extract fans (e.g. toilets, kitchen exhaust,
back of house etc). Heat rejection energy is the second largest energy user at 21% of overall energy and is
comprised of the cooling tower fans and the condensing circuit’s pumps. In the baseline model, the heat rejection
operates at a constant speed, regardless of the cooling load. Heating energy is 13% and is comprised of outdoor
air heating and space heating. Cooling energy accounts for only 4% due to the efficiency of the Baseline water
cooled chiller.
The lighting and power (for computers, kitchen equipment and other equipment) makes up a further 34% of the
annual energy usage. The baseline model assumes LED lighting and typical use of lighting and power with a low
level of energy management being employed by building users. The energy use attributed to computers and
other appliances can be a large variable and should be benchmarked as the design and Furniture, Fixtures and
Equipment (FFE) stage progresses. The simulations have assumed equipment efficiency is not overly energy
efficient at this stage but we recommend that an energy efficient equipment specification is targeted.
The remaining 4% of energy usage is for hydraulics, lifts, and external lighting.
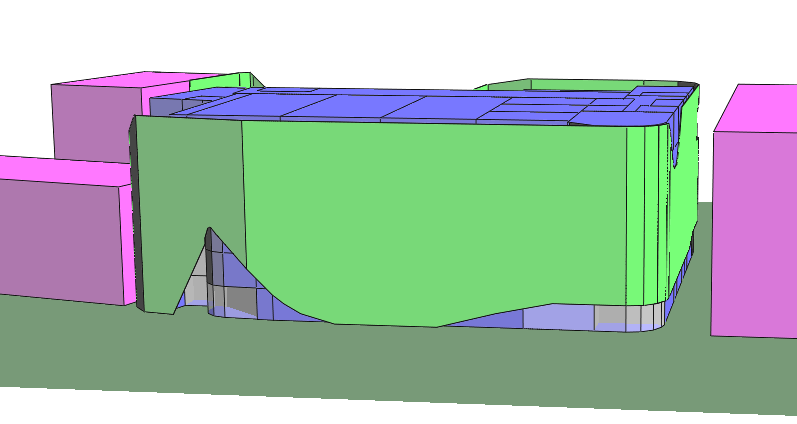
Figure 3 - Computer simulation model showing proposed façade design, view from south
Beca // 3 June 2016
5138221 // NZ1-12429047-20 0.20 // page 5
MACC - EECA Programme 2B Energy Efficiency Review (Building Services)
5
Energy Efficiency Opportunities
Variable speed cooling tower fans: Cooling tower fans which run constantly can over cool the condenser
water. A variable speed drive is installed and varies the cooling tower fan speed to only cool the condensing
water to the temperature the chiller is requesting. This in turn reduces the cooling tower fan energy
The following Programme 2B energy efficiency opportunities were identified by WCC and Beca.
consumption.
Variable volume condenser water loop: Condensing water loop pumps which run constantly can over cool
5.1
Control Opportunities
the condenser water. A variable speed drive is installed and varies the Condensing water loop pumps to only
cool the condensing water to the temperature the chiller is requesting. This in turn reduces the condensing
The potential energy saving performance of a number of energy efficient HVAC controls opportunities were
water loop pump energy consumption.
initially assessed against the baseline model as follows:
Low Specific fan power central air handling: Specific fan power is a measurement of the electric power
Demand Controlled Ventilation (DCV): Outside air supply is delivered only as required to achieve the
that is needed to drive a fan, relative to the air volume that is circulated through the fan. SFP is measured in
required level of air quality (as opposed to 100% of design capacity during all occupied hours). Air quality
Watts per litre per second (W/l.s). Fan energy consumption will reduce by designing the ventilation system
sensors monitor air quality levels to determine the level of outdoor air rate required.
which has lower static pressure. The design takes advantage of larger duct sizes to reduce friction. As an
Economiser: The Economiser is used if the HVAC system zone is requesting cooling and the outdoor air
example, the table below displays the impact having a lower static pressure has on fan power.
temperature is cool enough to directly provide the zone cooling requirements.
HVAC Off Overnight: Switch the HVAC off overnight in the Movie Museum Galleries and let the temperature
Fan Static
Power Input
drift outside of the heating and cooling temperature set points. The Convention Centre already switches off
800 Pa
3.7 kW
overnight.
900 Pa
4.2 kW
1000 Pa
4.6 kW
Exhaust Air Heat Recovery: Install a run around coil to recover heat from exhausted air to preheat incoming
outdoor air which is supplied to the Fan Coil Unit system (Lobby areas). Additional pipework connected from
the exhaust duct to the supply air duct
before the Air Handling Units heating coil is required.
High efficiency motors will be specified during the selection process. For example, selections with EC motors
will be undertaken as EC motors have mid-high 90% efficiencies. Note: the 60-70% efficiency displayed on
Daylight harvesting to FOH areas: Install electric light dimming in perimeter lobby and convention centre
exhibition areas. Lighting energy use has been reduced to account for daylight levels in FOH perimeter areas
the AHU fan data sheets provided by suppliers represent the total efficiency of the entire fan assembly, which
to simulate automated light dimming controls
takes into account the EC motor efficiency, the fan scroll efficiency and any losses. This is for a total system,
not just the motor only.
Combined HVAC Control Opportunities: All of the five opportunities above were simulated together.
Combined Opportunities: The following selected opportunities were simulated together:
– Air Sourced Heat Pump
5.2
Design Opportunities
– Energy Piles
–
The above Combined Control Opportunities form a new scenario which the potential energy saving performance
Variable Speed Cooling Towers
of a number of additional enhanced building services design opportunities were separately assessed against, as
– Variable Volume Condensing Water Loop
follows:
– Low Specific Fan Power Central Air Handling
Magnetic Bearing Water Cooled High Efficiency Chillers: The efficiency gains in a magnetic bearing
Roof Mounted Photovoltaic Array: Photovoltaics are a renewable energy generation source which converts
chiller are attained from a
reduction in the energy losses associated with friction. The reduced energy losses
solar radiation into electricity. It is proposed to install a 160kW array over 50% of the MACC roof area.
increase the heat transfer efficiency of the chiller. This is because no oil is used in the chiller. Also, a variable
speed drive on the motor allows the compressor to operate much more efficiently at partial loads than
standard compressors.
Waste Water Sourced Heat Pump: A Waste Water Sourced Heat Pump absorbs heat from waste water
(sewage) and transfers the heat to the building through the refrigerant cycle in a heat pump. The Waste
Water Heat Pump scenario has a Sewage SHARC to remove solid waste and makes the waste water usable
as a heat source.
Condenser loop water sourced Heat Pump: Similar to the Waste Water Sourced Heat Pump, the
condensing loop water is used to absorb heat and transfer the heat to the building through the refrigerant
cycle in a heat pump. A condensing loop Heat Pump can only be used when there is a coincident cooling load
equal to or greater than the heating load.
Air Sourced Heat Pump: Similar to the waste water sourced heat pump, the outside air is used to extract
heat and transfer the heat to the building through the refrigerant cycle in a heat pump.
Energy Piles (Ground sourced heat rejection through piles): Energy Piles use the ground as an energy
transfer medium, in this case as a medium to reject heat. Energy Piles reduce the cooling energy
consumption because it uses the ground as a means to cool the condensing water for free without requiring
cooling tower fans (pumps for water circulation through piles are still required). If the ground cannot cool the
condensing water entirely, the cooling tower would be used. The assessment has assumed that 2 loops of
piping were run through the 37 piles that are 1m or larger in diameter with an estimate heat rejection capacity
of 110kW.
Beca // 3 June 2016
5138221 // NZ1-12429047-20 0.20 // page 6
MACC - EECA Programme 2B Energy Efficiency Review (Building Services)
6
Findings
Each computer model scenario has been simulated over a typical Wellington weather year and the annual energy benefit of each energy efficiency opportunity is separately compared to either the baseline model or the proposed
Combined Load and Controls Opportunities scenario which forms a new baseline to measure the energy efficient design opportunities against. The findings are as follows:
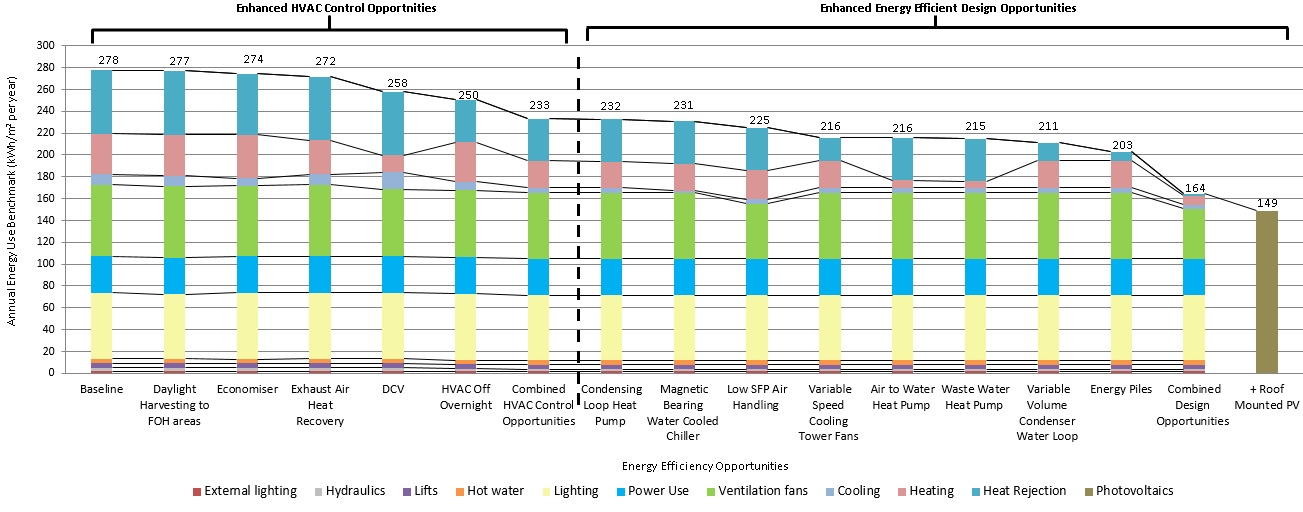
Figure 5 – Annual Energy Use Benchmark Comparison
DCV and Switching the Movie Museum Gallery HVAC Off overnight are indicated to produce the largest
It is indicated that large energy savings are offered by designing the heat rejection system to be more energy
energy savings from a controls perspective. DCV is indicated to save 20kWh/m2 a year, and switching the
efficient:
HVAC Off overnight 27kWh/m2 a year.
– Variable speed cooling towers is suggested to reduce energy consumption by 18kWh/m2 a year and GHG
Combining the HVAC control opportunities is indicated to reduce energy consumption by 44kWh/m2 a year,
emissions by 50 tonnes per year.
lower GHG emissions by 134 tonnes per year, and reduce energy costs by approximately $60K per year.
– A Variable volume condensing water loop is indicated to reduce energy consumption by 19kWh/m2 a year
The various heat pump options all reduce energy consumption, with the Air Sourced (18kWh/m2.yr) and Waste
and GHG emissions by 62 tonnes per year.
Water (19kWh/m2.yr) Heat Pumps being indicated to provide a large amount of annual energy savings. Both
It is indicated that installing Energy Piles would be the single largest energy saver. Energy piles reduce energy
the air sourced and waste water heat pumps have the potential to reduce GHG emissions by over 40 tonnes
consumption by 30kWh/m2 a year and GHG emissions by 80 tonnes per year.
per year.
Combining the design options which provide a favourable return on investment (Low SFP, Variable Speed
Upgrading the water cooled chiller to a magnetic bearing option may reduce energy by only 2kWh/m2 per year
Cooling Tower Fans, Variable Volume Condensing Water Loop, Air Sourced Heat Pump, and Energy Piles) is
largely due to the already high efficiency of standard water cooled chillers.
indicated to reduce energy consumption by 69kWh/m2 per year and GHG emissions by 188 tonnes per year.
By designing the central ventilation systems to minimise pressure loss can lead to 9kWh/m2 per year worth of
A roof mounted PV system covering 50% of the MACC roof area can generate 16kWh/m2 per year and
energy savings. This equates to 23 tonnes of GHG emissions.
equates to approximately 45 tonnes of GHG emissions. Installing PV presents a visual statement that WCC
and the MACC development is sustainability and environmentally focussed.
Beca // 3 June 2016
5138221 // NZ1-12429047-20 0.20 // page 7
MACC - EECA Programme 2B Energy Efficiency Review (Building Services)
Table 2 – Annual Energy Savings Benchmark Summary
Enhanced HVAC Control Opportunities
Enhanced Energy Efficient Design Opportunities
Magnetic
Variable
Variable
Annual Energy and
Daylight
Exhaust
Combined
Condensing
Bearing
Low SFP
Speed
Air to
Waste
Volume
Combined
Roof
Emissions Savings
HVAC Off
Energy
Harvesting
Economiser
Air Heat
DCV
HVAC Control
Loop Heat
Water
Air
Cooling
Water Heat
Water Heat
Condenser
Design
Mounted
Benchmark
Overnight
Piles
to FOH
Recovery
Opportunities
Pump
Cooled
Handling
Tower
Pump
Pump
Water
Opportunities
PV
areas
Chiller
Fans
Loop
kWh/m2 per year
1
3
6
20
27
44
1
2
9
18
18
19
22
30
69
16
kWh per year
12,000
51,000
96,000
312,000
429,000
700,000
13,000
38,000
136,000
278,000
278,000
293,000
351,000
475,000
1,079,000
250,000
$ per year
$1,600
$7,000
$5,000
$14,000
$42,000
$60,000
$500
$4,000
$15,000
$28,000
$5,000
$7,000
$35,000
$47,000
$86,000
$25,000
Tonnes CO2-e/ year
2
7
22
71
78
134
3
7
23
50
44
47
62
85
188
45
Beca // 3 June 2016
5138221 // NZ1-12429047-20 0.20 // page 8
MACC - EECA Programme 2B Energy Efficiency Review (Building Services)
7
Financial Analysis
Air Sourced Heat Pump ($39K): Based on additional costs of purchasing a 150kW air sourced heat pump @
$40K, minus the cost of the 150kW boiler it is replacing @$11K, and an additional hot water circuit for
Domestic Hot Water @$10K.
This section compares the financial performance of each energy efficiency opportunity. Please refer to Appendix
Waste Water Heat Pump ($264K): Based on additional costs of purchasing a 150kW water sourced heat
B for detailed financial analysis of each enhanced energy efficiency opportunity identified over the baseline.
pump @ $42K, minus the cost of the 150kW boiler it is replacing @$11K, an additional hot water circuit for
Domestic Hot Water @$10K, and the additional cost of the Sewage SHARC component @$223K.
The following indicative capital costs have been estimated by Beca energy modelling team generally based on
Energy Piles ($303K): Based on additional costs of piping, pumps, pile detailing, and additional non-steel
previous project experience and supplier costs, however we recommend these are each confirmed by the project
casing concrete pile construction costs for the 39 proposed piles greater than 1m in diameter @ $303K
cost consultant:
(contractor’s estimate of an additional 20% to pile construction costs).
Daylight Harvesting to FOH Areas ($21K): This allows for the installation of daylight sensors, wiring,
Combined Design Opportunities ($419K): The combined capital cost increase of the selected
controllers and associated controls programming
opportunities: Low SFP, Variable Speed Cooling Tower Fans, Variable Volume Condensing Water Loop, Air
Economisers ($5K): This allows for the inclusion of wiring and associated BMS programming to the VAV
Sourced Heat Pump, and Energy Piles.
AHUs.
Roof Mounted PV ($344K): Based on installation costs of purchasing a 160kW PV system @ $2,150 per
Exhaust Air Heat Recovery ($20K): Additional costs of run around coils, piping and extra pumps of
kW.
additional circuit, and larger fans to compensate for higher pressure drop across the additional heat recovery
coils.
The current WCC energy rates have been used as follows:
Demand Controlled Ventilation (DCV) ($15K): This allows for the installation of air quality sensors, wiring
Electricity: $0.10 per kWh
and associated BMS programming
Natural gas: $0.05 per kWh
HVAC Off overnight ($0): No additional cost for switching off HVAC overnight as it is a Building
Management System (BMS) schedule change.
The payback periods have been compared based on the following calculation while taking account of typical
Combined HVAC Control Opportunities ($61K): The combined capital cost increase of the selected
rates of inflation:
opportunities: Daylight Harvesting, DCV, Exhaust Air Heat Recovery, Economiser, and HVAC Off Overnight.
Condensing Loop Heat Pump ($40K): Based on additional costs of purchasing 62kW Water Sourced Heat
Payback Period (in years) = Initial Investment Cost / Annual Operating Savings
Pump @ $30K and associated pipework and controls @$10k.
Magnetic Bearing Water Cooled Chillers ($118): Based on additional costs of purchasing two 1200kW
Note that the following considerations have been allowed for in these calculations:
magnetic bearing water cooled chillers @ $277K each compared to two typical York centrifugal 1200kW
Any reduction in heating or cooling plant or equipment costs as a result of each energy efficiency opportunity
water cooled chillers @$218K each. No maintenance cost savings have been incorporated.
has not been considered
Low SFP ($16K): Based on additional costs of purchasing larger duct sizes @ $426K to reduce static
An annual 2.5% inflation increase has been used as instructed by WCC
pressure by 20% to achieve a SFP of 2W/l.s compared to smaller duct sizes @$410K which have 20% higher
A 6.5% discount rate has been used as instructed by WCC
static pressure and have a SFP of 2.5W/l.s.
Maintenance costs have been excluded
Variable Speed Cooling Tower Fans ($10K): This allows for the installation of VSDs, to include wiring and
Potential to send any excess power generated by PVs back to the electrical grid
associated BMS programming.
Variable Volume Condenser Water loop ($50K): This allows for the installation of VSDs to Condensing
A summary of the financial analysis can be seen in the following table:
Water pumps and includes wiring, associated BMS programming, and additional cost of indirect cooling
towers versus direct cooling tower.
Table 3 – Financial Analysis Summary
Enhanced HVAC Control Opportunities
Enhanced Energy Efficient Design Opportunities
Financial
Daylight
Variable
Air to
Waste
Variable
Exhaust
Combined
Condensing
Magnetic
Low SFP
Combined
Roof
Performance
Harvesting
HVAC Off
Speed
Water
Water
Volume
Energy
Indicator
Economiser
Air Heat
DCV
HVAC Control
Loop Heat
Bearing Water
Air
Design
Mounted
to FOH
Overnight
Cooling
Heat
Heat
Condenser
Piles
areas
Recovery
Opportunities
Pump
Cooled Chiller
Handling
Opportunities
PV
Tower Fans
Pump
Pump
Water Loop
Indicative
$21k
$5k
$20k
$15k
$0k
$61k
$40k
$118k
$17k
$10k
$39k
$264k
$50k
$303k
$419k
$344k
Capital Cost4
Payback
12 years
1 years
5 years
2 years
0 years
2 years
80 years
31 years
1 years
1 years
7 years
39 years
2 years
6 years
6 years
12 years
Period5
20 year NPV6
$800
$89,000
$42,000
$174,000
$561,000
$742,000
-$34,000
-$67,000
$284,000
$361,000
$31,000
-$174,000
$419,000
$338,000
$495,000
-$10,000
20 year IRR
7.0%
1
42.5%
25.2%
96.8%
NA
101.0%
-9.0%
-1.7%
134.9%
280.1%
14.4%
-3.5%
72.6%
17.2%
17.8%
6.2%
4
Based on indicative increased capital cost over baseline option. Order of capital costs TBC by Cost Consultant. Excluding
GST, contractor P+G and margins, contingency allowance, and professional fees. These estimates are for comparison
purposes only, and not to establish construction budget or estimate operating expenses. 5
Based on WCC electricity rate of 10ȼ/kWh and gas rate of 5ȼ/kWh with a 2.5% annual inflation rate assumed
6
Assumes a 6.5% discount rate
Beca // 3 June 2016
5138221 // NZ1-12429047-20 0.20 // page 9
MACC - EECA Programme 2B Energy Efficiency Review (Building Services)
8
Comments & Recommendations
8.2.3
Heat rejection
The largest single energy saving option, and also the largest capital cost investment, is indicated to be the
installation of Energy Piles. Energy Piles use the ground as an energy transfer medium, in this case as a
We recommend that WCC considers including the HVAC controls and design opportunities subject to meeting
medium to reject heat. Energy Piles reduce the cooling energy consumption because it uses the ground as a
their investment criteria and the project budget. Consideration should be given to the visual statement and
means to cool the condensing water. Energy Piles would initially cost approximately $300K and offer an annual
marketing opportunity a PV installation would represent
energy cost reduction over $40K per year. Energy Piles are indicated to have a payback period of 6 years, a 20
year NPV of over $337K and an IRR of 17.2%. This suggests Energy Piles would offer a good return on
8.1
Controls Opportunities
investment. If this option is to be pursued, it is recommended to undertake a detailed feasibility study which
determines the make-up of the ground conditions and potentially use a test pile as a means to assess the
Implementing energy efficient HVAC control opportunities in the building services design are indicated to offer
performance of a potential Energy Pile system
significant energy savings when compared to the baseline. The combined savings of implementing Daylight
Harvesting, Economiser, DCV, Exhaust Air Heat Recovery, and switching the Movie Museum Galleries HVAC
Off is indicated to offer 44kWh/m2 per year with a reduction of 134 tonnes of associated Greenhouse Gas (GHG)
8.3
Photovoltaics
emissions. This represents good practice and improves on the baseline (which represents a minimal level of
Installing a roof mounted PV system would represent a visual statement that WCC and MACC development are
energy performance). The HVAC controls opportunities have a payback period of 2 years, an NPV of $740K
sustainability and environmentally focussed. The potential energy generation from the system is indicated to
across a 20 year period and an IRR of 101%. It suggests the options would result in a favourable return on
reduce energy and GHG emissions substantially at 16kWh/m2 and 45 tonnes of GHG per year respectively. The
investment.
payback for installing a PV system is 12 years. The large reduction in emissions and the visual aspect of the
solar collectors on the roof provides a great marketing statement. It is assumed all energy generated is used
8.1.1
HVAC scheduling
onsite.
A high energy saving opportunity is indicated to be offered by switching off HVAC in the Movie Museum
galleries. The payback period for the option is 0 years because it does not require any additional costs.
8.2
Design opportunities
Further energy reductions can be achieved by installing Variable Speed Cooling Tower Fans, Variable Volume
Condensing Water Loop, Air Sourced Heat Pump, Energy Piles and designing for central air handling to have a
Low SFP. The combination of the these energy efficient design opportunities is indicated to provide a further
energy reduction of 69kWh/m2 per year, $86K of cost savings per year, and a reduction of 188 tonnes of
associated GHG emissions. The combined opportunities have a short payback period of 6 years, even with the
low energy rates WCC are currently paying. The 20 year NPV of the combined design opportunities is indicated
to be over $500K with an IRR of 19.8%, which suggests the options would again result in a favourable return on
investment.
8.2.1
Heating source
Of the three different heat pump options (Condensing Water Loop, Air Sourced and Waste Water), the Air
sourced heat pump is the only option that provides a positive NPV over a 20 year period. The Air Sourced Heat
Pump is indicated to have a 7 year payback, a 20 year NPV of approximately $31K and an IRR of 14.6%. The
reason the condensing loop Heat Pump does not financially stack up, with a payback of 64 years, is due to the
limited energy savings it could provide as there is a minimal occurrence of coincident heating and cooling load.
Conversely, the Waste Water Heat Pump offers high energy savings, but the payback is indicated to be 39 years
and is due to the very high capital cost investment required of approximately $263.5K (primarily due to the
Sewage SHARC cost of approximately $223K).
8.2.2
Cooling source
The magnetic bearing water cooled chiller does not provide a favourable return on investment with a payback of
31 years. This is largely due to the low cooling energy load and the low WCC energy costs. The financial
assessment of the magnetic bearing water cooled chiller does not include any cost savings from lower
maintenance costs.
Beca // 3 June 2016
5138221 // NZ1-12429047-20 0.20 // page 10
MACC - EECA Programme 2B Energy Efficiency Review (Building Services)
9
Next Steps
10 Energy Management
We propose the following next steps:
While the energy efficiency opportunities identified may offer significant energy savings, it is the operational
stage of a building where energy savings are realised. Implementing an energy management system and
1) Client team to review report & discuss with Beca
organisational plan that meets/exceeds ISO 50-001 (Energy Management) standards will aid in targeting a
reduced energy consumption, carbon emissions and energy costs.
2) Project QS to review energy efficiency opportunities and confirm implementation cost
3) Project team to incorporate energy efficiency opportunities into building design subject to meeting WCC
An energy management system enables an organisation to follow a systematic approach in achieving continual
improvement of energy performance.
investment criteria and project budget
4) Project team to ensure energy efficient plant and equipment selection is retained throughout the design
Having an effective energy management system offers several important opportunities:
and construction phase on the project
Lower operating costs
Improved environmental performance
5) WCC and MACC to consider implementing a comprehensive 2 year building tuning programme (in
Longer equipment life
conjunction with the main contractor and design team) to ensure the building is operating as per the
Better risk management
design intent
More effective, lower cost maintenance (Proactive)
Improved thermal comfort and indoor air quality, and
We recommend WCC and MACC apply for EECA Programme 2C (Commissioning) and 2D (Assessing
Enhance public image
energy performance after occupation) to provide funding assistance with this.
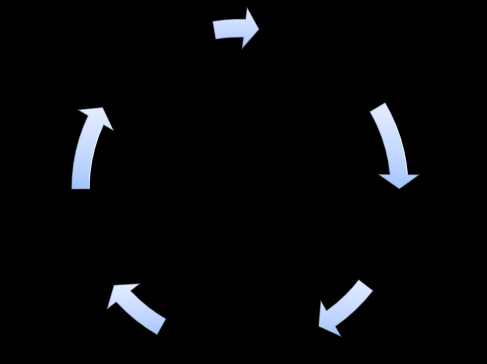
Energy
Energy Management system initiatives include:
Management
Creating a Plan
Cycle
– Energy Policy
– Objectives and Targets
Reviewing the current systems
Identifying improvements
Implementing improvements
Measuring and Verifying improvements
Reviewing the energy management system
The Energy Efficiency and Conservation Authority (EECA) have various funding schemes which help to
implement an effective energy management system:
Energy Management Plan: EECA can potentially fund up to 40% of costs (up to $100,000) for this work
– Setting up a system to manage your energy, including development of an energy policy
– Identifying your main areas of energy use
– Setting an energy-savings target
– Creating plans to prioritise energy-saving opportunities.
Systems Optimisation: EECA can potentially fund up to 40% of costs (up to $100,000) for this work
– Identifying areas for improved energy efficiency
– Tuning and recalibrating existing equipment
Monitoring & Targeting: EECA can potentially fund up to 40% of costs (up to $100,000) for this work
– Implementing a monitoring & targeting system
– Analysing, comparing and benchmarking energy use
– Target setting
– Reporting
Beca // 3 June 2016
5138221 // NZ1-12429047-20 0.20 // page 11

MACC - EECA Programme 2B Energy Efficiency Review (Building Services)
Appendix A
Computer Simulation Model
Inputs
Beca // 3 June 2016
5138221 // NZ1-12429047-20 0.20 // page 12
MACC - EECA Programme 2B Energy Efficiency Review (Building Services)
Table 4 - Baseline Model Building Services inputs
Model Item
Baseline Energy Model Input
Model Input
Comment
Model Item
Baseline Energy Model Input
Model Input
Comment
Reference
Reference
Design space
Convention Centre Space Plenary,
Project
Building
Based upon SPA architectural
temperature and
Documentation
humidity conditions
Pre-Function, General Office, Meeting
Mechanical
documents: dated 12 April 2016.
Rooms and Movie Museum Galleries:
engineer
23°C Cooling
Beca draft building services
preliminary design as at 6 May
20°C Heating
2016.
Convention Centre BOH Circulation
Thermal simulation
IES Virtual Environment version
CIBSE
18°C Heating
software
2015
Movie Museum BOH Circulation
Weather file for
NIWA Wellington TMY2
Assumed
IWEC files have shown to
18°C Heating
thermal simulation
contain errors in
Kitchen
temperature data
16°C Heating
Outdoor Design
Summer:
NIWA
2.5% design day criteria
conditions
23.6oC DB
Humidity:
18.9oC WB
Not controlled
#hrs exceeded is 45
Winter
Lighting power
Convention Centre:
Project Electrical
LED lighting design
5.2oC
density
Exhibition: 8 W/m2
Engineer.
lighting power density
#hrs exceeded is 110
Plenary: 12 W/m2
Pre-Function: 12 W/m2
Ground solar
0.20
(CIBSE) Assumed
reflectance
General Office Areas: 6 W/m2
Asphalt
Meeting Rooms: 12 W/m2
Modelled spaces
Circulation – Area FOH : 8 W/m2
All conditioned and unconditioned
Architectural
spaces in the building
drawings
Circulation – Area BOH : 5 W/m2
Movie Museum:
Areas for each space taken from
Project
Galleries: 8 W/m2
architectural drawings – 04/05/2016
mechanical
Circulation – Area BOH : 4 W/m2
engineer
Assessed spaces
Conditioned spaces
Project
Energy consumption of
the retail areas is not
Lighting schedule
Mechanical
Office and Museum: NABERS
NABERS
engineer
considered.
Convention Centre: Adapted
Thermal zoning
NABERS for 9am to 10pm operation
Spaces zoned to align with
Project
Peak equipment
Convention Centre:
mechanical system design
Mechanical
CIBSE Guide A
gains
Exhibition: 5 W/m2
engineer
Table 6.2
Plenary: 15 W/m2
Assumptions
Manually controlled
Not modelled
Project
external shading
Pre-Function: 15 W/m2
NABERS
device e.g. solar
Mechanical
General Office Areas: 11 W/m2
control blinds,
engineer
Meeting Rooms: 11 W/m2
external louvres etc
Circulation – Area FOH : 5 W/m2
Automatically
Circulation – Area BOH : 5 W/m2
Not modelled
Project
controlled shading
Movie Museum:
device e.g. solar
Mechanical
Galleries: 5 W/m2
control blinds,
engineer
Circulation – Area BOH : 5 W/m2
external louvres
Equipment
NABERS schedule for equipment is
NABERS
schedule
adapted similar to the lighting
schedule
Beca // 3 June 2016
5138221 // NZ1-12429047-20 0.20 // page 13
MACC - EECA Programme 2B Energy Efficiency Review (Building Services)
Model Item
Baseline Energy Model Input
Model Input
Comment
Model Item
Baseline Energy Model Input
Model Input
Comment
Reference
Reference
Process load
Not modelled
Project
Covered under
Outside air
Convention Centre:
Beca design
density
Mechanical
equipment gains
ventilation rate
Exhibition: 8l/s.person
features report
engineer
Plenary: 8l/s.person
Occupancy density
Meeting Rooms: 10l/s.person
Convention Centre
Project business
Represent typical
General Offices: 10l/s.person
Kitchen/Cafe: 5m2 / person
case
diversified density
Circulation – FOH and BOH:
Circulation – FOH and BOH: 5m2/
1l/s.person
person
Kitchen: 8l/s.person
Exhibition: 12m2 / person
Cafe: 10l/s.person
Plenary: 12 m2 / person
Movie Museum:
Meeting Rooms: 12 m2 / person
Museum Gallery spaces:
Office: 15m2 / person
8l/s.person
Lobby: 5m2 / person
Lobby/Circulation: 10l/s.person
Movie Museum:
Gallery: 29m2 / person
Outside air control
Project
No heat recovery or
Museum:
Lobby: 5m2 / person
mechanical
demand controlled
9am to 7pm, 365 Days a year
Occupancy gains
engineer
ventilation
Exhibition, BOH, and Lobby : 75W
CIBSE Guide A
Convention Centre:
sensible, 55W latent
9am to 10pm, 7 days per week
Kitchen:80W sensible 80W latent
Boiler SEER
Outdoor air preheat and
Plenary, Meeting, and Offices:70W
90% (condensing gas fired boiler)
Assumed
4pipe FCU unit heating
sensible 35W latent
NZBC Clause H1
Chiller SEER
Full Load: 5.5 (water source chiller)
New water cooled
Typical water cooled
Occupancy
NABERS schedule for occupancy is
NABERS
chiller plant
chiller efficiency
schedule
Part load: 6.1
adapted similar to the lighting
schedule
Heating Hot Water
HHW design flow temp: 60oC -70oC
Project
Infiltration rate
0.15 ACH all of the time ( 24hour
Project
Loop
HHW design delta T: 10oC
Mechanical
occupancy)
mechanical
HHW pump configuration: Constant
Engineer
engineer
Primary, Variable Secondary
Night purge
Not modelled
Project
ventilation
Chilled Water Loop
CHW design flow temp:6oC -12oC
Project
mechanical
CHW design delta T: 6oC
Mechanical
engineer
CHW pump configuration: Constant
Engineer
Pressurisation
None
Project
Primary, Variable Secondary
requirements
mechanical
engineer
Condensing Water
CDW design flow temp:29oC -35oC
Project
HVAC operating
Museum exhibition: 24/7 all year
Loop
CDW design delta T: 6oC
Mechanical
Project
schedule
round
CDW pump configuration: Constant
Engineer
mechanical
Convention: 8am to 10pm, 7 days
Flow
engineer
per week
1.5 hour optimum start period
Pipe/duct heat
5% allowance
Assumed
Mechanical
loss/gains
Design room temperatures achieved Project
services control
during occupancy hours
mechanical
Pumps
Based on design flow rates
Assumption
strategy
engineer
AHU Fans
16°C preheat temperature
Project
Typical fan efficiency
Heating coil via HHW gas boiler
mechanical
circuit
engineer
10 no. AHU Variable Volume Fans:
– Flow rates sized using IES
ApacheHVAC
– 2.5W/l.s
Beca // 3 June 2016
5138221 // NZ1-12429047-20 0.20 // page 14
MACC - EECA Programme 2B Energy Efficiency Review (Building Services)
Table 5 - Baseline Model Architectural inputs
Model Item
Baseline Energy Model Input
Model Input
Comment
Reference
Model Item
Baseline Energy Model Input
Model Input
Comment
Supply Air Fans
18°C preheat temperature
Project
Typical fan efficiency
Reference
Heating coil via HHW gas boiler
mechanical
Site location
As site location
Assumed
circuit
engineer
2 no. fans:
Longitude = 174.80 E
– SAF-01-01: 2,000l/s
Latitude = 37.02 S
– SAF-05-01: 6,000l/s
Site Orientation
As site location
Architectural
2.5W/l.s
plan drawings
Building
Adjacent buildings modelled
Architectural
FCU fans
1 per FCU Zone
Project
Typical AC type FCU fan
Overshadowing
drawings
2.5W/l.s
mechanical
performance
Building Geometry
engineer
As shown on architectural drawings
Architectural
Exhaust Air fans
7 no. fans:
drawings
Project
Typical fan type
–
Building thermal
EAF-01-01: 2,000 l/s
mechanical
performance
External walls: R 2 m2.K/W (including
H1 minimum
Refer to EECA 2A
envelope
– EAF-05-01: 4,000 l/s
engineer
thermal bridging effects)
values
report
– EAF-05-02: 3,500 l/s
Roof: Total R-value: R 3 m2.K/W (including
– EAF-05-03: 2,500 l/s
thermal bridging effects)
– EAF-05-04: 2,500 l/s
R 1.3 ground floor
– EAF-06-01: 2,000 l/s
Vision Glazing:
– EAF-06-02: 6,000 l/s
– Uwindow: U 3.0 W/m2.K (including frame
2.5W/l.s
effect)
Glazing shading
Vision glazing:
NZS4218
Refer to EECA 2A
coefficient
Lifts
– Shading Coefficient: 0.40
report
4 kWh/m2 per year
GreenStar Office
–
Design & Built
G value: 0.35
Internal walls
2009
13mm plasterboard lining, 90mm timber
Architectural
framing, 13mm plasterboard lining
DHW
drawings
4 kWh/m2 per year
GreenStar Office
Intermediate floors
Design & Built
Carpet +underlay, 150mm concrete slab,
Architectural
2009
1000mm ceiling cavity, 13mm plasterboard
drawings
External surface
0.5 (medium coloured) to be assigned to all
Assumed
solar reflectance
external surfaces
External lighting
2 kWh/m2 per year
Assumed
Area of glazing
As per proposed design
Architectural
drawings
Area of frame
10% glazing area
Assumed
Area of skylight/
None
Architectural
clerestory
drawings
Fixed external solar
Fixed Solar Shading modelled as per the
Architectural
Basecase
shading device
proposed design.
drawings
allowance
Manually controlled
Blinds are not operated
Assumed
curtains/blinds
Manually controlled
Not proposed
Assumed
natural ventilation
opening
Beca // 3 June 2016
5138221 // NZ1-12429047-20 0.20 // page 15
MACC - EECA Programme 2B Energy Efficiency Review (Building Services)
Table 6 – NABERS lighting schedule
Convention Centre areas:
Museum and Office areas:
12am-
7am-
8am-
9am-
10pm-
11pm-
7am
8am
9am
10pm
11pm
12pm
12am-
7am-
8am-
9am-
5pm-
6pm-
8pm-
9pm-
7am
8am
9am
5pm
6pm
8pm
9pm
12am
Week
0%
15%
60%
100%
50%
15%
Saturday
0%
15%
60%
100%
50%
15%
Week
15%
40%
90%
100%
80%
60%
50%
15%
Sunday
0%
15%
60%
100%
50%
15%
Saturday
15%
40%
90%
100%
80%
60%
50%
15%
Sunday
15%
40%
90%
100%
80%
60%
50%
15%
Table 9 – Energy Efficiency Opportunities
Convention Centre areas:
Model Item
Energy Model Input
Model Input Reference
Switch Movie Museum
HVAC only operates from 8am to 7pm.
Project mechanical engineer
12am-
7am-
8am-
9am-
10pm-
11pm-
7am
8am
9am
10pm
11pm
12pm
HVAC Off overnight
A 1.5 hour optimum start period
Week
15%
40%
90%
100%
80%
50%
Exhaust air heat recovery
Run around coil
Project mechanical engineer
Saturday
15%
40%
90%
100%
80%
50%
50% heat recovery effectiveness
Sunday
15%
40%
90%
100%
80%
50%
Demand Control
Outside air supply reduces to as a percentage
Estimated based on
Ventilation
based on diversified design occupant density
Table 7 – NABERS equipment schedule
European studies. Actual
requirement will be
Museum and Office areas:
dependent on the project and
building occupancy rates
12am-
7am-
8am-
9am-
5pm-
6pm-
7pm-
9pm-
Economiser cycles (free
Up to 20oC outdoor air temperature: when outside
7am
8am
9am
5pm
6pm
7pm
9pm
12am
cooling)
air temperature is lower than indoor air
Week
25%
65%
80%
100%
80%
65%
25%
25%
temperature, the economiser cycle is used.
Saturday
25%
65%
80%
100%
80%
65%
25%
25%
Daylight harvesting to
Sunday
25%
65%
80%
100%
80%
65%
25%
25%
Reduced NABERS office lighting schedule by
NABERS
FOH areas
20% in FOF perimeters areas
Combined HVAC Control
Convention Centre areas:
All of the above
Opportunities
12am-
7am-
8am-
9am-
10pm-
11pm-
7am
8am
9am
10pm
11pm
12pm
Waste Water Sourced
3.73 (Water sourced heat pump)
Based on York water sourced
Heat Pump SEER
150kW
heat pump selection with
Week
25%
65%
80%
100%
80%
25%
Evaporator water in
Saturday
25%
65%
80%
100%
80%
25%
temperature of 15oC and
Sunday
25%
65%
80%
100%
80%
25%
supplying 50oC/45oC hot
water
Table 8 – NABERS occupancy schedule
Air sourced Heat Pump
3.0 (Air cooled heat pump)
Based on typical air sourced
Museum and Office areas:
SEER
150kW – equates to 90th percentile heat load.
heat pump selection
12am-
7am-
8am-
9am-
5pm-
6pm-
7pm-
9pm-
Condensing circuit water
3.86 (water cooled heat pump)
Based on York water sourced
7am
8am
9am
5pm
6pm
7pm
9pm
12am
sourced Heat Pump
62kW – is maximum coincident heating and
heat pump selection with
SEER
cooling load.
Evaporator water in
Week
0%
15%
60%
100%
50%
15%
5%
0%
temperature of 22oC and
Saturday
0%
15%
60%
100%
50%
15%
5%
0%
supplying 50oC/45oC hot
Sunday
0%
15%
60%
100%
50%
15%
5%
0%
water
Beca // 3 June 2016
5138221 // NZ1-12429047-20 0.20 // page 16
MACC - EECA Programme 2B Energy Efficiency Review (Building Services)
Model Item
Energy Model Input
Model Input Reference
Model Item
Energy Model Input
Model Input Reference
(Energy Piles) Ground
25W/m of heat rejection through water loop
Combined Energy
Ground sourced cooling and
Current Design proposal with the following
As above
Sourced heat coupling
Efficient Design
circulating through buildings piles.
opportunities combined:
through piles
energy pile literature.
Opportunities
2 loops of piping per pile
– Air Sourced Heat Pump
Pile details:
– Energy Piles
– 15 piles at 29m
– Variable Speed Cooling Towers
– 17 piles at 29.5m
– Variable Volume Condensing Water Loop
– 7 piles at 24.5m
– Low Specific Fan Power Central Air Handling
Equates to approximately 100kW of heat rejection
Roof-mounted
10m2 per kW of install PV: 160kW
Based on NIWA Sunshine
capacity
photovoltaic array
26% efficiency drop due to inclination and
hours for Wellington and
Increased Pump energy was included
orientation and system losses.
SolarKing PV 260W (per
Magnetic Bearing Water
50% of roof area available for PV to be installed:
panel) selection.
1200kW chiller
Based on a Powerpax
Cooled High Efficiency
– Roof area: 1600m2
Magnetic Bearing
Magnetic Bearing
1200kW water cooling chiller
Chiller
– Effective PV panel area: 955m2
water cooled chiller
water cooled chiller
selection supplying 6oC/12oC.
NIWA Mean monthly total sunshine (hours)
10 point part load
10 point part load
for Wellington
COPs:
COPs:
–
1150kW: 5.81 COP
– 1150kW: 5. 5 COP
– 1035 kW: 6.63
– 1035 kW: 6.1 COP
COP
– 115kW: 6.1 COP
– 920kW: 7.56 COP
– 805kW: 8.66 COP
– 690kW: 10.07 COP
– 575kW: 11.96 COP
– 460kW: 12.33 COP
– 345kW: 12.47 COP
– 230kW: 13.23 COP
115kW: 13.86 COP
Variable speed cooling
Fans vary speed based on outdoor air
tower fans
temperature:
– 100% fan speed at 24.8oC outdoor air
temperature
Does not account for reduced fan speed
requirements due to low cooling load.
Variable volume
Pumps vary speed proportionally to cooling load:
condenser water loop
– 10% to 40% cooling load: 6% pump speed
(Open versus closed
towers)
– 50% cooling load: 13% pump power
– 60% cooling load: 22% pump power
– 70% cooling load: 34% pump power
– 80% cooling load: 51% pump power
– 90% cooling load: 73% pump power
– 100% cooling load: 100% pump power
Low specific fan power
A 20% improvement on baseline SFP:
Typical fan efficiency
Central Air Handling
– 2.0W/l.s
– Supply and return air fans
Beca // 3 June 2016
5138221 // NZ1-12429047-20 0.20 // page 17

MACC - EECA Programme 2B Energy Efficiency Review (Building Services)
Appendix B
Financial Performance
Analysis
Beca // 3 June 2016
5138221 // NZ1-12429047-20 0.20 // page 18
MACC - EECA Programme 2B Energy Efficiency Review (Building Services)
Daylight Harvesting to FOH areas
Years
Annual
Cummulative
Payback
Capital
Annual Cash
Present Value of
Net Present Value of
Savings
Savings
Investment
Flow
Saving
Savings
Client Input Values
0
$0
$0
-$21,000
$21,000
-$21,000
-$21,000
-$21,000
Inflation Rate
2.5%
1
$1,633
$1,633
-$19,367
$0
$1,633
$1,533
-$19,467
Discount Rate
6.5%
2
$1,674
$3,307
-$17,693
$0
$1,674
$1,476
-$17,991
3
$1,716
$5,022
-$15,978
$0
$1,716
$1,420
-$16,571
4
$1,759
$6,781
-$14,219
$0
$1,759
$1,367
-$15,204
Assessment Inputs
5
$1,803
$8,584
-$12,416
$0
$1,803
$1,316
-$13,888
Capital Cost
$ 2
1,000
6
$1,848
$10,431
-$10,569
$0
$1,848
$1,266
-$12,622
Secondary Capital Cost
$ -
7
$1,894
$12,325
-$8,675
$0
$1,894
$1,219
-$11,403
Time of Secondary Capital Cost (Years)
0
8
$1,941
$14,266
-$6,734
$0
$1,941
$1,173
-$10,230
Annual Savings
$1,633
9
$1,990
$16,256
-$4,744
$0
$1,990
$1,129
-$9,101
Assessment Length (Years)
20
10
$2,039
$18,295
-$2,705
$0
$2,039
$1,086
-$8,015
11
$2,090
$20,386
-$614
$0
$2,090
$1,046
-$6,969
12
$2,143
$22,528
$1,528
$0
$2,143
$1,006
-$5,963
Assessment Results
13
$2,196
$24,724
$0
$2,196
$969
-$4,994
Payback Period (years)
12.0
14
$2,251
$26,975
$0
$2,251
$932
-$4,062
Total NPV
$840
15
$2,307
$29,283
$0
$2,307
$897
-$3,165
IRR
7.0%
16
$2,365
$31,648
$0
$2,365
$863
-$2,302
ROI
99%
17
$2,424
$34,072
$0
$2,424
$831
-$1,471
18
$2,485
$36,557
$0
$2,485
$800
-$671
25
19
$2,547
$39,104
$0
$2,547
$770
$99
20
$2,611
$41,714
$0
$2,611
$741
$840
Total
$41,714
$840
Inflation Rate
Glossary of Terms
Discount Rate
The discount rate is the rate at which cash
depreciates with time, hence the value of annual
savings decreases.
Capital Cost
Capital costs are fixed one time expenses,
typically the purchase of plant.
Present Value (PV)
PV is the present day value of the future returns
from the investment.
Internal Rate Of Return (IRR)
IRR is the discount rate that make the NPV = 0
at the end of the assessment period. i.e. The
Internal Rate of Return is the rate where if you
discount all of the future cash flows, the present
value of the flows is equal to the cost.
Net Present Value (NPV)
NPV is the sum of all previous PV's.
Beca // 3 June 2016
5138221 // NZ1-12429047-20 0.20 // page 19
MACC - EECA Programme 2B Energy Efficiency Review (Building Services)
Economiser
Years
Annual
Cummulative
Payback
Capital
Annual Cash
Present Value of
Net Present Value of
Savings
Savings
Investment
Flow
Saving
Savings
Client Input Values
0
$ -
$ -
$ ( 5,000) $ 5
,000
$ ( 5,000) $ ( 5,000) $ ( 5,000)
Inflation Rate
2.5%
1
$ 7
,001
$ 7
,001
$ 2
,001
$ -
$ 7
,001
$ 6
,574
$ 1
,574
Discount Rate
6.5%
2
$ 7
,176
$ 1
4,177
$ -
$ 7
,176
$ 6
,327
$ 7
,901
3
$ 7
,355
$ 2
1,532
$ -
$ 7
,355
$ 6
,089
$ 1
3,990
4
$ 7
,539
$ 2
9,072
$ -
$ 7
,539
$ 5
,860
$ 1
9,850
Assessment Inputs
5
$ 7
,728
$ 3
6,800
$ -
$ 7
,728
$ 5
,640
$ 2
5,491
Capital Cost
$ 5
,000
6
$ 7
,921
$ 4
4,721
$ -
$ 7
,921
$ 5
,429
$ 3
0,919
Secondary Capital Cost
$ -
7
$ 8
,119
$ 5
2,840
$ -
$ 8
,119
$ 5
,225
$ 3
6,144
Time of Secondary Capital Cost (Years)
0
8
$ 8
,322
$ 6
1,162
$ -
$ 8
,322
$ 5
,028
$ 4
1,172
Annual Savings
$ 7
,001
9
$ 8
,530
$ 6
9,692
$ -
$ 8
,530
$ 4
,840
$ 4
6,012
Assessment Length (Years)
20
10
$ 8
,743
$ 7
8,435
$ -
$ 8
,743
$ 4
,658
$ 5
0,669
11
$ 8
,962
$ 8
7,397
$ -
$ 8
,962
$ 4
,483
$ 5
5,152
12
$ 9
,186
$ 9
6,583
$ -
$ 9
,186
$ 4
,314
$ 5
9,467
Assessment Results
13
$ 9
,416
$ 1
05,998
$ -
$ 9
,416
$ 4
,152
$ 6
3,619
Payback Period (years)
1.0
14
$ 9
,651
$ 1
15,649
$ -
$ 9
,651
$ 3
,996
$ 6
7,616
Total NPV
$ 8
8,632
15
$ 9
,892
$ 1
25,541
$ -
$ 9
,892
$ 3
,846
$ 7
1,462
IRR
142.5%
16
$ 1
0,140
$ 1
35,681
$ -
$ 1
0,140
$ 3
,702
$ 7
5,164
ROI
3477%
17
$ 1
0,393
$ 1
46,074
$ -
$ 1
0,393
$ 3
,563
$ 7
8,727
18
$ 1
0,653
$ 1
56,727
$ -
$ 1
0,653
$ 3
,429
$ 8
2,156
25
19
$ 1
0,919
$ 1
67,646
$ -
$ 1
0,919
$ 3
,300
$ 8
5,456
20
$ 1
1,192
$ 1
78,838
$ -
$ 1
1,192
$ 3
,176
$ 8
8,632
Total
$ 1
78,838
$ 8
8,632
Inflation Rate
Glossary of Terms
Discount Rate
The discount rate is the rate at which cash
depreciates with time, hence the value of annual
savings decreases.
Capital Cost
Capital costs are fixed one time expenses,
typically the purchase of plant.
Present Value (PV)
PV is the present day value of the future returns
from the investment.
Internal Rate Of Return (IRR)
IRR is the discount rate that make the NPV = 0
at the end of the assessment period. i.e. The
Internal Rate of Return is the rate where if you
discount all of the future cash flows, the present
value of the flows is equal to the cost.
Net Present Value (NPV)
NPV is the sum of all previous PV's.
Beca // 3 June 2016
5138221 // NZ1-12429047-20 0.20 // page 20
MACC - EECA Programme 2B Energy Efficiency Review (Building Services)
Exhaust Air Heat Recovery (FCU system only)
Years
Annual
Cummulative
Payback
Capital
Annual Cash
Present Value of
Net Present Value of
Savings
Savings
Investment
Flow
Saving
Savings
Client Input Values
0
$ -
$ -
$ ( 20,000) $ 2
0,000
$ ( 20,000) $ ( 20,000) $ ( 20,000)
Inflation Rate
2.5%
1
$ 4
,634
$ 4
,634
$ ( 15,366) $ -
$ 4
,634
$ 4
,351
$ ( 15,649)
Discount Rate
6.5%
2
$ 4
,750
$ 9
,384
$ ( 10,616) $ -
$ 4
,750
$ 4
,188
$ ( 11,461)
3
$ 4
,869
$ 1
4,252
$ ( 5,748) $ -
$ 4
,869
$ 4
,030
$ ( 7,431)
4
$ 4
,990
$ 1
9,243
$ ( 757) $ -
$ 4
,990
$ 3
,879
$ ( 3,552)
Assessment Inputs
5
$ 5
,115
$ 2
4,358
$ 4
,358
$ -
$ 5
,115
$ 3
,733
$ 182
Capital Cost
$ 2
0,000
6
$ 5
,243
$ 2
9,601
$ -
$ 5
,243
$ 3
,593
$ 3
,775
Secondary Capital Cost
$ -
7
$ 5
,374
$ 3
4,975
$ -
$ 5
,374
$ 3
,458
$ 7
,233
Time of Secondary Capital Cost (Years)
0
8
$ 5
,508
$ 4
0,483
$ -
$ 5
,508
$ 3
,328
$ 1
0,562
Annual Savings
$ 4
,634
9
$ 5
,646
$ 4
6,129
$ -
$ 5
,646
$ 3
,203
$ 1
3,765
Assessment Length (Years)
20
10
$ 5
,787
$ 5
1,916
$ -
$ 5
,787
$ 3
,083
$ 1
6,848
11
$ 5
,932
$ 5
7,848
$ -
$ 5
,932
$ 2
,967
$ 1
9,815
12
$ 6
,080
$ 6
3,929
$ -
$ 6
,080
$ 2
,856
$ 2
2,671
Assessment Results
13
$ 6
,232
$ 7
0,161
$ -
$ 6
,232
$ 2
,749
$ 2
5,419
Payback Period (years)
5.0
14
$ 6
,388
$ 7
6,549
$ -
$ 6
,388
$ 2
,645
$ 2
8,065
Total NPV
$ 4
1,976
15
$ 6
,548
$ 8
3,097
$ -
$ 6
,548
$ 2
,546
$ 3
0,611
IRR
25.2%
16
$ 6
,711
$ 8
9,808
$ -
$ 6
,711
$ 2
,450
$ 3
3,061
ROI
492%
17
$ 6
,879
$ 9
6,687
$ -
$ 6
,879
$ 2
,358
$ 3
5,419
18
$ 7
,051
$ 1
03,738
$ -
$ 7
,051
$ 2
,270
$ 3
7,689
25
19
$ 7
,227
$ 1
10,966
$ -
$ 7
,227
$ 2
,184
$ 3
9,873
20
$ 7
,408
$ 1
18,374
$ -
$ 7
,408
$ 2
,102
$ 4
1,976
Total
$ 1
18,374
$ 4
1,976
Inflation Rate
Glossary of Terms
Discount Rate
The discount rate is the rate at which cash
depreciates with time, hence the value of annual
savings decreases.
Capital Cost
Capital costs are fixed one time expenses,
typically the purchase of plant.
Present Value (PV)
PV is the present day value of the future returns
from the investment.
Internal Rate Of Return (IRR)
IRR is the discount rate that make the NPV = 0
at the end of the assessment period. i.e. The
Internal Rate of Return is the rate where if you
discount all of the future cash flows, the present
value of the flows is equal to the cost.
Net Present Value (NPV)
NPV is the sum of all previous PV's.
Beca // 3 June 2016
5138221 // NZ1-12429047-20 0.20 // page 21
MACC - EECA Programme 2B Energy Efficiency Review (Building Services)
Demand Controlled Ventilation
Years
Annual
Cummulative
Payback
Capital
Annual Cash
Present Value of
Net Present Value of
Savings
Savings
Investment
Flow
Saving
Savings
Client Input Values
0
$ -
$ -
$ ( 15,000) $ 1
5,000
$ ( 15,000) $ ( 15,000) $ ( 15,000)
Inflation Rate
2.5%
1
$ 1
4,147
$ 1
4,147
$ ( 853) $ -
$ 1
4,147
$ 1
3,284
$ ( 1,716)
Discount Rate
6.5%
2
$ 1
4,501
$ 2
8,648
$ 1
3,648
$ -
$ 1
4,501
$ 1
2,785
$ 1
1,068
3
$ 1
4,863
$ 4
3,511
$ -
$ 1
4,863
$ 1
2,304
$ 2
3,373
4
$ 1
5,235
$ 5
8,746
$ -
$ 1
5,235
$ 1
1,842
$ 3
5,215
Assessment Inputs
5
$ 1
5,616
$ 7
4,361
$ -
$ 1
5,616
$ 1
1,398
$ 4
6,613
Capital Cost
$ 1
5,000
6
$ 1
6,006
$ 9
0,367
$ -
$ 1
6,006
$ 1
0,969
$ 5
7,582
Secondary Capital Cost
$ -
7
$ 1
6,406
$ 1
06,773
$ -
$ 1
6,406
$ 1
0,557
$ 6
8,140
Time of Secondary Capital Cost (Years)
0
8
$ 1
6,816
$ 1
23,590
$ -
$ 1
6,816
$ 1
0,161
$ 7
8,301
Annual Savings
$ 1
4,147
9
$ 1
7,237
$ 1
40,827
$ -
$ 1
7,237
$ 9
,779
$ 8
8,080
Assessment Length (Years)
20
10
$ 1
7,668
$ 1
58,494
$ -
$ 1
7,668
$ 9
,412
$ 9
7,492
11
$ 1
8,109
$ 1
76,604
$ -
$ 1
8,109
$ 9
,059
$ 1
06,550
12
$ 1
8,562
$ 1
95,166
$ -
$ 1
8,562
$ 8
,718
$ 1
15,269
Assessment Results
13
$ 1
9,026
$ 2
14,192
$ -
$ 1
9,026
$ 8
,391
$ 1
23,660
Payback Period (years)
2.0
14
$ 1
9,502
$ 2
33,694
$ -
$ 1
9,502
$ 8
,076
$ 1
31,735
Total NPV
$ 1
74,204
15
$ 1
9,989
$ 2
53,683
$ -
$ 1
9,989
$ 7
,772
$ 1
39,508
IRR
96.8%
16
$ 2
0,489
$ 2
74,172
$ -
$ 2
0,489
$ 7
,480
$ 1
46,988
ROI
2309%
17
$ 2
1,001
$ 2
95,173
$ -
$ 2
1,001
$ 7
,200
$ 1
54,188
18
$ 2
1,526
$ 3
16,700
$ -
$ 2
1,526
$ 6
,929
$ 1
61,117
25
19
$ 2
2,064
$ 3
38,764
$ -
$ 2
2,064
$ 6
,669
$ 1
67,786
20
$ 2
2,616
$ 3
61,380
$ -
$ 2
2,616
$ 6
,418
$ 1
74,204
Total
$ 3
61,380
$ 1
74,204
Inflation Rate
Glossary of Terms
Discount Rate
The discount rate is the rate at which cash
depreciates with time, hence the value of annual
savings decreases.
Capital Cost
Capital costs are fixed one time expenses,
typically the purchase of plant.
Present Value (PV)
PV is the present day value of the future returns
from the investment.
Internal Rate Of Return (IRR)
IRR is the discount rate that make the NPV = 0
at the end of the assessment period. i.e. The
Internal Rate of Return is the rate where if you
discount all of the future cash flows, the present
value of the flows is equal to the cost.
Net Present Value (NPV)
NPV is the sum of all previous PV's.
Beca // 3 June 2016
5138221 // NZ1-12429047-20 0.20 // page 22
MACC - EECA Programme 2B Energy Efficiency Review (Building Services)
Switch Movie Museum HVAC Off Overnight
Years
Annual
Cummulative
Payback
Capital
Annual Cash
Present Value of
Net Present Value of
Savings
Savings
Investment
Flow
Saving
Savings
Client Input Values
0
$ -
$ -
$ -
$ -
$ -
$ -
$ -
Inflation Rate
2.5%
1
$ 4
1,913
$ 4
1,913
$ 4
1,913
$ -
$ 4
1,913
$ 3
9,355
$ 3
9,355
Discount Rate
6.5%
2
$ 4
2,961
$ 8
4,874
$ -
$ 4
2,961
$ 3
7,877
$ 7
7,232
3
$ 4
4,035
$ 1
28,909
$ -
$ 4
4,035
$ 3
6,454
$ 1
13,686
4
$ 4
5,136
$ 1
74,044
$ -
$ 4
5,136
$ 3
5,085
$ 1
48,771
Assessment Inputs
5
$ 4
6,264
$ 2
20,308
$ -
$ 4
6,264
$ 3
3,767
$ 1
82,538
Capital Cost
$ -
6
$ 4
7,421
$ 2
67,729
$ -
$ 4
7,421
$ 3
2,499
$ 2
15,037
Secondary Capital Cost
$ -
7
$ 4
8,606
$ 3
16,335
$ -
$ 4
8,606
$ 3
1,278
$ 2
46,316
Time of Secondary Capital Cost (Years)
0
8
$ 4
9,821
$ 3
66,157
$ -
$ 4
9,821
$ 3
0,104
$ 2
76,419
Annual Savings
$ 4
1,913
9
$ 5
1,067
$ 4
17,224
$ -
$ 5
1,067
$ 2
8,973
$ 3
05,392
Assessment Length (Years)
20
10
$ 5
2,344
$ 4
69,567
$ -
$ 5
2,344
$ 2
7,885
$ 3
33,277
11
$ 5
3,652
$ 5
23,220
$ -
$ 5
3,652
$ 2
6,837
$ 3
60,115
12
$ 5
4,993
$ 5
78,213
$ -
$ 5
4,993
$ 2
5,829
$ 3
85,944
Assessment Results
13
$ 5
6,368
$ 6
34,581
$ -
$ 5
6,368
$ 2
4,859
$ 4
10,803
Payback Period (years)
0.0
14
$ 5
7,778
$ 6
92,359
$ -
$ 5
7,778
$ 2
3,926
$ 4
34,729
Total NPV
$ 5
60,550
15
$ 5
9,222
$ 7
51,581
$ -
$ 5
9,222
$ 2
3,027
$ 4
57,756
IRR
NA
16
$ 6
0,703
$ 8
12,283
$ -
$ 6
0,703
$ 2
2,162
$ 4
79,918
ROI
#DIV/0!
17
$ 6
2,220
$ 8
74,503
$ -
$ 6
2,220
$ 2
1,330
$ 5
01,248
18
$ 6
3,776
$ 9
38,279
$ -
$ 6
3,776
$ 2
0,529
$ 5
21,777
25
19
$ 6
5,370
$ 1
,003,649
$ -
$ 6
5,370
$ 1
9,758
$ 5
41,535
20
$ 6
7,004
$ 1
,070,653
$ -
$ 6
7,004
$ 1
9,016
$ 5
60,550
Total
$ 1
,070,653
$ 5
60,550
Inflation Rate
Glossary of Terms
Discount Rate
The discount rate is the rate at which cash
depreciates with time, hence the value of annual
savings decreases.
Capital Cost
Capital costs are fixed one time expenses,
typically the purchase of plant.
Present Value (PV)
PV is the present day value of the future returns
from the investment.
Internal Rate Of Return (IRR)
IRR is the discount rate that make the NPV = 0
at the end of the assessment period. i.e. The
Internal Rate of Return is the rate where if you
discount all of the future cash flows, the present
value of the flows is equal to the cost.
Net Present Value (NPV)
NPV is the sum of all previous PV's.
Beca // 3 June 2016
5138221 // NZ1-12429047-20 0.20 // page 23
MACC - EECA Programme 2B Energy Efficiency Review (Building Services)
Combined HVAC Control Opportunities
Years
Annual
Cummulative
Payback
Capital
Annual Cash
Present Value of
Net Present Value of
Savings
Savings
Investment
Flow
Saving
Savings
Client Input Values
0
$ -
$ -
$ ( 61,000) $ 6
1,000
$ ( 61,000) $ ( 61,000) $ ( 61,000)
Inflation Rate
2.5%
1
$ 6
0,076
$ 6
0,076
$ ( 924) $ -
$ 6
0,076
$ 5
6,409
$ ( 4,591)
Discount Rate
6.5%
2
$ 6
1,578
$ 1
21,654
$ 6
0,654
$ -
$ 6
1,578
$ 5
4,291
$ 4
9,700
3
$ 6
3,117
$ 1
84,771
$ -
$ 6
3,117
$ 5
2,252
$ 1
01,952
4
$ 6
4,695
$ 2
49,467
$ -
$ 6
4,695
$ 5
0,289
$ 1
52,241
Assessment Inputs
5
$ 6
6,313
$ 3
15,779
$ -
$ 6
6,313
$ 4
8,400
$ 2
00,641
Capital Cost
$ 6
1,000
6
$ 6
7,970
$ 3
83,750
$ -
$ 6
7,970
$ 4
6,582
$ 2
47,224
Secondary Capital Cost
$ -
7
$ 6
9,670
$ 4
53,419
$ -
$ 6
9,670
$ 4
4,833
$ 2
92,057
Time of Secondary Capital Cost (Years)
0
8
$ 7
1,411
$ 5
24,831
$ -
$ 7
1,411
$ 4
3,149
$ 3
35,206
Annual Savings
$ 6
0,076
9
$ 7
3,197
$ 5
98,028
$ -
$ 7
3,197
$ 4
1,528
$ 3
76,734
Assessment Length (Years)
20
10
$ 7
5,027
$ 6
73,054
$ -
$ 7
5,027
$ 3
9,969
$ 4
16,703
11
$ 7
6,902
$ 7
49,957
$ -
$ 7
6,902
$ 3
8,468
$ 4
55,170
12
$ 7
8,825
$ 8
28,782
$ -
$ 7
8,825
$ 3
7,023
$ 4
92,193
Assessment Results
13
$ 8
0,796
$ 9
09,577
$ -
$ 8
0,796
$ 3
5,632
$ 5
27,825
Payback Period (years)
2.0
14
$ 8
2,815
$ 9
92,393
$ -
$ 8
2,815
$ 3
4,294
$ 5
62,119
Total NPV
$ 7
42,465
15
$ 8
4,886
$ 1
,077,278
$ -
$ 8
4,886
$ 3
3,006
$ 5
95,125
IRR
101.0%
16
$ 8
7,008
$ 1
,164,286
$ -
$ 8
7,008
$ 3
1,766
$ 6
26,891
ROI
2416%
17
$ 8
9,183
$ 1
,253,470
$ -
$ 8
9,183
$ 3
0,573
$ 6
57,464
18
$ 9
1,413
$ 1
,344,882
$ -
$ 9
1,413
$ 2
9,425
$ 6
86,889
25
19
$ 9
3,698
$ 1
,438,580
$ -
$ 9
3,698
$ 2
8,320
$ 7
15,209
20
$ 9
6,041
$ 1
,534,621
$ -
$ 9
6,041
$ 2
7,256
$ 7
42,465
Total
$ 1
,534,621
$ 7
42,465
Inflation Rate
Glossary of Terms
Discount Rate
The discount rate is the rate at which cash
depreciates with time, hence the value of annual
savings decreases.
Capital Cost
Capital costs are fixed one time expenses,
typically the purchase of plant.
Present Value (PV)
PV is the present day value of the future returns
from the investment.
Internal Rate Of Return (IRR)
IRR is the discount rate that make the NPV = 0
at the end of the assessment period. i.e. The
Internal Rate of Return is the rate where if you
discount all of the future cash flows, the present
value of the flows is equal to the cost.
Net Present Value (NPV)
NPV is the sum of all previous PV's.
Beca // 3 June 2016
5138221 // NZ1-12429047-20 0.20 // page 24
MACC - EECA Programme 2B Energy Efficiency Review (Building Services)
Condensing Water Loop Heat Pump
Years
Annual
Cummulative
Payback
Capital
Annual Cash
Present Value of
Net Present Value of
Savings
Savings
Investment
Flow
Saving
Savings
Client Input Values
0
$ -
$ -
$ ( 40,000) $ 4
0,000
$ ( 40,000) $ ( 40,000) $ ( 40,000)
Inflation Rate
2.5%
1
$ 469
$ 469
$ ( 39,531) $ -
$ 469
$ 440
$ ( 39,560)
Discount Rate
6.5%
2
$ 481
$ 950
$ ( 39,050) $ -
$ 481
$ 424
$ ( 39,136)
3
$ 493
$ 1
,442
$ ( 38,558) $ -
$ 493
$ 408
$ ( 38,728)
4
$ 505
$ 1
,948
$ ( 38,052) $ -
$ 505
$ 393
$ ( 38,335)
Assessment Inputs
5
$ 518
$ 2
,465
$ ( 37,535) $ -
$ 518
$ 378
$ ( 37,957)
Capital Cost
$ 4
0,000
6
$ 531
$ 2
,996
$ ( 37,004) $ -
$ 531
$ 364
$ ( 37,594)
Secondary Capital Cost
$ -
7
$ 544
$ 3
,540
$ ( 36,460) $ -
$ 544
$ 350
$ ( 37,244)
Time of Secondary Capital Cost (Years)
0
8
$ 557
$ 4
,097
$ ( 35,903) $ -
$ 557
$ 337
$ ( 36,907)
Annual Savings
$ 469
9
$ 571
$ 4
,669
$ ( 35,331) $ -
$ 571
$ 324
$ ( 36,583)
Assessment Length (Years)
20
10
$ 586
$ 5
,254
$ ( 34,746) $ -
$ 586
$ 312
$ ( 36,271)
11
$ 600
$ 5
,855
$ ( 34,145) $ -
$ 600
$ 300
$ ( 35,970)
12
$ 615
$ 6
,470
$ ( 33,530) $ -
$ 615
$ 289
$ ( 35,681)
Assessment Results
13
$ 631
$ 7
,101
$ ( 32,899) $ -
$ 631
$ 278
$ ( 35,403)
Payback Period (years)
80.0
14
$ 647
$ 7
,747
$ ( 32,253) $ -
$ 647
$ 268
$ ( 35,135)
Total NPV
$ (
33,728)
15
$ 663
$ 8
,410
$ ( 31,590) $ -
$ 663
$ 258
$ ( 34,878)
IRR
-9.0%
16
$ 679
$ 9
,089
$ ( 30,911) $ -
$ 679
$ 248
$ ( 34,630)
ROI
-70%
17
$ 696
$ 9
,786
$ ( 30,214) $ -
$ 696
$ 239
$ ( 34,391)
18
$ 714
$ 1
0,499
$ ( 29,501) $ -
$ 714
$ 230
$ ( 34,161)
25
19
$ 731
$ 1
1,231
$ ( 28,769) $ -
$ 731
$ 221
$ ( 33,940)
20
$ 750
$ 1
1,980
$ ( 28,020) $ -
$ 750
$ 213
$ ( 33,728)
Total
$ 1
1,980
$ ( 16,039)
$ ( 33,728)
Inflation Rate
Glossary of Terms
Discount Rate
The discount rate is the rate at which cash
depreciates with time, hence the value of annual
savings decreases.
Capital Cost
Capital costs are fixed one time expenses,
typically the purchase of plant.
Present Value (PV)
PV is the present day value of the future returns
from the investment.
Internal Rate Of Return (IRR)
IRR is the discount rate that make the NPV = 0
at the end of the assessment period. i.e. The
Internal Rate of Return is the rate where if you
discount all of the future cash flows, the present
value of the flows is equal to the cost.
Net Present Value (NPV)
NPV is the sum of all previous PV's.
Beca // 3 June 2016
5138221 // NZ1-12429047-20 0.20 // page 25
MACC - EECA Programme 2B Energy Efficiency Review (Building Services)
Magnetic Bearing Water Cooled Chiller
Years
Annual
Cummulative
Payback
Capital
Annual Cash
Present Value of
Net Present Value of
Savings
Savings
Investment
Flow
Saving
Savings
Client Input Values
0
$ -
$ -
$ ( 118,000) $ 1
18,000
$ ( 118,000) $ ( 118,000) $ ( 118,000)
Inflation Rate
2.5%
1
$ 3
,780
$ 3
,780
$ ( 114,220) $ -
$ 3
,780
$ 3
,549
$ ( 114,451)
Discount Rate
6.5%
2
$ 3
,875
$ 7
,655
$ ( 110,346) $ -
$ 3
,875
$ 3
,416
$ ( 111,035)
3
$ 3
,971
$ 1
1,626
$ ( 106,374) $ -
$ 3
,971
$ 3
,288
$ ( 107,747)
4
$ 4
,071
$ 1
5,697
$ ( 102,303) $ -
$ 4
,071
$ 3
,164
$ ( 104,583)
Assessment Inputs
5
$ 4
,172
$ 1
9,869
$ ( 98,131) $ -
$ 4
,172
$ 3
,045
$ ( 101,537)
Capital Cost
$ 1
18,000
6
$ 4
,277
$ 2
4,146
$ ( 93,854) $ -
$ 4
,277
$ 2
,931
$ ( 98,606)
Secondary Capital Cost
$ -
7
$ 4
,384
$ 2
8,529
$ ( 89,471) $ -
$ 4
,384
$ 2
,821
$ ( 95,786)
Time of Secondary Capital Cost (Years)
0
8
$ 4
,493
$ 3
3,023
$ ( 84,977) $ -
$ 4
,493
$ 2
,715
$ ( 93,071)
Annual Savings
$ 3
,780
9
$ 4
,606
$ 3
7,628
$ ( 80,372) $ -
$ 4
,606
$ 2
,613
$ ( 90,458)
Assessment Length (Years)
20
10
$ 4
,721
$ 4
2,349
$ ( 75,651) $ -
$ 4
,721
$ 2
,515
$ ( 87,943)
11
$ 4
,839
$ 4
7,188
$ ( 70,812) $ -
$ 4
,839
$ 2
,420
$ ( 85,522)
12
$ 4
,960
$ 5
2,147
$ ( 65,853) $ -
$ 4
,960
$ 2
,329
$ ( 83,193)
Assessment Results
13
$ 5
,084
$ 5
7,231
$ ( 60,769) $ -
$ 5
,084
$ 2
,242
$ ( 80,951)
Payback Period (years)
31.0
14
$ 5
,211
$ 6
2,442
$ ( 55,558) $ -
$ 5
,211
$ 2
,158
$ ( 78,793)
Total NPV
$ (
67,446)
15
$ 5
,341
$ 6
7,783
$ ( 50,217) $ -
$ 5
,341
$ 2
,077
$ ( 76,716)
IRR
-1.7%
16
$ 5
,475
$ 7
3,257
$ ( 44,743) $ -
$ 5
,475
$ 1
,999
$ ( 74,718)
ROI
-18%
17
$ 5
,611
$ 7
8,869
$ ( 39,131) $ -
$ 5
,611
$ 1
,924
$ ( 72,794)
18
$ 5
,752
$ 8
4,620
$ ( 33,380) $ -
$ 5
,752
$ 1
,851
$ ( 70,943)
25
19
$ 5
,896
$ 9
0,516
$ ( 27,484) $ -
$ 5
,896
$ 1
,782
$ ( 69,161)
20
$ 6
,043
$ 9
6,559
$ ( 21,441) $ -
$ 6
,043
$ 1
,715
$ ( 67,446)
Total
$ 9
6,559
$ 7
5,118
$ ( 67,446)
Inflation Rate
Glossary of Terms
Discount Rate
The discount rate is the rate at which cash
depreciates with time, hence the value of annual
savings decreases.
Capital Cost
Capital costs are fixed one time expenses,
typically the purchase of plant.
Present Value (PV)
PV is the present day value of the future returns
from the investment.
Internal Rate Of Return (IRR)
IRR is the discount rate that make the NPV = 0
at the end of the assessment period. i.e. The
Internal Rate of Return is the rate where if you
discount all of the future cash flows, the present
value of the flows is equal to the cost.
Net Present Value (NPV)
NPV is the sum of all previous PV's.
Beca // 3 June 2016
5138221 // NZ1-12429047-20 0.20 // page 26
MACC - EECA Programme 2B Energy Efficiency Review (Building Services)
Low Specific Fan Power
Years
Annual
Cummulative
Payback
Capital
Annual Cash
Present Value of
Net Present Value of
Savings
Savings
Investment
Flow
Saving
Savings
Client Input Values
0
$ -
$ -
$ ( 17,000) $ 1
7,000
$ ( 17,000) $ ( 17,000) $ ( 17,000)
Inflation Rate
2.5%
1
$ 2
2,511
$ 2
2,511
$ 5
,511
$ -
$ 2
2,511
$ 2
1,137
$ 4
,137
Discount Rate
6.5%
2
$ 2
3,074
$ 4
5,585
$ -
$ 2
3,074
$ 2
0,343
$ 2
4,480
3
$ 2
3,651
$ 6
9,235
$ -
$ 2
3,651
$ 1
9,579
$ 4
4,059
4
$ 2
4,242
$ 9
3,477
$ -
$ 2
4,242
$ 1
8,844
$ 6
2,903
Assessment Inputs
5
$ 2
4,848
$ 1
18,325
$ -
$ 2
4,848
$ 1
8,136
$ 8
1,039
Capital Cost
$ 1
7,000
6
$ 2
5,469
$ 1
43,794
$ -
$ 2
5,469
$ 1
7,455
$ 9
8,494
Secondary Capital Cost
$ -
7
$ 2
6,106
$ 1
69,900
$ -
$ 2
6,106
$ 1
6,799
$ 1
15,293
Time of Secondary Capital Cost (Years)
0
8
$ 2
6,759
$ 1
96,659
$ -
$ 2
6,759
$ 1
6,168
$ 1
31,462
Annual Savings
$ 2
2,511
9
$ 2
7,427
$ 2
24,086
$ -
$ 2
7,427
$ 1
5,561
$ 1
47,023
Assessment Length (Years)
20
10
$ 2
8,113
$ 2
52,199
$ -
$ 2
8,113
$ 1
4,977
$ 1
61,999
11
$ 2
8,816
$ 2
81,015
$ -
$ 2
8,816
$ 1
4,414
$ 1
76,413
12
$ 2
9,536
$ 3
10,552
$ -
$ 2
9,536
$ 1
3,873
$ 1
90,286
Assessment Results
13
$ 3
0,275
$ 3
40,826
$ -
$ 3
0,275
$ 1
3,352
$ 2
03,638
Payback Period (years)
1.0
14
$ 3
1,032
$ 3
71,858
$ -
$ 3
1,032
$ 1
2,850
$ 2
16,488
Total NPV
$ 2
84,065
15
$ 3
1,807
$ 4
03,666
$ -
$ 3
1,807
$ 1
2,368
$ 2
28,856
IRR
134.9%
16
$ 3
2,603
$ 4
36,268
$ -
$ 3
2,603
$ 1
1,903
$ 2
40,759
ROI
3283%
17
$ 3
3,418
$ 4
69,686
$ -
$ 3
3,418
$ 1
1,456
$ 2
52,215
18
$ 3
4,253
$ 5
03,939
$ -
$ 3
4,253
$ 1
1,026
$ 2
63,241
25
19
$ 3
5,109
$ 5
39,049
$ -
$ 3
5,109
$ 1
0,612
$ 2
73,852
20
$ 3
5,987
$ 5
75,036
$ -
$ 3
5,987
$ 1
0,213
$ 2
84,065
Total
$ 5
75,036
$ 2
84,065
Inflation Rate
Glossary of Terms
Discount Rate
The discount rate is the rate at which cash
depreciates with time, hence the value of annual
savings decreases.
Capital Cost
Capital costs are fixed one time expenses,
typically the purchase of plant.
Present Value (PV)
PV is the present day value of the future returns
from the investment.
Internal Rate Of Return (IRR)
IRR is the discount rate that make the NPV = 0
at the end of the assessment period. i.e. The
Internal Rate of Return is the rate where if you
discount all of the future cash flows, the present
value of the flows is equal to the cost.
Net Present Value (NPV)
NPV is the sum of all previous PV's.
Beca // 3 June 2016
5138221 // NZ1-12429047-20 0.20 // page 27
MACC - EECA Programme 2B Energy Efficiency Review (Building Services)
Variable Speed Cooling Tower Fans
Years
Annual
Cummulative
Payback
Capital
Annual Cash
Present Value of
Net Present Value of
Savings
Savings
Investment
Flow
Saving
Savings
Client Input Values
0
$ -
$ -
$ ( 10,000) $ 1
0,000
$ ( 10,000) $ ( 10,000) $ ( 10,000)
Inflation Rate
2.5%
1
$ 2
7,757
$ 2
7,757
$ 1
7,757
$ -
$ 2
7,757
$ 2
6,063
$ 1
6,063
Discount Rate
6.5%
2
$ 2
8,451
$ 5
6,208
$ -
$ 2
8,451
$ 2
5,084
$ 4
1,147
3
$ 2
9,162
$ 8
5,370
$ -
$ 2
9,162
$ 2
4,142
$ 6
5,289
4
$ 2
9,891
$ 1
15,261
$ -
$ 2
9,891
$ 2
3,235
$ 8
8,524
Assessment Inputs
5
$ 3
0,639
$ 1
45,900
$ -
$ 3
0,639
$ 2
2,362
$ 1
10,886
Capital Cost
$ 1
0,000
6
$ 3
1,404
$ 1
77,304
$ -
$ 3
1,404
$ 2
1,523
$ 1
32,409
Secondary Capital Cost
$ -
7
$ 3
2,190
$ 2
09,494
$ -
$ 3
2,190
$ 2
0,714
$ 1
53,123
Time of Secondary Capital Cost (Years)
0
8
$ 3
2,994
$ 2
42,488
$ -
$ 3
2,994
$ 1
9,936
$ 1
73,059
Annual Savings
$ 2
7,757
9
$ 3
3,819
$ 2
76,308
$ -
$ 3
3,819
$ 1
9,187
$ 1
92,247
Assessment Length (Years)
20
10
$ 3
4,665
$ 3
10,972
$ -
$ 3
4,665
$ 1
8,467
$ 2
10,714
11
$ 3
5,531
$ 3
46,504
$ -
$ 3
5,531
$ 1
7,773
$ 2
28,487
12
$ 3
6,420
$ 3
82,923
$ -
$ 3
6,420
$ 1
7,106
$ 2
45,593
Assessment Results
13
$ 3
7,330
$ 4
20,253
$ -
$ 3
7,330
$ 1
6,463
$ 2
62,056
Payback Period (years)
1.0
14
$ 3
8,263
$ 4
58,517
$ -
$ 3
8,263
$ 1
5,845
$ 2
77,901
Total NPV
$ 3
61,226
15
$ 3
9,220
$ 4
97,736
$ -
$ 3
9,220
$ 1
5,250
$ 2
93,150
IRR
280.1%
16
$ 4
0,200
$ 5
37,937
$ -
$ 4
0,200
$ 1
4,677
$ 3
07,827
ROI
6990%
17
$ 4
1,205
$ 5
79,142
$ -
$ 4
1,205
$ 1
4,126
$ 3
21,953
18
$ 4
2,236
$ 6
21,378
$ -
$ 4
2,236
$ 1
3,595
$ 3
35,548
25
19
$ 4
3,291
$ 6
64,669
$ -
$ 4
3,291
$ 1
3,085
$ 3
48,633
20
$ 4
4,374
$ 7
09,043
$ -
$ 4
4,374
$ 1
2,593
$ 3
61,226
Total
$ 7
09,043
$ 3
61,226
Inflation Rate
Glossary of Terms
Discount Rate
The discount rate is the rate at which cash
depreciates with time, hence the value of annual
savings decreases.
Capital Cost
Capital costs are fixed one time expenses,
typically the purchase of plant.
Present Value (PV)
PV is the present day value of the future returns
from the investment.
Internal Rate Of Return (IRR)
IRR is the discount rate that make the NPV = 0
at the end of the assessment period. i.e. The
Internal Rate of Return is the rate where if you
discount all of the future cash flows, the present
value of the flows is equal to the cost.
Net Present Value (NPV)
NPV is the sum of all previous PV's.
Beca // 3 June 2016
5138221 // NZ1-12429047-20 0.20 // page 28
MACC - EECA Programme 2B Energy Efficiency Review (Building Services)
Air Sourced Heat Pump
Years
Annual
Cummulative
Payback
Capital
Annual Cash
Present Value of
Net Present Value of
Savings
Savings
Investment
Flow
Saving
Savings
Client Input Values
0
$ -
$ -
$ ( 39,000) $ 3
9,000
$ ( 39,000) $ ( 39,000) $ ( 39,000)
Inflation Rate
2.5%
1
$ 5
,228
$ 5
,228
$ ( 33,772) $ -
$ 5
,228
$ 4
,909
$ ( 34,091)
Discount Rate
6.5%
2
$ 5
,359
$ 1
0,587
$ ( 28,413) $ -
$ 5
,359
$ 4
,725
$ ( 29,366)
3
$ 5
,493
$ 1
6,080
$ ( 22,920) $ -
$ 5
,493
$ 4
,547
$ ( 24,819)
4
$ 5
,630
$ 2
1,710
$ ( 17,290) $ -
$ 5
,630
$ 4
,376
$ ( 20,443)
Assessment Inputs
5
$ 5
,771
$ 2
7,481
$ ( 11,519) $ -
$ 5
,771
$ 4
,212
$ ( 16,231)
Capital Cost
$ 3
9,000
6
$ 5
,915
$ 3
3,396
$ ( 5,604) $ -
$ 5
,915
$ 4
,054
$ ( 12,177)
Secondary Capital Cost
$ -
7
$ 6
,063
$ 3
9,459
$ 459
$ -
$ 6
,063
$ 3
,902
$ ( 8,275)
Time of Secondary Capital Cost (Years)
0
8
$ 6
,215
$ 4
5,673
$ -
$ 6
,215
$ 3
,755
$ ( 4,520)
Annual Savings
$ 5
,228
9
$ 6
,370
$ 5
2,043
$ -
$ 6
,370
$ 3
,614
$ ( 906)
Assessment Length (Years)
20
10
$ 6
,529
$ 5
8,572
$ -
$ 6
,529
$ 3
,478
$ 2
,572
11
$ 6
,692
$ 6
5,265
$ -
$ 6
,692
$ 3
,348
$ 5
,920
12
$ 6
,860
$ 7
2,124
$ -
$ 6
,860
$ 3
,222
$ 9
,141
Assessment Results
13
$ 7
,031
$ 7
9,156
$ -
$ 7
,031
$ 3
,101
$ 1
2,242
Payback Period (years)
7.0
14
$ 7
,207
$ 8
6,363
$ -
$ 7
,207
$ 2
,984
$ 1
5,227
Total NPV
$ 3
0,921
15
$ 7
,387
$ 9
3,750
$ -
$ 7
,387
$ 2
,872
$ 1
8,099
IRR
14.4%
16
$ 7
,572
$ 1
01,322
$ -
$ 7
,572
$ 2
,764
$ 2
0,864
ROI
242%
17
$ 7
,761
$ 1
09,083
$ -
$ 7
,761
$ 2
,661
$ 2
3,524
18
$ 7
,955
$ 1
17,038
$ -
$ 7
,955
$ 2
,561
$ 2
6,085
25
19
$ 8
,154
$ 1
25,192
$ -
$ 8
,154
$ 2
,465
$ 2
8,549
20
$ 8
,358
$ 1
33,550
$ -
$ 8
,358
$ 2
,372
$ 3
0,921
Total
$ 1
33,550
$ 3
0,921
Inflation Rate
Glossary of Terms
Discount Rate
The discount rate is the rate at which cash
depreciates with time, hence the value of annual
savings decreases.
Capital Cost
Capital costs are fixed one time expenses,
typically the purchase of plant.
Present Value (PV)
PV is the present day value of the future returns
from the investment.
Internal Rate Of Return (IRR)
IRR is the discount rate that make the NPV = 0
at the end of the assessment period. i.e. The
Internal Rate of Return is the rate where if you
discount all of the future cash flows, the present
value of the flows is equal to the cost.
Net Present Value (NPV)
NPV is the sum of all previous PV's.
Beca // 3 June 2016
5138221 // NZ1-12429047-20 0.20 // page 29
MACC - EECA Programme 2B Energy Efficiency Review (Building Services)
Waste Water Heat Pump
Years
Annual
Cummulative
Payback
Capital
Annual Cash
Present Value of
Net Present Value of
Savings
Savings
Investment
Flow
Saving
Savings
Client Input Values
0
$ -
$ -
$ ( 264,000) $ 2
64,000
$ ( 264,000) $ ( 264,000) $ ( 264,000)
Inflation Rate
2.5%
1
$ 6
,763
$ 6
,763
$ ( 257,237) $ -
$ 6
,763
$ 6
,350
$ ( 257,650)
Discount Rate
6.5%
2
$ 6
,932
$ 1
3,695
$ ( 250,305) $ -
$ 6
,932
$ 6
,112
$ ( 251,538)
3
$ 7
,105
$ 2
0,800
$ ( 243,200) $ -
$ 7
,105
$ 5
,882
$ ( 245,656)
4
$ 7
,283
$ 2
8,083
$ ( 235,917) $ -
$ 7
,283
$ 5
,661
$ ( 239,995)
Assessment Inputs
5
$ 7
,465
$ 3
5,549
$ ( 228,451) $ -
$ 7
,465
$ 5
,449
$ ( 234,546)
Capital Cost
$ 2
64,000
6
$ 7
,652
$ 4
3,200
$ ( 220,800) $ -
$ 7
,652
$ 5
,244
$ ( 229,302)
Secondary Capital Cost
$ -
7
$ 7
,843
$ 5
1,043
$ ( 212,957) $ -
$ 7
,843
$ 5
,047
$ ( 224,255)
Time of Secondary Capital Cost (Years)
0
8
$ 8
,039
$ 5
9,082
$ ( 204,918) $ -
$ 8
,039
$ 4
,857
$ ( 219,398)
Annual Savings
$ 6
,763
9
$ 8
,240
$ 6
7,322
$ ( 196,678) $ -
$ 8
,240
$ 4
,675
$ ( 214,722)
Assessment Length (Years)
20
10
$ 8
,446
$ 7
5,768
$ ( 188,232) $ -
$ 8
,446
$ 4
,499
$ ( 210,223)
11
$ 8
,657
$ 8
4,426
$ ( 179,574) $ -
$ 8
,657
$ 4
,330
$ ( 205,893)
12
$ 8
,874
$ 9
3,299
$ ( 170,701) $ -
$ 8
,874
$ 4
,168
$ ( 201,725)
Assessment Results
13
$ 9
,095
$ 1
02,395
$ ( 161,605) $ -
$ 9
,095
$ 4
,011
$ ( 197,714)
Payback Period (years)
39.0
14
$ 9
,323
$ 1
11,718
$ ( 152,282) $ -
$ 9
,323
$ 3
,861
$ ( 193,853)
Total NPV
$ (
173,551)
15
$ 9
,556
$ 1
21,274
$ ( 142,726) $ -
$ 9
,556
$ 3
,716
$ ( 190,137)
IRR
-3.5%
16
$ 9
,795
$ 1
31,068
$ ( 132,932) $ -
$ 9
,795
$ 3
,576
$ ( 186,561)
ROI
-35%
17
$ 1
0,040
$ 1
41,108
$ ( 122,892) $ -
$ 1
0,040
$ 3
,442
$ ( 183,120)
18
$ 1
0,291
$ 1
51,399
$ ( 112,601) $ -
$ 1
0,291
$ 3
,312
$ ( 179,807)
25
19
$ 1
0,548
$ 1
61,947
$ ( 102,053) $ -
$ 1
0,548
$ 3
,188
$ ( 176,619)
20
$ 1
0,812
$ 1
72,759
$ ( 91,241) $ -
$ 1
0,812
$ 3
,068
$ ( 173,551)
Total
$ 1
72,759
$ 8
1,517
$ ( 173,551)
Inflation Rate
Glossary of Terms
Discount Rate
The discount rate is the rate at which cash
depreciates with time, hence the value of annual
savings decreases.
Capital Cost
Capital costs are fixed one time expenses,
typically the purchase of plant.
Present Value (PV)
PV is the present day value of the future returns
from the investment.
Internal Rate Of Return (IRR)
IRR is the discount rate that make the NPV = 0
at the end of the assessment period. i.e. The
Internal Rate of Return is the rate where if you
discount all of the future cash flows, the present
value of the flows is equal to the cost.
Net Present Value (NPV)
NPV is the sum of all previous PV's.
Beca // 3 June 2016
5138221 // NZ1-12429047-20 0.20 // page 30
MACC - EECA Programme 2B Energy Efficiency Review (Building Services)
Variable Volume Condending Water Loop
Years
Annual
Cummulative
Payback
Capital
Annual Cash
Present Value of
Net Present Value of
Savings
Savings
Investment
Flow
Saving
Savings
Client Input Values
0
$ -
$ -
$ ( 50,000) $ 5
0,000
$ ( 50,000) $ ( 50,000) $ ( 50,000)
Inflation Rate
2.5%
1
$ 3
5,059
$ 3
5,059
$ ( 14,941) $ -
$ 3
5,059
$ 3
2,919
$ ( 17,081)
Discount Rate
6.5%
2
$ 3
5,935
$ 7
0,994
$ 2
0,994
$ -
$ 3
5,935
$ 3
1,683
$ 1
4,602
3
$ 3
6,834
$ 1
07,828
$ -
$ 3
6,834
$ 3
0,493
$ 4
5,095
4
$ 3
7,755
$ 1
45,583
$ -
$ 3
7,755
$ 2
9,348
$ 7
4,443
Assessment Inputs
5
$ 3
8,699
$ 1
84,282
$ -
$ 3
8,699
$ 2
8,245
$ 1
02,688
Capital Cost
$ 5
0,000
6
$ 3
9,666
$ 2
23,948
$ -
$ 3
9,666
$ 2
7,184
$ 1
29,872
Secondary Capital Cost
$ -
7
$ 4
0,658
$ 2
64,605
$ -
$ 4
0,658
$ 2
6,163
$ 1
56,036
Time of Secondary Capital Cost (Years)
0
8
$ 4
1,674
$ 3
06,279
$ -
$ 4
1,674
$ 2
5,181
$ 1
81,217
Annual Savings
$ 3
5,059
9
$ 4
2,716
$ 3
48,995
$ -
$ 4
2,716
$ 2
4,235
$ 2
05,452
Assessment Length (Years)
20
10
$ 4
3,784
$ 3
92,779
$ -
$ 4
3,784
$ 2
3,325
$ 2
28,777
11
$ 4
4,878
$ 4
37,658
$ -
$ 4
4,878
$ 2
2,449
$ 2
51,225
12
$ 4
6,000
$ 4
83,658
$ -
$ 4
6,000
$ 2
1,606
$ 2
72,831
Assessment Results
13
$ 4
7,150
$ 5
30,809
$ -
$ 4
7,150
$ 2
0,794
$ 2
93,625
Payback Period (years)
2.0
14
$ 4
8,329
$ 5
79,138
$ -
$ 4
8,329
$ 2
0,013
$ 3
13,638
Total NPV
$ 4
18,884
15
$ 4
9,537
$ 6
28,675
$ -
$ 4
9,537
$ 1
9,261
$ 3
32,900
IRR
72.6%
16
$ 5
0,776
$ 6
79,451
$ -
$ 5
0,776
$ 1
8,538
$ 3
51,438
ROI
1691%
17
$ 5
2,045
$ 7
31,497
$ -
$ 5
2,045
$ 1
7,842
$ 3
69,280
18
$ 5
3,346
$ 7
84,843
$ -
$ 5
3,346
$ 1
7,172
$ 3
86,451
25
19
$ 5
4,680
$ 8
39,523
$ -
$ 5
4,680
$ 1
6,527
$ 4
02,978
20
$ 5
6,047
$ 8
95,570
$ -
$ 5
6,047
$ 1
5,906
$ 4
18,884
Total
$ 8
95,570
$ 4
18,884
Inflation Rate
Glossary of Terms
Discount Rate
The discount rate is the rate at which cash
depreciates with time, hence the value of annual
savings decreases.
Capital Cost
Capital costs are fixed one time expenses,
typically the purchase of plant.
Present Value (PV)
PV is the present day value of the future returns
from the investment.
Internal Rate Of Return (IRR)
IRR is the discount rate that make the NPV = 0
at the end of the assessment period. i.e. The
Internal Rate of Return is the rate where if you
discount all of the future cash flows, the present
value of the flows is equal to the cost.
Net Present Value (NPV)
NPV is the sum of all previous PV's.
Beca // 3 June 2016
5138221 // NZ1-12429047-20 0.20 // page 31
MACC - EECA Programme 2B Energy Efficiency Review (Building Services)
Energy Piles (Ground Source Heat Rejection Through Piles)
Years
Annual
Cummulative
Payback
Capital
Annual Cash
Present Value of
Net Present Value of
Savings
Savings
Investment
Flow
Saving
Savings
Client Input Values
0
$ -
$ -
$ ( 303,000) $ 3
03,000
$ ( 303,000) $ ( 303,000) $ ( 303,000)
Inflation Rate
2.5%
1
$ 4
7,921
$ 4
7,921
$ ( 255,079) $ -
$ 4
7,921
$ 4
4,996
$ ( 258,004)
Discount Rate
6.5%
2
$ 4
9,119
$ 9
7,040
$ ( 205,960) $ -
$ 4
9,119
$ 4
3,306
$ ( 214,698)
3
$ 5
0,347
$ 1
47,387
$ ( 155,613) $ -
$ 5
0,347
$ 4
1,680
$ ( 173,018)
4
$ 5
1,606
$ 1
98,993
$ ( 104,007) $ -
$ 5
1,606
$ 4
0,114
$ ( 132,904)
Assessment Inputs
5
$ 5
2,896
$ 2
51,889
$ ( 51,111) $ -
$ 5
2,896
$ 3
8,608
$ ( 94,296)
Capital Cost
$ 3
03,000
6
$ 5
4,218
$ 3
06,107
$ 3
,107
$ -
$ 5
4,218
$ 3
7,158
$ ( 57,138)
Secondary Capital Cost
$ -
7
$ 5
5,574
$ 3
61,680
$ -
$ 5
5,574
$ 3
5,762
$ ( 21,376)
Time of Secondary Capital Cost (Years)
0
8
$ 5
6,963
$ 4
18,643
$ -
$ 5
6,963
$ 3
4,419
$ 1
3,043
Annual Savings
$ 4
7,921
9
$ 5
8,387
$ 4
77,030
$ -
$ 5
8,387
$ 3
3,126
$ 4
6,169
Assessment Length (Years)
20
10
$ 5
9,847
$ 5
36,877
$ -
$ 5
9,847
$ 3
1,882
$ 7
8,051
11
$ 6
1,343
$ 5
98,220
$ -
$ 6
1,343
$ 3
0,684
$ 1
08,735
12
$ 6
2,877
$ 6
61,097
$ -
$ 6
2,877
$ 2
9,532
$ 1
38,267
Assessment Results
13
$ 6
4,448
$ 7
25,545
$ -
$ 6
4,448
$ 2
8,423
$ 1
66,690
Payback Period (years)
6.0
14
$ 6
6,060
$ 7
91,605
$ -
$ 6
6,060
$ 2
7,355
$ 1
94,045
Total NPV
$ 3
37,902
15
$ 6
7,711
$ 8
59,316
$ -
$ 6
7,711
$ 2
6,328
$ 2
20,373
IRR
17.2%
16
$ 6
9,404
$ 9
28,720
$ -
$ 6
9,404
$ 2
5,339
$ 2
45,712
ROI
304%
17
$ 7
1,139
$ 9
99,859
$ -
$ 7
1,139
$ 2
4,387
$ 2
70,099
18
$ 7
2,917
$ 1
,072,776
$ -
$ 7
2,917
$ 2
3,471
$ 2
93,571
25
19
$ 7
4,740
$ 1
,147,517
$ -
$ 7
4,740
$ 2
2,590
$ 3
16,161
20
$ 7
6,609
$ 1
,224,126
$ -
$ 7
6,609
$ 2
1,741
$ 3
37,902
Total
$ 1
,224,126
$ 3
37,902
Inflation Rate
Glossary of Terms
Discount Rate
The discount rate is the rate at which cash
depreciates with time, hence the value of annual
savings decreases.
Capital Cost
Capital costs are fixed one time expenses,
typically the purchase of plant.
Present Value (PV)
PV is the present day value of the future returns
from the investment.
Internal Rate Of Return (IRR)
IRR is the discount rate that make the NPV = 0
at the end of the assessment period. i.e. The
Internal Rate of Return is the rate where if you
discount all of the future cash flows, the present
value of the flows is equal to the cost.
Net Present Value (NPV)
NPV is the sum of all previous PV's.
Beca // 3 June 2016
5138221 // NZ1-12429047-20 0.20 // page 32
MACC - EECA Programme 2B Energy Efficiency Review (Building Services)
Combined Enhanced Efficient Design Opportunities
Years
Annual
Cummulative
Payback
Capital
Annual Cash
Present Value of
Net Present Value of
Savings
Savings
Investment
Flow
Saving
Savings
Client Input Values
0
$ -
$ -
$ ( 419,000) $ 4
19,000
$ ( 419,000) $ ( 419,000) $ ( 419,000)
Inflation Rate
2.5%
1
$ 6
8,314
$ 6
8,314
$ ( 350,686) $ -
$ 6
8,314
$ 6
4,145
$ ( 354,855)
Discount Rate
6.5%
2
$ 7
0,022
$ 1
38,336
$ ( 280,664) $ -
$ 7
0,022
$ 6
1,735
$ ( 293,120)
3
$ 7
1,772
$ 2
10,108
$ ( 208,892) $ -
$ 7
1,772
$ 5
9,417
$ ( 233,703)
4
$ 7
3,567
$ 2
83,675
$ ( 135,325) $ -
$ 7
3,567
$ 5
7,185
$ ( 176,518)
Assessment Inputs
5
$ 7
5,406
$ 3
59,081
$ ( 59,919) $ -
$ 7
5,406
$ 5
5,037
$ ( 121,481)
Capital Cost
$ 4
19,000
6
$ 7
7,291
$ 4
36,372
$ 1
7,372
$ -
$ 7
7,291
$ 5
2,970
$ ( 68,511)
Secondary Capital Cost
$ -
7
$ 7
9,223
$ 5
15,595
$ -
$ 7
9,223
$ 5
0,981
$ ( 17,530)
Time of Secondary Capital Cost (Years)
0
8
$ 8
1,204
$ 5
96,799
$ -
$ 8
1,204
$ 4
9,066
$ 3
1,536
Annual Savings
$ 6
8,314
9
$ 8
3,234
$ 6
80,033
$ -
$ 8
3,234
$ 4
7,223
$ 7
8,759
Assessment Length (Years)
20
10
$ 8
5,315
$ 7
65,348
$ -
$ 8
5,315
$ 4
5,449
$ 1
24,208
11
$ 8
7,448
$ 8
52,796
$ -
$ 8
7,448
$ 4
3,742
$ 1
67,951
12
$ 8
9,634
$ 9
42,429
$ -
$ 8
9,634
$ 4
2,100
$ 2
10,050
Assessment Results
13
$ 9
1,875
$ 1
,034,304
$ -
$ 9
1,875
$ 4
0,518
$ 2
50,569
Payback Period (years)
6.0
14
$ 9
4,172
$ 1
,128,476
$ -
$ 9
4,172
$ 3
8,996
$ 2
89,565
Total NPV
$ 4
94,641
15
$ 9
6,526
$ 1
,225,002
$ -
$ 9
6,526
$ 3
7,532
$ 3
27,097
IRR
17.8%
16
$ 9
8,939
$ 1
,323,941
$ -
$ 9
8,939
$ 3
6,122
$ 3
63,219
ROI
316%
17
$ 1
01,413
$ 1
,425,353
$ -
$ 1
01,413
$ 3
4,765
$ 3
97,985
18
$ 1
03,948
$ 1
,529,301
$ -
$ 1
03,948
$ 3
3,460
$ 4
31,444
25
19
$ 1
06,547
$ 1
,635,848
$ -
$ 1
06,547
$ 3
2,203
$ 4
63,647
20
$ 1
09,210
$ 1
,745,058
$ -
$ 1
09,210
$ 3
0,994
$ 4
94,641
Total
$ 1
,745,058
$ 4
94,641
Inflation Rate
Glossary of Terms
Discount Rate
The discount rate is the rate at which cash
depreciates with time, hence the value of annual
savings decreases.
Capital Cost
Capital costs are fixed one time expenses,
typically the purchase of plant.
Present Value (PV)
PV is the present day value of the future returns
from the investment.
Internal Rate Of Return (IRR)
IRR is the discount rate that make the NPV = 0
at the end of the assessment period. i.e. The
Internal Rate of Return is the rate where if you
discount all of the future cash flows, the present
value of the flows is equal to the cost.
Net Present Value (NPV)
NPV is the sum of all previous PV's.
Beca // 3 June 2016
5138221 // NZ1-12429047-20 0.20 // page 33
MACC - EECA Programme 2B Energy Efficiency Review (Building Services)
Roof Mounted Photovoltaics
Years
Annual
Cummulative
Payback
Capital
Annual Cash
Present Value of
Net Present Value of
Savings
Savings
Investment
Flow
Saving
Savings
Client Input Values
0
$ -
$ -
$ ( 344,000) $ 3
44,000
$ ( 344,000) $ ( 344,000) $ ( 344,000)
Inflation Rate
2.5%
1
$ 2
4,987
$ 2
4,987
$ ( 319,013) $ -
$ 2
4,987
$ 2
3,462
$ ( 320,538)
Discount Rate
6.5%
2
$ 2
5,612
$ 5
0,599
$ ( 293,401) $ -
$ 2
5,612
$ 2
2,581
$ ( 297,957)
3
$ 2
6,252
$ 7
6,851
$ ( 267,149) $ -
$ 2
6,252
$ 2
1,733
$ ( 276,225)
4
$ 2
6,908
$ 1
03,759
$ ( 240,241) $ -
$ 2
6,908
$ 2
0,916
$ ( 255,308)
Assessment Inputs
5
$ 2
7,581
$ 1
31,340
$ ( 212,660) $ -
$ 2
7,581
$ 2
0,131
$ ( 235,177)
Capital Cost
$ 3
44,000
6
$ 2
8,270
$ 1
59,610
$ ( 184,390) $ -
$ 2
8,270
$ 1
9,375
$ ( 215,803)
Secondary Capital Cost
$ -
7
$ 2
8,977
$ 1
88,588
$ ( 155,412) $ -
$ 2
8,977
$ 1
8,647
$ ( 197,156)
Time of Secondary Capital Cost (Years)
0
8
$ 2
9,702
$ 2
18,289
$ ( 125,711) $ -
$ 2
9,702
$ 1
7,947
$ ( 179,209)
Annual Savings
$ 2
4,987
9
$ 3
0,444
$ 2
48,734
$ ( 95,266) $ -
$ 3
0,444
$ 1
7,273
$ ( 161,936)
Assessment Length (Years)
20
10
$ 3
1,205
$ 2
79,939
$ ( 64,061) $ -
$ 3
1,205
$ 1
6,624
$ ( 145,312)
11
$ 3
1,985
$ 3
11,924
$ ( 32,076) $ -
$ 3
1,985
$ 1
6,000
$ ( 129,313)
12
$ 3
2,785
$ 3
44,709
$ 709
$ -
$ 3
2,785
$ 1
5,399
$ ( 113,914)
Assessment Results
13
$ 3
3,605
$ 3
78,314
$ -
$ 3
3,605
$ 1
4,820
$ ( 99,094)
Payback Period (years)
12.0
14
$ 3
4,445
$ 4
12,759
$ -
$ 3
4,445
$ 1
4,264
$ ( 84,830)
Total NPV
$ (
9,820)
15
$ 3
5,306
$ 4
48,065
$ -
$ 3
5,306
$ 1
3,728
$ ( 71,102)
IRR
6.2%
16
$ 3
6,189
$ 4
84,254
$ -
$ 3
6,189
$ 1
3,212
$ ( 57,890)
ROI
86%
17
$ 3
7,093
$ 5
21,347
$ -
$ 3
7,093
$ 1
2,716
$ ( 45,174)
18
$ 3
8,021
$ 5
59,368
$ -
$ 3
8,021
$ 1
2,238
$ ( 32,936)
25
19
$ 3
8,971
$ 5
98,339
$ -
$ 3
8,971
$ 1
1,779
$ ( 21,157)
20
$ 3
9,945
$ 6
38,284
$ -
$ 3
9,945
$ 1
1,336
$ ( 9,820)
Total
$ 6
38,284
$ ( 9,820)
Inflation Rate
Glossary of Terms
Discount Rate
The discount rate is the rate at which cash
depreciates with time, hence the value of annual
savings decreases.
Capital Cost
Capital costs are fixed one time expenses,
typically the purchase of plant.
Present Value (PV)
PV is the present day value of the future returns
from the investment.
Internal Rate Of Return (IRR)
IRR is the discount rate that make the NPV = 0
at the end of the assessment period. i.e. The
Internal Rate of Return is the rate where if you
discount all of the future cash flows, the present
value of the flows is equal to the cost.
Net Present Value (NPV)
NPV is the sum of all previous PV's.
Beca // 3 June 2016
5138221 // NZ1-12429047-20 0.20 // page 34