

Report
MACC - EECA Programme 2A Energy Efficiency Review
(Building Envelope)
Prepared for Wellington City Council
By Beca Ltd
3 June 2016
/


MACC - EECA Programme 2A Energy Efficiency Review (Building Envelope)
Revision History
Revision Nº
Prepared By
Description
Date
1
Shaan Cory
Issued for information
7 June 2016
2
3
4
5
Document Acceptance
Action
Name
Signed
Date
Prepared by
Shaan Cory
30 May 2016
Reviewed by
Ben Masters
3 June 2016
Approved by
Ben Masters
7 June 2016
on behalf of
Beca Ltd
© Beca 2016 (unless Beca has expressly agreed otherwise with the Client in writing).
This report has been prepared by Beca on the specific instructions of our Client. It is solely for our Client’s use for the purpose for which
it is intended in accordance with the agreed scope of work. Any use or reliance by any person contrary to the above, to which Beca has
not given its prior written consent, is at that person's own risk.
Beca // 3 June 2016
5138221 // NZ1-12560810-12 0.12 // i

MACC - EECA Programme 2A Energy Efficiency Review (Building Envelope)
Executive Summary
The following is a summary overview of the selected energy efficiency opportunities assessed as part of the EECA Programme 2A energy efficiency advisory service for the proposed Museum and Convention Centre (MACC)
project to assess building envelope opportunities. The energy efficiency review has used computer simulation modelling to benchmark annual energy use savings against a theoretical baseline building model.
Comparison of Building Envelope Energy Efficiency Opportunities
Attribute
Annual
The findings and recommendations are:
Energy Use
Combining the energy efficiency opportunities which offer an energy reduction
Benchmark
(enhanced glazing, roof, and wall insulation) indicates around 12kWh/m2 per year
Comparison
energy savings compared to the NZBC baseline model. The energy savings of the
combined energy efficiency options may reduce GHG emissions by more than 40
tonnes per year.
The combination of implementing the enhanced glazing, wall and roof opportunities
is indicated to provide approximately $11k of energy cost savings per year, which
has an estimated payback period of 11 years, a NPV of $10k, and an IRR of 7.3%
(20 year period). This indicates the assessed options would result in a favourable
return on investment.
Along with offering energy savings, the assessed enhanced glazing (IGU Low-e
Solar Control) option is also recommended for improved occupancy thermal comfort
due to improved summer and winter radiant surface temperatures in the occupied
spaces. Likewise, the increased insulation level will result in improved winter thermal
comfort.
External solar shading and glazing performance criteria may also result in a reduced
peak cooling load and resulting chiller plant capacity and required AHU sizes.
Likewise increased thermal insulation will reduce the required boiler plant capacity.
These potential capital cost savings have not been factored into the assessment
It is indicated that installing additional solar shading increases energy consumption
and GHG emissions, but would also improve summer comfort in the Level 4 FOH
area.
We recommend that WCC considers including the above combined opportunities
subject to meeting their investment criteria and the project budget.
Annual
Savings
Enhanced Energy Efficiency Opportunities
Benchmark
Annual Energy and Emissions Savings
Combined Building Envelope
Summary
Benchmark
External solar shading
Enhanced Glazing
Enhanced Roof Insulation
Enhanced Wall Insulation
Opportunities
kWh/m2 per year
-0.5
4
6
6
12
kWh per year
-7,000
58,000
96,000
96,000
196,000
$ per year
$60
$4,000
$6,000
$6,000
$11,000
Tonnes CO2-e/ year
-2
12
21
21
43
Performance
Financial
Enhanced Energy Efficiency Opportunities
Analysis
Financial Performance Indicator
Enhanced Glazing
Combined Building Envelope
Summary
External Solar Shading
Enhanced Roof Insulation
Enhanced Wall Insulation
(IGU Low-e Solar Control)
Opportunities
Indicative Capital Cost1
$50K
$80K
$25K
$30K
$135K
Payback Period2
NA years
17 years
5 years
6 years
11 years
20 year NPV3
-$49,000
-$25,000
$49,000
$44,000
$10,000
20 year IRR
NA
2.4%
24.0%
20.1%
7.3%
1
Based on indicative increased capital cost over baseline option. Order of capital costs TBC by Cost Consultant. Excluding GST, contractor P+G and margins, contingency allowance, and professional fees. These estimates are for comparison purposes
only, and not to establish construction budget or estimate operating expenses. 2
Based on WCC electricity rate of 10ȼ/kWh and gas rate of 5ȼ/kWh with a 2.5% annual inflation rate assumed
3
Assumes a 6.5% discount rate
Beca // 3 June 2016
5138221 // NZ1-12560810-12 0.12 // ii
MACC - EECA Programme 2A Energy Efficiency Review (Building Envelope)
Contents
1 Introduction
2
2 Project Description
2
2.1
Museum and Convention Centre
2
3 Energy Efficiency Overview
3
3.1
Efficiency Optimises Lifetime Costs
3
3.2
Energy Efficiency Adds Value
3
4 Computer Simulation Models
3
4.1
Weather File
3
4.2
Baseline Model
3
5 Energy Efficiency Opportunities
5
6 Findings
6
7 Financial Performance Analysis
7
8 Comments & Recommendations
8
9 Next Steps
8
Appendices
Appendix A – Computer Simulation Model Inputs
Appendix B – Financial Performance Analysis
Beca // 3 June 2016
5138221 // NZ1-12560810-12 0.12 // i
MACC - EECA Programme 2A Energy Efficiency Review (Building Envelope)
1
Introduction
2
Project Description
This energy efficiency advisory service has been requested by Wellington City Council (WCC) to review selected
2.1
Museum and Convention Centre
energy efficiency opportunities available to the proposed Museum and Convention Centre (MACC). The scope of
services provided aligns with the objectives of the Energy Efficiency & Conservation Authority (EECA)
WCC is planning to construct a new MACC with an approximate useable floor area of 15,751m2. MACC is a 5
Programme 2A Advisory service requirements.
storey building. The lower four floors consist of two 10m high floor to ceiling mezzanine split levels that house the
museum exhibits. The top floor houses the convention centre. MACC is comprised of:
As summarised by EECA:
11 large exhibition pieces
The objective of Programme 2A is to recommend energy efficient design features [building envelope]
when the
1,100 person convention centre,
building design is at the initial concept stage and to "lock in" energy efficiency before a significant amount of time
Kitchen,
and money has been spent on detailed drawings and designs.
Offices, and
Lobby area.
The EECA Programme 2B report has been carried out in parallel with this report and is focussed on energy
efficient systems.
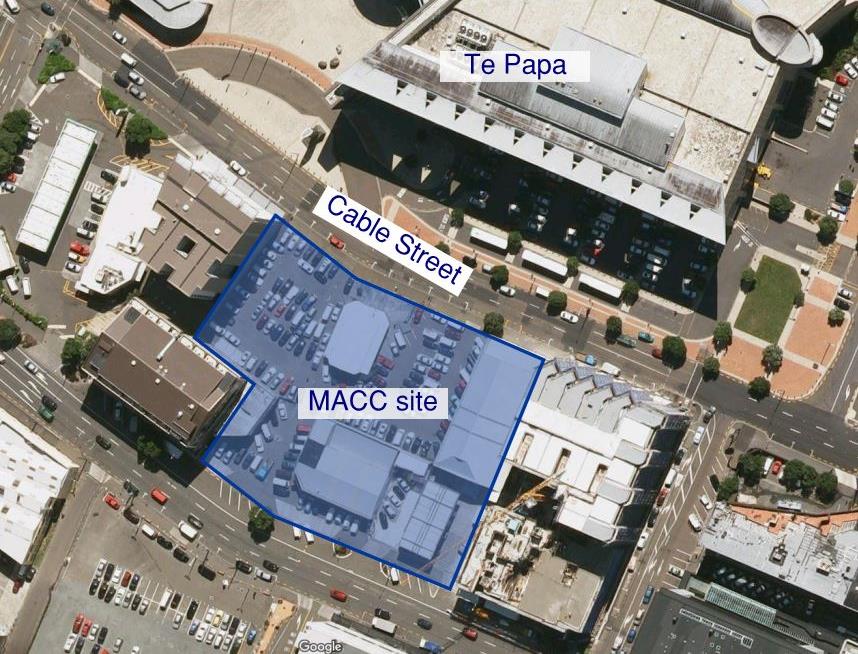
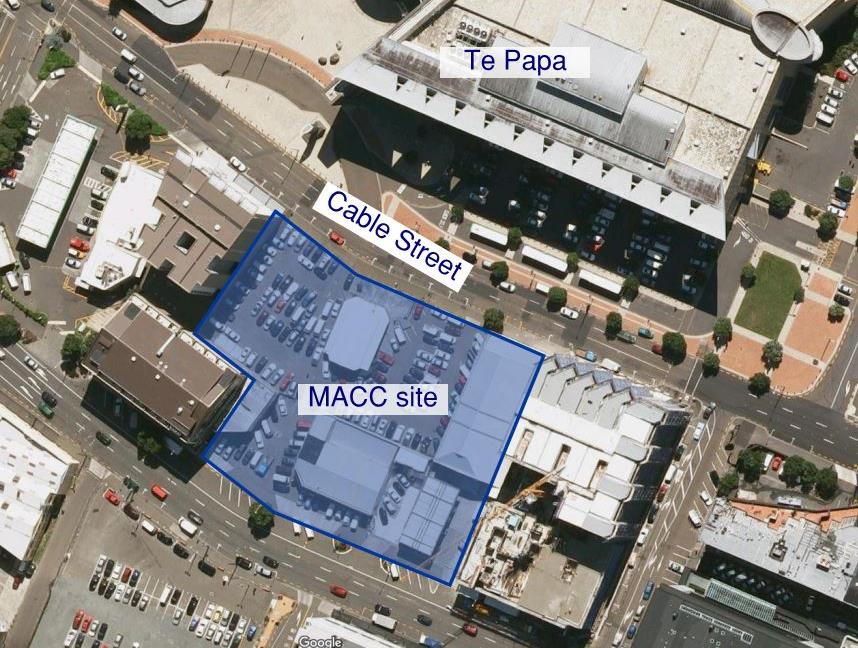
Figure 1 shows that MACC is located across the street from Te Papa and situated between three existing
buildings.
The energy efficiency review uses computer simulation modelling to benchmark the energy performance benefit
of selected building envelope energy efficiency opportunities against a theoretical baseline model and the
Project summary details are as follows:
proposed design.
Location: Cable Street, Wellington
Each opportunity has been considered purely from an energy, Greenhouse Gas (GHG) emissions and energy
Client: Wellington City Council
cost perspective only. Other criteria including internal environmental quality (e.g. occupancy thermal comfort, air
Design Stage: Preliminary Design
quality, daylight availability, access to external views etc), architectural, construction, cost, emissions, cleaning,
safety in design and all other aspects which inform to the performance and aesthetic requirements of the building
design should be considered separately by the project team.
N
Limitations
This study has been prepared for the purposes of helping to inform the development of the building design. The
computer simulation models are only intended to help inform the building design and the predicted values may
Cable Street
overestimate or underestimate the actual building performance in use. Note that the energy benchmark
calculations use standard benchmarking criteria for occupancy, lighting, power and plant usage and benchmark
weather data. Actual operating variables will differ in reality (e.g. weather, fitout and usage patterns, blinds
control etc.). We point out that the weather files used for the computer simulations represent a typical weather
year only and does not account for periods of unseasonably high (or low) temperature or humidity.
The energy benchmarks are not an estimate of predicted energy use and as such cannot be guaranteed that the
actual building energy use will be within the target limits as this will be determined by many variables, including
those listed above.
All costs are high level estimates only based on suppliers quotes and may not reflect the actual costs. These will
need to be confirmed by further design and the project quantity surveyor.
Figure 1 – Proposed site location on the existing Cable Street site
Beca // 3 June 2016
5138221 // NZ1-12560810-12 0.12 // page 2
MACC - EECA Programme 2A Energy Efficiency Review (Building Envelope)
3
Energy Efficiency Overview
4
Computer Simulation Models
Commercial and industrial buildings account for around 8% of New Zealand’s total energy consumption a year,
A 3D computer simulation model was created for the building using IES Virtual Environment software. IES
and 5% of total CO2 emissions.
simulation software is of the dynamic thermal simulation type that is capable of predicting building thermal
performance and estimating annual energy consumption in a building.
Studies have shown there can be as much as a ten-fold difference in actual energy consumption between similar
buildings with design and construction-related issues and operational issues the main contributors to the
The program is based upon finite difference methods as recommended by CIBSE Part A for energy and
differences.
environmental modelling to model the transmission and storage of heat in the building fabric.
3.1
Efficiency Optimises Lifetime Costs
The thermal model was created using IES Virtual Environment Version 2015. This has been independently
verified to meet ANSI/ASHRAE Standard 140-2004 (Building Thermal Envelope and Fabric Test Loads)
Designing energy-efficient buildings makes sense on a number of levels – not the least of which is the overall
performance criteria. The
Apache HVAC module has been used to simulate Heating, Ventilation, and Air-
economics.
Conditioning (HVAC) energy.
Typical costs relative to initial construction costs over the life of a typical building are:
Environmental consultant fees
0.01 to 0.03
4.1
Weather File
Professional fees
0.10 to 0.15
Each model has been simulated using the NIWA Wellington TMY2 weather file (Data Source - TMY2 NIWA
Construction costs
1.00
18234 D14482 WMO Station 934360). This represents a historical average year of Wellington weather data as
Energy, operating and maintenance costs 3.00
recorded at the Kelburn weather station. It must be noted that the weather data does not account for any
Business costs (salaries, rental/space)
200.00
unseasonable weather conditions and does not account for any localised micro climate effects at the site
Even taken together the design fees and costs of construction are a small portion of total lifetime costs of a
location.
building. Focusing on these initial construction costs alone will almost certainly result in a project that does not
optimise its lifetime costs.
4.2
Baseline Model
A theoretical baseline model for the MACC building has been created which generally aligns with the New
The extra initial cost of letting the architects and engineers evaluate the design thoroughly and determine an
Zealand Building Code (NZBC) Clause H1 minimum energy efficiency requirements. The proposed building
energy-efficient outcome is an investment that should repay itself many times over the life of the building.
geometry has been modelled, with proposed areas and location of clear single glazing included on each façade.
External wall, roof and suspended floor areas are all insulated to align with the Clause H1 R-value minimum. The
Business costs are by far the most significant lifetime cost of a project, and to influence them, the potential effect
baseline model includes the external solar shading which wraps around the building.
of a building on the productivity and health of its users must be taken into account.
The baseline model has full air conditioning to all occupied areas with a combination of centralised Variable Air
Energy-efficient design can also play a significant role in providing healthier, more productive environments. For
Volume (VAV) Air Handling Units (AHU) with zone reheat and a 4 pipe fan coil unit system providing heating and
example:
cooling via a water cooled chiller plant and gas boiler plant (condensing type). Mechanical ventilation is provided
as per the current design provision. Internal lighting is assumed to be predominantly provided by LED lighting
Increased levels of thermal insulation results in improved winter thermal comfort
technology. HVAC plant and equipment efficiencies align with the Department of Building and Housing’s
External shading to control summer cooling loads also reduces direct solar gain which may cause discomfort
for building occupants. Well-designed shading also means users do not need to use their blinds as much,
Guidelines for Energy Efficient HVAC plant (MEPS).
allowing more access to daylight and exterior views.
The operating and occupancy profile used in the model has been set to align with the forecast average 10 year
Energy-efficient high frequency lighting may reduce headache producing flicker
projection for movie museum usage from “Wellington City Council - Indicative business case for a new movie
3.2
Energy Efficiency Adds Value
museum” document from November 2015 and projected year 5 convention centre usage from “Wellington City
Council - Indicative business case for a new convention centre” document from December 2015.
All stakeholders in the building stand to gain from more energy-efficient design.
Further details of the baseline computer model inputs are described in Appendix A.
Owners/occupiers and building users enjoy lower operating costs, and potentially greater operational flexibility
and an environment that encourages greater productivity. The benefits also contribute to the long-term value of
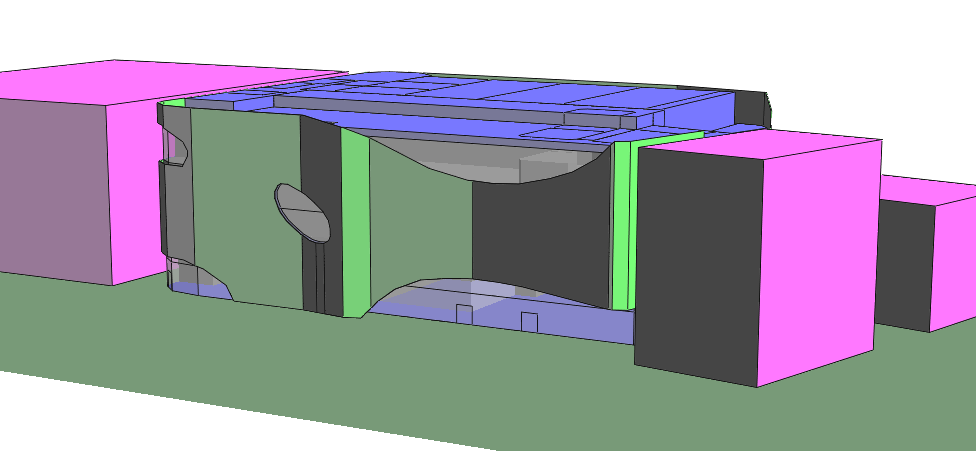
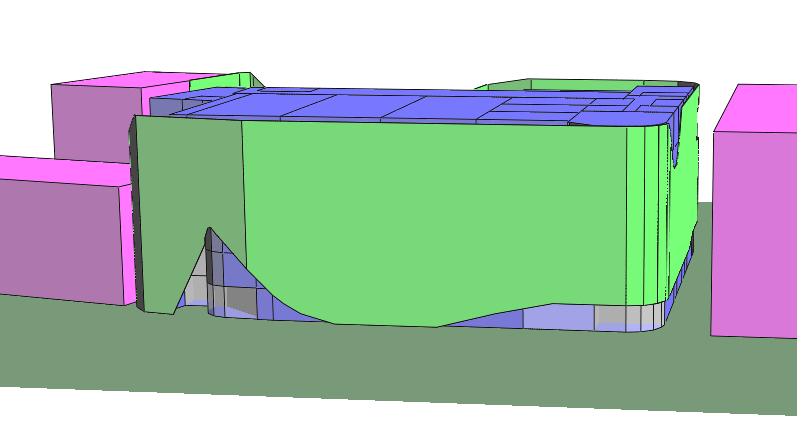
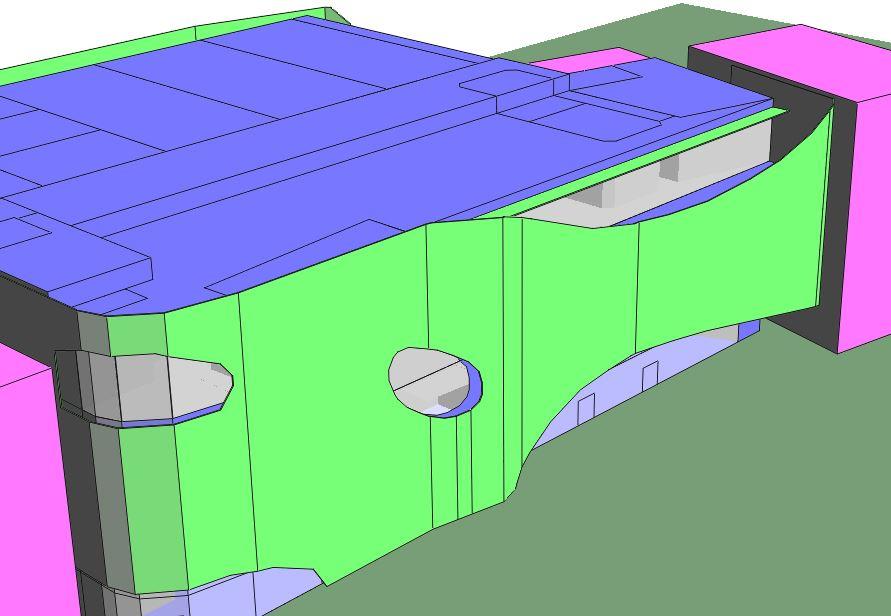
Sample images of the 3D computer model can be seen in the following figures:
the asset for owners and portfolio holders.
The benefits of energy efficiency will become more obvious and more valuable as energy costs rise, employees’
pressure for healthier environments increases, regulation becomes a more distinct possibility and overall
environmental awareness improves.
Beca // 3 June 2016
5138221 // NZ1-12560810-12 0.12 // page 3
MACC - EECA Programme 2A Energy Efficiency Review (Building Envelope)
Benchmark Energy End Use Breakdown
Adjacent Buildings
The benchmark annual energy end-use breakdown for the theoretical baseline model can be seen in the
following figure:
Solar Shading
Figure 2 - Computer simulation model showing proposed façade design, view from north.
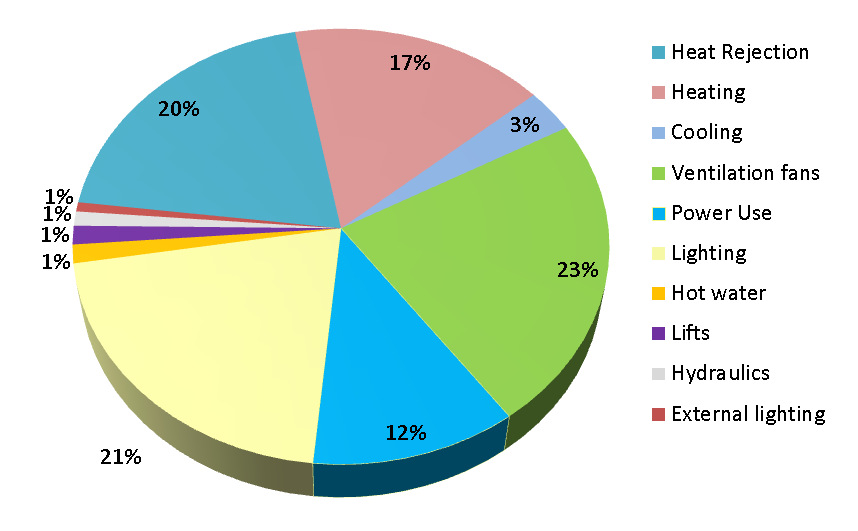
Figure 4 - Baseline Model, Benchmark Energy End Use Breakdown
It can be seen that heating, cooling, ventilation fans, and heat rejection energy makes up 63% of the annual
energy use for the baseline model. Ventilation fans energy is the highest HVAC end use at 23% and is
comprised of AHUs, supply air fans, fan coil units, and miscellaneous extract fans (e.g. toilets, kitchen exhaust,
back of house etc). Heat rejection energy is the second largest energy user at 20% of overall energy and is
comprised of the cooling tower fans and the condensing circuit’s pumps. In the baseline model, the heat rejection
operates at a constant speed, regardless of the cooling load. Heating energy is 17% and is comprised of outdoor
air heating and space heating. Cooling energy accounts for only 3% due to the efficiency of the base case water
cooled chiller.
The lighting and power (for computers, kitchen equipment and other equipment) makes up a further 33% of the
annual energy usage. The baseline model assumes LED lighting and typical use of lighting and power with a low
level of energy management being employed by building users. The energy use attributed to computers and
other appliances can be a large variable and should be benchmarked as the design and Furniture, Fixtures and
Equipment (FFE) stage progresses. The simulations have assumed equipment efficiency is not overly energy
efficient at this stage but we recommend that an energy efficient equipment specification is targeted.
Figure 3 - Computer simulation model showing proposed façade design, view from south
The remaining 4% of energy usage is for hydraulics, lifts, and external lighting.
Beca // 3 June 2016
5138221 // NZ1-12560810-12 0.12 // page 4
MACC - EECA Programme 2A Energy Efficiency Review (Building Envelope)
5
Energy Efficiency Opportunities
The following Programme 2A energy efficiency opportunities were identified by Beca. The theoretical baseline
Additional Solar Shading
model has been modified to represent each of the following energy efficiency opportunities (Refer to Appendix A
for further details of computer model inputs):
External Solar Shading: The addition of a theoretical solar shading element to level 4 north façade (refer to
Figure 5). The shading has been modelled as a 2m overhang at roof level, but may also represent two 1m
fins (one fin at roof level and the other at the midway point of the level 4 façade height). Shading of this
configuration will shade from midday summer sun while allowing passive solar gain in winter.
Enhanced Roof Insulation: The roofing option has an increased level of insulation and was modelled as
follows:
– Total R-value: R 3.0 m2.K/W (including thermal bridging effects)
Enhanced Wall Insulation: The wall option has an increased level of external wall insulation and was
modelled as follows:
– Total R-value: 2.0 m2.K/W (including thermal bridging effects)
Enhanced Glazing: Solar control Low-e Insulated Glazed Units (IGU) have a lower Shading Coefficient and
G-value to reduce the amount of solar heat gain transmitted through the glazing and a higher thermal
resistance to prevent heat loss through the glazed areas. The glazing was modelled as follows:
– Uwindow: 3.0 W/m2.K (including frame effect)
– Shading Coefficient: 0.4
–
G value: 0.34
Combined Opportunities: The following selected opportunities were simulated together:
Figure 5 – Theoretical solar shading
– Enhanced Roof Insulation
– Enhanced Wall Insulation
– Enhanced Glazing.
Beca // 3 June 2016
5138221 // NZ1-12560810-12 0.12 // page 5
MACC - EECA Programme 2A Energy Efficiency Review (Building Envelope)
6
Findings
Each computer model has been simulated over a typical Wellington weather year and the annual energy benefit of each energy efficiency opportunity is separately compared to the theoretical baseline model. The findings are as
follows:
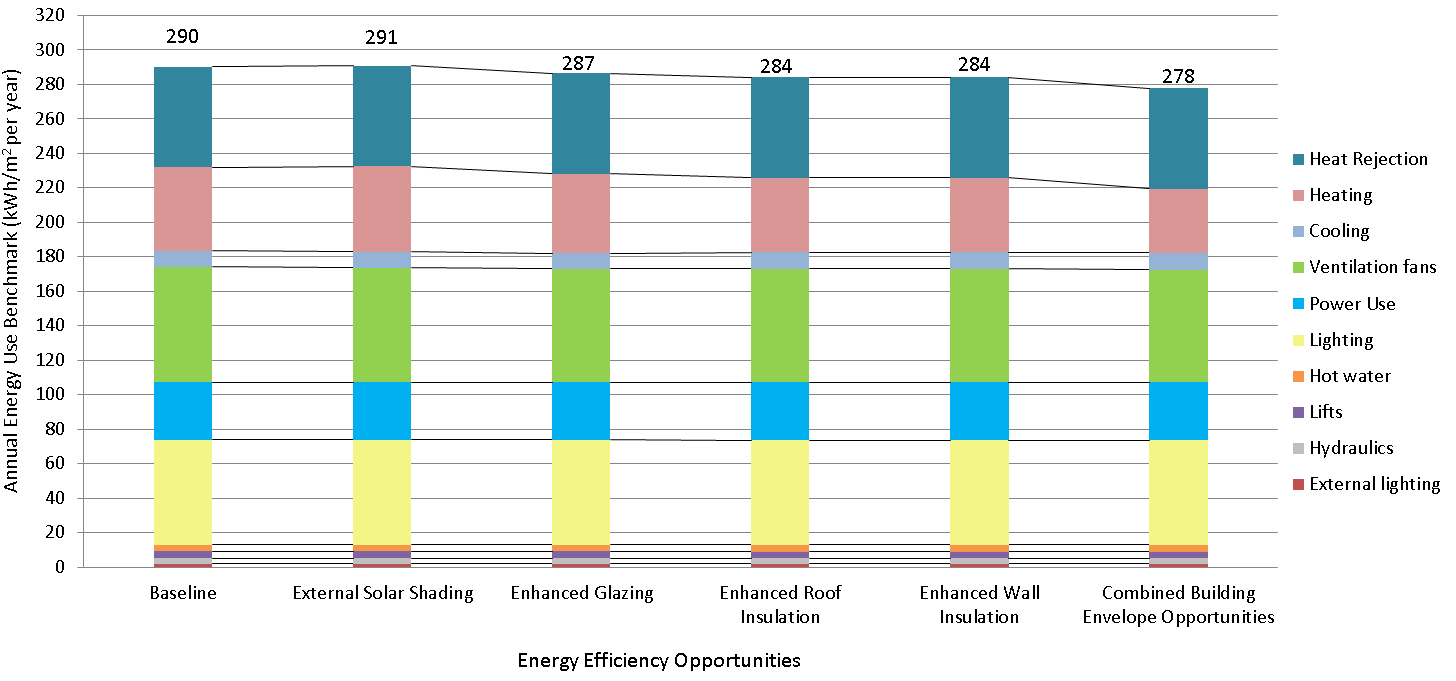
Installing solar shading increases energy consumption by 0.5kWh/m2 per
year due to the reduction in cooling energy being outweighed by an
increase in heating energy consumption. However, due to the difference in
the cost of gas and electricity, solar shading does achieve a $60 per year
energy savings.
Installing IGU Low-e Solar Control glazing is indicated to reduce energy
consumption when compared to the baseline glazing. This is due to
increased thermal resistance (increased U-value) and decreased heat loss
through the glazed areas. It is indicated to decrease energy consumption by
4kWh/m2 per year, as well as provide better thermal comfort due to a lower
radiant effect in winter and summer.
Increasing the roof and wall thermal resistance is indicated to reduce
energy consumption by 6kWh/m2 per year for each option.
Combining the energy efficiency opportunities which offer an energy
reduction (enhanced glazing, roof, and wall) is indicated to offer around
12kWh/m2 per year energy savings compared to the NZBC baseline model.
The energy savings of the combined energy efficiency options may reduce
GHG emissions by more than 40 tonnes per year.
Figure 6 – Annual Energy Use Benchmark Comparison
Table 1 – Annual Energy Savings Benchmark Summary
Enhanced Energy Efficiency Opportunities
Annual Energy and Emissions Savings
Benchmark
Combined Building Envelope
External solar shading
Enhanced Glazing
Enhanced Roof Insulation
Enhanced Wall Insulation
Opportunities
kWh/m2 per year
-0.5
4
6
6
12
kWh per year
-7,000
58,000
96,000
96,000
196,000
$ per year
$60
$4,000
$6,000
$6,000
$11,000
Tonnes CO2-e/ year
-2
12
21
21
43
Beca // 3 June 2016
5138221 // NZ1-12560810-12 0.12 // page 6
MACC - EECA Programme 2A Energy Efficiency Review (Building Envelope)
7
Financial Performance Analysis
A summary of the financial analysis can be seen in the following table:
Table 2 – Financial Analysis Summary
This section compares the financial performance of each energy efficiency opportunity. Please refer to Appendix
B for detailed financial analysis of each enhanced energy efficiency opportunity identified over the NZBC
Enhanced Energy Efficiency Opportunities
baseline building.
Financial
Enhanced
Combined
Performance Indicator
The following indicative capital costs over the baseline have been estimated by Beca energy team generally
External Solar
Glazing
Enhanced Roof
Enhanced Wall
Building
Shading
(IGU Low-e
Insulation
Insulation
Envelope
based on previous project experience and supplier costs, however we recommend these are each confirmed by
Solar Control)
Opportunities
the project cost consultant:
Indicative Capital Cost4
$50K
$80K
$25K
$30K
$135K
Payback Period5
NA years
17 years
5 years
6 years
11 years
Solar Shading ($50K): Estimated
based on
a
high level cost of adding a shading element above the glazing
20 year NPV6
-$49,000
-$25,000
$49,000
$44,000
$10,000
at the roof line of level 4.
20 year IRR
NA
2.4%
24.0%
20.1%
7.3%
Solar Control IGU Low-e ($80K): Based on the NZBC minimum of clear single glazing @ $320/m2 (8 mm
clear toughened) compared to solar control low-e double glazing @ $385/m2 (12.4mm clear toughened low-e
+ 8.4mm solar control toughened)
Roof Option ($25K): Estimated
based on
a
high level cost review comparing the lower insulation material
cost @$58K compared to the proposed higher enhanced roof insulation (R 3.0 m2.K/W)system @$83K.
Wall Option ($30K): Estimated
based on
a
high level cost review comparing the lower insulation material
cost @$85.1K compared to the proposed higher enhanced wall insulation R 2.0 m2.K/W)system @$115.1K.
Combined Opportunities ($135K): The combined capital cost increase of the selected opportunities
(enhance glazing, roof and wall).
The current WCC energy charge rates have been used as follows:
Electricity: $0.10 per kWh
Natural gas: $0.05 per kWh
The payback periods have been compared based on the following calculation while taking account of typical
rates of inflation:
Payback Period (in years) = Initial Investment Cost / Annual Operating Savings
Note that the following considerations have been allowed for in these calculations:
Any reduction in heating or cooling plant or equipment costs as a result of each energy efficiency opportunity
has not been considered
An annual 2.5% inflation increase has been used as instructed by WCC
A 6.5% discount rate has been used as instructed by WCC
Maintenance costs have been excluded
4
Based on indicative increased capital cost over baseline option. Order of capital costs TBC by Cost Consultant. Excluding
GST, contractor P+G and margins, contingency allowance, and professional fees. These estimates are for comparison
purposes only, and not to establish construction budget or estimate operating expenses.
5
Based on WCC electricity rate of 10ȼ/kWh and gas rate of 5ȼ/kWh with a 2.5% annual inflation rate assumed
6
Assumes a 6.5% discount rate
Beca // 3 June 2016
5138221 // NZ1-12560810-12 0.12 // page 7
MACC - EECA Programme 2A Energy Efficiency Review (Building Envelope)
8
Comments & Recommendations
9
Next Steps
Each of the identified energy efficiency opportunities are indicated to offer energy cost savings compared to the
We propose the following next steps:
baseline model, however solar shading increased energy consumption. Overall the combined opportunities
(excluding the solar shading) are indicated to offer significant energy savings of approximately $11k per year
1) Client team to review report & discuss with Beca
(12kWh/m2 per year) with a medium term payback period of 11 years. The medium term payback period is
2) Project QS to review energy efficiency opportunities and confirm implementation cost
largely due to the relatively low energy rates WCC are currently paying. The payback period would be more
favourable should energy rates increase in the future.
3) Project team to incorporate energy efficiency opportunities into building design subject to meeting WCC
investment criteria and project budget
The highest level of energy savings is indicated to be offered by an enhanced level of external wall and roof
insulation. The payback period is indicated as short-term at between 5 to 6 years.
4) Beca to carry out Programme 2B Energy Efficiency Review to assess building services related energy
efficiency opportunities (currently in progress)
The specification of an enhanced glazing performance is also indicated to offer a high level of energy savings
with a long-term payback period of 17 years.
Along with offering energy savings the assessed building envelope opportunities are also recommended for
improved occupancy thermal comfort to improve summer and winter radiant temperatures in the occupied
spaces. External solar shading and glazing performance criteria may result in a reduced peak cooling load and
resulting chiller plant capacity and required AHU sizes. Likewise increased thermal insulation will reduce the
required boiler plant capacity. These potential capital cost savings have not been factored into the assessment.
The energy use attributed to computers and other appliances can be a large variable and should be
benchmarked as the design and Furniture, Fixtures and Equipment (FFE) stage progresses. The simulations
have assumed equipment efficiency is not overly energy efficient at this stage but we recommend that an energy
efficient equipment specification is targeted.
We recommend that WCC considers including the above opportunities subject to meeting their investment
criteria and the project budget.
Beca // 3 June 2016
5138221 // NZ1-12560810-12 0.12 // page 8

MACC - EECA Programme 2A Energy Efficiency Review (Building Envelope)
Appendix A
Computer Simulation Model
Inputs
Beca // 3 June 2016
5138221 // NZ1-12560810-12 0.12 // page 9
MACC - EECA Programme 2A Energy Efficiency Review (Building Envelope)
Table 3 - Baseline Model Building Services inputs
Model Item
Baseline Energy Model Input
Model Input
Comment
Model Item
Baseline Energy Model Input
Model Input
Comment
Reference
Reference
Design space
Convention Centre Space Plenary,
Project
Building
Based upon SPA architectural
temperature and
Pre-Function, General Office, Meeting
Documentation
humidity conditions
Mechanical
documents: dated 12 April 2016.
Rooms and Movie Museum Galleries:
engineer
Beca draft building services
23°C Cooling
preliminary design as at 6 May
20°C Heating
2016.
Convention Centre BOH Circulation
18°C Heating
Thermal simulation
IES Virtual Environment version
CIBSE
Movie Museum BOH Circulation
software
2015
18°C Heating
Weather file for
NIWA Wellington TMY2
Assumed
IWEC files have shown to
Kitchen
thermal simulation
contain errors in
16°C Heating
temperature data
Outdoor Design
Summer:
NIWA
2.5% design day criteria
Humidity:
conditions
23.6oC DB
Not controlled
18.9oC WB
#hrs exceeded is 45
Lighting power
Convention Centre:
Project Electrical
LED lighting design
Winter
density
Exhibition: 8 W/m2
Engineer.
lighting power density
5.2oC
Plenary: 12 W/m2
#hrs exceeded is 110
Pre-Function: 12 W/m2
General Office Areas: 6 W/m2
Ground solar
0.20
(CIBSE) Assumed
Meeting Rooms: 12 W/m2
reflectance
Asphalt
Circulation – Area FOH : 8 W/m2
Modelled spaces
All conditioned and unconditioned
Architectural
Circulation – Area BOH : 5 W/m2
spaces in the building
drawings
Movie Museum:
Areas for each space taken from
Project
Galleries: 8 W/m2
architectural drawings – 04/05/2016
mechanical
Circulation – Area BOH : 4 W/m2
engineer
Assessed spaces
Conditioned spaces
Project
Energy consumption of
Lighting schedule
Office and Museum: NABERS
NABERS
Mechanical
the retail areas is not
Convention Centre: Adapted
engineer
considered.
NABERS for 9am to 10pm operation
Thermal zoning
Spaces zoned to align with
Project
Peak equipment
Convention Centre:
CIBSE Guide A
mechanical system design
Mechanical
gains
Exhibition: 5 W/m2
Table 6.2
engineer
Plenary: 15 W/m2
Manually controlled
Assumptions
Not modelled
Project
external shading
Pre-Function: 15 W/m2
NABERS
Mechanical
device e.g. solar
General Office Areas: 11 W/m2
control blinds,
engineer
Meeting Rooms: 11 W/m2
external louvres etc
Circulation – Area FOH : 5 W/m2
Automatically
Circulation – Area BOH : 5 W/m2
Not modelled
Project
controlled shading
Movie Museum:
Mechanical
device e.g. solar
Galleries: 5 W/m2
control blinds,
engineer
Circulation – Area BOH : 5 W/m2
external louvres
Equipment
NABERS schedule for equipment is
NABERS
schedule
adapted similar to the lighting
schedule
Process load
Not modelled
Project
Covered under
density
Mechanical
equipment gains
engineer
Beca // 3 June 2016
5138221 // NZ1-12560810-12 0.12 // page 10
MACC - EECA Programme 2A Energy Efficiency Review (Building Envelope)
Model Item
Baseline Energy Model Input
Model Input
Comment
Model Item
Baseline Energy Model Input
Model Input
Comment
Reference
Reference
Occupancy density
Convention Centre
WCC movie
Represent typical
Outside air
Convention Centre:
Beca design
Kitchen/Cafe: 5m2 / person
museum business
diversified density
ventilation rate
Exhibition: 8l/s.person
features report
Circulation – FOH and BOH: 5m2/
case
Plenary: 8l/s.person
person
Meeting Rooms: 10l/s.person
Exhibition: 12m2 / person
General Offices: 10l/s.person
Plenary: 12 m2 / person
Circulation – FOH and BOH:
Meeting Rooms: 12 m2 / person
1l/s.person
Office: 15m2 / person
Kitchen: 8l/s.person
Lobby: 5m2 / person
Cafe: 10l/s.person
Movie Museum:
Movie Museum:
Gallery: 29m2 / person
Museum Gallery spaces:
Lobby: 5m2 / person
8l/s.person
Lobby/Circulation: 10l/s.person
Occupancy gains
Exhibition, BOH, and Lobby : 75W
CIBSE Guide A
sensible, 55W latent
Outside air control
Movie Museum:
Project
No heat recovery or
Kitchen:80W sensible 80W latent
9am to 7pm, 7 days a week
mechanical
Demand Controlled
Plenary, Meeting, and Offices:70W
Convention Centre:
engineer
Ventilation
sensible 35W latent
9am to 10pm, 7 days a week
Boiler SEER
90% (condensing gas fired boiler)
Assumed
Outdoor air preheat and
Occupancy
NABERS schedule for occupancy is
NABERS
NZBC Clause H1
4pipe FCU unit heating
schedule
adapted similar to the lighting
Chiller SEER
Full Load: 5.5 (water source chiller)
New water cooled
Typical water cooled
schedule
Part load: 6.1
chiller plant
chiller efficiency
Infiltration rate
0.15 ACH all of the time ( 24hour
Project
occupancy)
mechanical
Heating Hot Water
HHW design flow temp: 60oC -70oC
Project
engineer
Loop
HHW design delta T: 10oC
Mechanical
Night purge
Not modelled
Project
HHW pump configuration: Constant
Engineer
ventilation
mechanical
Primary, Variable Secondary
engineer
Pressurisation
None
Project
Chilled Water Loop
CHW design flow temp:6oC -12oC
Project
requirements
mechanical
CHW design delta T: 6oC
Mechanical
engineer
CHW pump configuration: Constant
Engineer
HVAC operating
Museum exhibition: 24/7 all year
Project
Primary, Variable Secondary
schedule
round
mechanical
Convention: 8am to 10pm, 7 days
engineer
Condensing Water
CDW design flow temp:29oC -35oC
Project
per week
Loop
CDW design delta T: 6oC
Mechanical
1.5 hour optimum start period
CDW pump configuration: Constant
Engineer
Mechanical
Design room temperatures achieved Project
Flow
services control
during occupancy hours
mechanical
strategy
engineer
Pipe/duct heat
5% allowance
Assumed
loss/gains
Pumps
Based on design flow rates
Assumption
AHU Fans
16°C preheat temperature
Project
Typical fan efficiency
Heating coil via HHW gas boiler
mechanical
circuit
engineer
10 no. AHU Variable Volume Fans:
– Flow rates sized using IES
ApacheHVAC
– 2.5W/l.s
Beca // 3 June 2016
5138221 // NZ1-12560810-12 0.12 // page 11
MACC - EECA Programme 2A Energy Efficiency Review (Building Envelope)
Table 4 - Baseline Model Architectural inputs
Model Item
Baseline Energy Model Input
Model Input
Comment
Reference
Model Item
Baseline Energy Model Input
Model Input
Comment
Supply Air Fans
18°C preheat temperature
Project
Typical fan efficiency
Reference
Heating coil via HHW gas boiler
mechanical
Site location
As site location
Assumed
circuit
engineer
Longitude = 174.80 E
2 no. fans:
Latitude = 37.02 S
– SAF-01-01: 2,000l/s
Site Orientation
As site location
Architectural
– SAF-05-01: 6,000l/s
plan drawings
2.5W/l.s
Building
Adjacent buildings modelled
Architectural
Overshadowing
drawings
FCU fans
1 per FCU Zone
Project
Typical AC type FCU fan
Building Geometry
As shown on architectural drawings
Architectural
2.5W/l.s
mechanical
performance
drawings
engineer
Building thermal
External walls: R 1.2 m2.K/W (including
H1 minimum
Clear 4mm single
Exhaust Air fans
7 no. fans:
envelope
Project
Typical fan type
thermal bridging effects)
values
glazing reference
– EAF-01-01: 2,000 l/s
mechanical
performance
Roof: Total R-value: R 1.9 m2.K/W (including
– EAF-05-01: 4,000 l/s
engineer
thermal bridging effects)
– EAF-05-02: 3,500 l/s
R 1.3 ground floor
– EAF-05-03: 2,500 l/s
Glazing:
– EAF-05-04: 2,500 l/s
– Uwindow: U 5.4 W/m2.K (including frame
– EAF-06-01: 2,000 l/s
effect)
– EAF-06-02: 6,000 l/s
Glazing shading
Vision glazing:
NZS4218
4mm single
coefficient
2.5W/l.s
– Shading Coefficient: 0.95
glazing reference
– G value: 0.82
Lifts
4 kWh/m2 per year
GreenStar Office
Internal walls
13mm plasterboard lining, 90mm timber
Architectural
Design & Built
framing, 13mm plasterboard lining
drawings
2009
DHW
4 kWh/m2 per year
GreenStar Office
Intermediate floors
Carpet +underlay, 150mm concrete slab,
Architectural
Design & Built
1000mm ceiling cavity, 13mm plasterboard
drawings
2009
External surface
0.5 (medium coloured) to be assigned to all
Assumed
solar reflectance
external surfaces
External lighting
2 kWh/m2 per year
Assumed
Area of glazing
As per proposed design
Architectural
drawings
Area of frame
10% glazing area
Assumed
Area of skylight/
None
Architectural
clerestory
drawings
Fixed external solar
Fixed Solar Shading modelled as per the
Architectural
Basecase
shading device
proposed design.
drawings
allowance
Manually controlled
Blinds are not operated
Assumed
curtains/blinds
Manually controlled
Not proposed
Assumed
natural ventilation
openings
Beca // 3 June 2016
5138221 // NZ1-12560810-12 0.12 // page 12
MACC - EECA Programme 2A Energy Efficiency Review (Building Envelope)
Table 5 – NABERS lighting schedule
Convention Centre areas:
Museum and Office areas:
12am-
7am-
8am-
9am-
10pm-
11pm-
7am
8am
9am
10pm
11pm
12pm
12am-
7am-
8am-
9am-
5pm-
6pm-
8pm-
9pm-
7am
8am
9am
5pm
6pm
8pm
9pm
12am
Week
0%
15%
60%
100%
50%
15%
Saturday
0%
15%
60%
100%
50%
15%
Week
15%
40%
90%
100%
80%
60%
50%
15%
Sunday
0%
15%
60%
100%
50%
15%
Saturday
15%
40%
90%
100%
80%
60%
50%
15%
Sunday
15%
40%
90%
100%
80%
60%
50%
15%
Table 8 – Energy Efficiency Opportunities
Convention Centre areas:
Model Item
Energy Model Input
Model Input Reference
Solar Shading
2m overhang at roof level above Level 4
12am-
7am-
8am-
9am-
10pm-
11pm-
7am
8am
9am
10pm
11pm
12pm
north facade
Week
15%
40%
90%
100%
80%
50%
Enhanced Glazing
IGU Low-e Solar Control
Saturday
15%
40%
90%
100%
80%
50%
–
Sunday
15%
40%
90%
100%
80%
50%
Uwindow: 3.0 W/m2.K (including frame effect)
–
Shading Coefficient: 0.4
– G value: 0.34
Table 6 – NABERS equipment schedule
Enhanced Roof Insulation
Total R-value: R 2.91 m2.K/W (including
Museum and Office areas:
thermal bridging effects)
12am-
7am-
8am-
9am-
5pm-
6pm-
7pm-
9pm-
Enhanced Wall Insulation
Total R-value: 2.0 m2.K/W (including thermal
7am
8am
9am
5pm
6pm
7pm
9pm
12am
bridging effects)
Week
25%
65%
80%
100%
80%
65%
25%
25%
Saturday
25%
65%
80%
100%
80%
65%
25%
25%
Combined Energy
Current Design proposal with the following
As above
Efficiency Opportunities
Sunday
25%
65%
80%
100%
80%
65%
25%
25%
opportunities combined:
– Enhanced Glazing
– Enhanced Roof
Convention Centre areas:
– Enhanced Wall
12am-
7am-
8am-
9am-
10pm-
11pm-
7am
8am
9am
10pm
11pm
12pm
Week
25%
65%
80%
100%
80%
25%
Saturday
25%
65%
80%
100%
80%
25%
Sunday
25%
65%
80%
100%
80%
25%
Table 7 – NABERS occupancy schedule
Museum and Office areas:
12am-
7am-
8am-
9am-
5pm-
6pm-
7pm-
9pm-
7am
8am
9am
5pm
6pm
7pm
9pm
12am
Week
0%
15%
60%
100%
50%
15%
5%
0%
Saturday
0%
15%
60%
100%
50%
15%
5%
0%
Sunday
0%
15%
60%
100%
50%
15%
5%
0%
Beca // 3 June 2016
5138221 // NZ1-12560810-12 0.12 // page 13

MACC - EECA Programme 2A Energy Efficiency Review (Building Envelope)
Appendix B
Financial Performance
Analysis
Beca // 3 June 2016
5138221 // NZ1-12560810-12 0.12 // page 14
MACC - EECA Programme 2A Energy Efficiency Review (Building Envelope)
Solar Shading
Years
Annual
Cummulative
Payback
Capital
Annual Cash
Present Value of
Net Present Value of
Savings
Savings
Investment
Flow
Saving
Savings
Client Input Values
0
$0
$0
-$50,000
$50,000
-$50,000
-$50,000
-$50,000
Inflation Rate
2.5%
1
$60
$60
-$49,940
$0
$60
$56
-$49,944
Discount Rate
6.5%
2
$62
$122
-$49,879
$0
$62
$54
-$49,889
3
$63
$185
-$49,815
$0
$63
$52
-$49,837
4
$65
$249
-$49,751
$0
$65
$50
-$49,787
Assessment Inputs
5
$66
$315
-$49,685
$0
$66
$48
-$49,739
Capital Cost
$ 5
0,000
6
$68
$383
-$49,617
$0
$68
$47
-$49,692
Secondary Capital Cost
$ -
7
$70
$453
-$49,547
$0
$70
$45
-$49,647
Time of Secondary Capital Cost (Years)
0
8
$71
$524
-$49,476
$0
$71
$43
-$49,604
Annual Savings
$60
9
$73
$597
-$49,403
$0
$73
$41
-$49,563
Assessment Length (Years)
20
10
$75
$672
-$49,328
$0
$75
$40
-$49,523
11
$77
$749
-$49,251
$0
$77
$38
-$49,484
12
$79
$828
-$49,172
$0
$79
$37
-$49,448
Assessment Results
13
$81
$908
-$49,092
$0
$81
$36
-$49,412
Payback Period (years)
NA
14
$83
$991
-$49,009
$0
$83
$34
-$49,378
Total NPV
-$49,198
15
$85
$1,076
-$48,924
$0
$85
$33
-$49,345
IRR
NA
16
$87
$1,163
-$48,837
$0
$87
$32
-$49,313
ROI
-97%
17
$89
$1,252
-$48,748
$0
$89
$31
-$49,282
18
$91
$1,343
-$48,657
$0
$91
$29
-$49,253
25
19
$94
$1,437
-$48,563
$0
$94
$28
-$49,225
20
$96
$1,533
-$48,467
$0
$96
$27
-$49,198
Total
$1,533
-$46,935
-$49,198
Inflation Rate
Glossary of Terms
Discount Rate
The discount rate is the rate at which cash
depreciates with time, hence the value of annual
savings decreases.
Capital Cost
Capital costs are fixed one time expenses,
typically the purchase of plant.
Present Value (PV)
PV is the present day value of the future returns
from the investment.
Internal Rate Of Return (IRR)
IRR is the discount rate that make the NPV = 0
at the end of the assessment period. i.e. The
Internal Rate of Return is the rate where if you
discount all of the future cash flows, the present
value of the flows is equal to the cost.
Net Present Value (NPV)
NPV is the sum of all previous PV's.
Beca // 3 June 2016
5138221 // NZ1-12560810-12 0.12 // page 15
MACC - EECA Programme 2A Energy Efficiency Review (Building Envelope)
Enhanced Glazing (IGU Low-e Solar Control)
Years
Annual
Cummulative
Payback
Capital
Annual Cash
Present Value of
Net Present Value of
Savings
Savings
Investment
Flow
Saving
Savings
Client Input Values
0
$ -
$ -
$ ( 80,000) $ 8
0,000
$ ( 80,000) $ ( 80,000) $ ( 80,000)
Inflation Rate
2.5%
1
$ 4
,076
$ 4
,076
$ ( 75,924) $ -
$ 4
,076
$ 3
,827
$ ( 76,173)
Discount Rate
6.5%
2
$ 4
,178
$ 8
,254
$ ( 71,746) $ -
$ 4
,178
$ 3
,683
$ ( 72,489)
3
$ 4
,282
$ 1
2,536
$ ( 67,464) $ -
$ 4
,282
$ 3
,545
$ ( 68,944)
4
$ 4
,389
$ 1
6,926
$ ( 63,074) $ -
$ 4
,389
$ 3
,412
$ ( 65,532)
Assessment Inputs
5
$ 4
,499
$ 2
1,425
$ ( 58,575) $ -
$ 4
,499
$ 3
,284
$ ( 62,248)
Capital Cost
$ 8
0,000
6
$ 4
,612
$ 2
6,036
$ ( 53,964) $ -
$ 4
,612
$ 3
,161
$ ( 59,088)
Secondary Capital Cost
$ -
7
$ 4
,727
$ 3
0,763
$ ( 49,237) $ -
$ 4
,727
$ 3
,042
$ ( 56,046)
Time of Secondary Capital Cost (Years)
0
8
$ 4
,845
$ 3
5,608
$ ( 44,392) $ -
$ 4
,845
$ 2
,928
$ ( 53,118)
Annual Savings
$ 4
,076
9
$ 4
,966
$ 4
0,575
$ ( 39,425) $ -
$ 4
,966
$ 2
,818
$ ( 50,301)
Assessment Length (Years)
20
10
$ 5
,090
$ 4
5,665
$ ( 34,335) $ -
$ 5
,090
$ 2
,712
$ ( 47,589)
11
$ 5
,218
$ 5
0,883
$ ( 29,117) $ -
$ 5
,218
$ 2
,610
$ ( 44,979)
12
$ 5
,348
$ 5
6,231
$ ( 23,769) $ -
$ 5
,348
$ 2
,512
$ ( 42,467)
Assessment Results
13
$ 5
,482
$ 6
1,712
$ ( 18,288) $ -
$ 5
,482
$ 2
,418
$ ( 40,050)
Payback Period (years)
17.0
14
$ 5
,619
$ 6
7,331
$ ( 12,669) $ -
$ 5
,619
$ 2
,327
$ ( 37,723)
Total NPV
$ (
25,487)
15
$ 5
,759
$ 7
3,091
$ ( 6,909) $ -
$ 5
,759
$ 2
,239
$ ( 35,484)
IRR
2.4%
16
$ 5
,903
$ 7
8,994
$ ( 1,006) $ -
$ 5
,903
$ 2
,155
$ ( 33,328)
ROI
30%
17
$ 6
,051
$ 8
5,045
$ 5
,045
$ -
$ 6
,051
$ 2
,074
$ ( 31,254)
18
$ 6
,202
$ 9
1,247
$ -
$ 6
,202
$ 1
,996
$ ( 29,258)
25
19
$ 6
,357
$ 9
7,604
$ -
$ 6
,357
$ 1
,921
$ ( 27,336)
20
$ 6
,516
$ 1
04,120
$ -
$ 6
,516
$ 1
,849
$ ( 25,487)
Total
$ 1
04,120
$ ( 25,487)
Inflation Rate
Glossary of Terms
Discount Rate
The discount rate is the rate at which cash
depreciates with time, hence the value of annual
savings decreases.
Capital Cost
Capital costs are fixed one time expenses,
typically the purchase of plant.
Present Value (PV)
PV is the present day value of the future returns
from the investment.
Internal Rate Of Return (IRR)
IRR is the discount rate that make the NPV = 0
at the end of the assessment period. i.e. The
Internal Rate of Return is the rate where if you
discount all of the future cash flows, the present
value of the flows is equal to the cost.
Net Present Value (NPV)
NPV is the sum of all previous PV's.
Beca // 3 June 2016
5138221 // NZ1-12560810-12 0.12 // page 16
MACC - EECA Programme 2A Energy Efficiency Review (Building Envelope)
Enhanced Roof Option
Years
Annual
Cummulative
Payback
Capital
Annual Cash
Present Value of
Net Present Value of
Savings
Savings
Investment
Flow
Saving
Savings
Client Input Values
0
$ -
$ -
$ ( 25,000) $ 2
5,000
$ ( 25,000) $ ( 25,000) $ ( 25,000)
Inflation Rate
2.5%
1
$ 5
,501
$ 5
,501
$ ( 19,499) $ -
$ 5
,501
$ 5
,165
$ ( 19,835)
Discount Rate
6.5%
2
$ 5
,639
$ 1
1,140
$ ( 13,860) $ -
$ 5
,639
$ 4
,971
$ ( 14,863)
3
$ 5
,779
$ 1
6,919
$ ( 8,081) $ -
$ 5
,779
$ 4
,785
$ ( 10,079)
4
$ 5
,924
$ 2
2,843
$ ( 2,157) $ -
$ 5
,924
$ 4
,605
$ ( 5,474)
Assessment Inputs
5
$ 6
,072
$ 2
8,915
$ 3
,915
$ -
$ 6
,072
$ 4
,432
$ ( 1,042)
Capital Cost
$ 2
5,000
6
$ 6
,224
$ 3
5,139
$ -
$ 6
,224
$ 4
,265
$ 3
,223
Secondary Capital Cost
$ -
7
$ 6
,379
$ 4
1,518
$ -
$ 6
,379
$ 4
,105
$ 7
,328
Time of Secondary Capital Cost (Years)
0
8
$ 6
,539
$ 4
8,057
$ -
$ 6
,539
$ 3
,951
$ 1
1,280
Annual Savings
$ 5
,501
9
$ 6
,702
$ 5
4,760
$ -
$ 6
,702
$ 3
,803
$ 1
5,082
Assessment Length (Years)
20
10
$ 6
,870
$ 6
1,630
$ -
$ 6
,870
$ 3
,660
$ 1
8,742
11
$ 7
,042
$ 6
8,672
$ -
$ 7
,042
$ 3
,522
$ 2
2,264
12
$ 7
,218
$ 7
5,889
$ -
$ 7
,218
$ 3
,390
$ 2
5,654
Assessment Results
13
$ 7
,398
$ 8
3,288
$ -
$ 7
,398
$ 3
,263
$ 2
8,917
Payback Period (years)
5.0
14
$ 7
,583
$ 9
0,871
$ -
$ 7
,583
$ 3
,140
$ 3
2,057
Total NPV
$ 4
8,571
15
$ 7
,773
$ 9
8,644
$ -
$ 7
,773
$ 3
,022
$ 3
5,080
IRR
24.0%
16
$ 7
,967
$ 1
06,611
$ -
$ 7
,967
$ 2
,909
$ 3
7,988
ROI
462%
17
$ 8
,166
$ 1
14,777
$ -
$ 8
,166
$ 2
,799
$ 4
0,788
18
$ 8
,370
$ 1
23,147
$ -
$ 8
,370
$ 2
,694
$ 4
3,482
25
19
$ 8
,580
$ 1
31,727
$ -
$ 8
,580
$ 2
,593
$ 4
6,075
20
$ 8
,794
$ 1
40,521
$ -
$ 8
,794
$ 2
,496
$ 4
8,571
Total
$ 1
40,521
$ 4
8,571
Inflation Rate
Glossary of Terms
Discount Rate
The discount rate is the rate at which cash
depreciates with time, hence the value of annual
savings decreases.
Capital Cost
Capital costs are fixed one time expenses,
typically the purchase of plant.
Present Value (PV)
PV is the present day value of the future returns
from the investment.
Internal Rate Of Return (IRR)
IRR is the discount rate that make the NPV = 0
at the end of the assessment period. i.e. The
Internal Rate of Return is the rate where if you
discount all of the future cash flows, the present
value of the flows is equal to the cost.
Net Present Value (NPV)
NPV is the sum of all previous PV's.
Beca // 3 June 2016
5138221 // NZ1-12560810-12 0.12 // page 17
MACC - EECA Programme 2A Energy Efficiency Review (Building Envelope)
Enhanced Wall Option
Years
Annual
Cummulative
Payback
Capital
Annual Cash
Present Value of
Net Present Value of
Savings
Savings
Investment
Flow
Saving
Savings
Client Input Values
0
$ -
$ -
$ ( 30,000) $ 3
0,000
$ ( 30,000) $ ( 30,000) $ ( 30,000)
Inflation Rate
2.5%
1
$ 5
,501
$ 5
,501
$ ( 24,499) $ -
$ 5
,501
$ 5
,165
$ ( 24,835)
Discount Rate
6.5%
2
$ 5
,639
$ 1
1,140
$ ( 18,860) $ -
$ 5
,639
$ 4
,971
$ ( 19,863)
3
$ 5
,779
$ 1
6,919
$ ( 13,081) $ -
$ 5
,779
$ 4
,785
$ ( 15,079)
4
$ 5
,924
$ 2
2,843
$ ( 7,157) $ -
$ 5
,924
$ 4
,605
$ ( 10,474)
Assessment Inputs
5
$ 6
,072
$ 2
8,915
$ ( 1,085) $ -
$ 6
,072
$ 4
,432
$ ( 6,042)
Capital Cost
$ 3
0,000
6
$ 6
,224
$ 3
5,139
$ 5
,139
$ -
$ 6
,224
$ 4
,265
$ ( 1,777)
Secondary Capital Cost
$ -
7
$ 6
,379
$ 4
1,518
$ -
$ 6
,379
$ 4
,105
$ 2
,328
Time of Secondary Capital Cost (Years)
0
8
$ 6
,539
$ 4
8,057
$ -
$ 6
,539
$ 3
,951
$ 6
,280
Annual Savings
$ 5
,501
9
$ 6
,702
$ 5
4,760
$ -
$ 6
,702
$ 3
,803
$ 1
0,082
Assessment Length (Years)
20
10
$ 6
,870
$ 6
1,630
$ -
$ 6
,870
$ 3
,660
$ 1
3,742
11
$ 7
,042
$ 6
8,672
$ -
$ 7
,042
$ 3
,522
$ 1
7,264
12
$ 7
,218
$ 7
5,889
$ -
$ 7
,218
$ 3
,390
$ 2
0,654
Assessment Results
13
$ 7
,398
$ 8
3,288
$ -
$ 7
,398
$ 3
,263
$ 2
3,917
Payback Period (years)
6.0
14
$ 7
,583
$ 9
0,871
$ -
$ 7
,583
$ 3
,140
$ 2
7,057
Total NPV
$ 4
3,571
15
$ 7
,773
$ 9
8,644
$ -
$ 7
,773
$ 3
,022
$ 3
0,080
IRR
20.1%
16
$ 7
,967
$ 1
06,611
$ -
$ 7
,967
$ 2
,909
$ 3
2,988
ROI
368%
17
$ 8
,166
$ 1
14,777
$ -
$ 8
,166
$ 2
,799
$ 3
5,788
18
$ 8
,370
$ 1
23,147
$ -
$ 8
,370
$ 2
,694
$ 3
8,482
25
19
$ 8
,580
$ 1
31,727
$ -
$ 8
,580
$ 2
,593
$ 4
1,075
20
$ 8
,794
$ 1
40,521
$ -
$ 8
,794
$ 2
,496
$ 4
3,571
Total
$ 1
40,521
$ 4
3,571
Inflation Rate
Glossary of Terms
Discount Rate
The discount rate is the rate at which cash
depreciates with time, hence the value of annual
savings decreases.
Capital Cost
Capital costs are fixed one time expenses,
typically the purchase of plant.
Present Value (PV)
PV is the present day value of the future returns
from the investment.
Internal Rate Of Return (IRR)
IRR is the discount rate that make the NPV = 0
at the end of the assessment period. i.e. The
Internal Rate of Return is the rate where if you
discount all of the future cash flows, the present
value of the flows is equal to the cost.
Net Present Value (NPV)
NPV is the sum of all previous PV's.
Beca // 3 June 2016
5138221 // NZ1-12560810-12 0.12 // page 18
MACC - EECA Programme 2A Energy Efficiency Review (Building Envelope)
Combined Enhanced Envelope Options
Years
Annual
Cummulative
Payback
Capital
Annual Cash
Present Value of
Net Present Value of
Savings
Savings
Investment
Flow
Saving
Savings
Client Input Values
0
$ -
$ -
$ ( 135,000) $ 1
35,000
$ ( 135,000) $ ( 135,000) $ ( 135,000)
Inflation Rate
2.5%
1
$ 1
0,829
$ 1
0,829
$ ( 124,171) $ -
$ 1
0,829
$ 1
0,168
$ ( 124,832)
Discount Rate
6.5%
2
$ 1
1,100
$ 2
1,929
$ ( 113,071) $ -
$ 1
1,100
$ 9
,786
$ ( 115,046)
3
$ 1
1,377
$ 3
3,306
$ ( 101,694) $ -
$ 1
1,377
$ 9
,419
$ ( 105,627)
4
$ 1
1,662
$ 4
4,968
$ ( 90,032) $ -
$ 1
1,662
$ 9
,065
$ ( 96,562)
Assessment Inputs
5
$ 1
1,953
$ 5
6,921
$ ( 78,079) $ -
$ 1
1,953
$ 8
,724
$ ( 87,838)
Capital Cost
$ 1
35,000
6
$ 1
2,252
$ 6
9,173
$ ( 65,827) $ -
$ 1
2,252
$ 8
,397
$ ( 79,441)
Secondary Capital Cost
$ -
7
$ 1
2,558
$ 8
1,731
$ ( 53,269) $ -
$ 1
2,558
$ 8
,081
$ ( 71,360)
Time of Secondary Capital Cost (Years)
0
8
$ 1
2,872
$ 9
4,603
$ ( 40,397) $ -
$ 1
2,872
$ 7
,778
$ ( 63,582)
Annual Savings
$ 1
0,829
9
$ 1
3,194
$ 1
07,797
$ ( 27,203) $ -
$ 1
3,194
$ 7
,486
$ ( 56,096)
Assessment Length (Years)
20
10
$ 1
3,524
$ 1
21,321
$ ( 13,679) $ -
$ 1
3,524
$ 7
,205
$ ( 48,892)
11
$ 1
3,862
$ 1
35,183
$ 183
$ -
$ 1
3,862
$ 6
,934
$ ( 41,958)
12
$ 1
4,209
$ 1
49,392
$ -
$ 1
4,209
$ 6
,674
$ ( 35,284)
Assessment Results
13
$ 1
4,564
$ 1
63,956
$ -
$ 1
4,564
$ 6
,423
$ ( 28,861)
Payback Period (years)
11.0
14
$ 1
4,928
$ 1
78,884
$ -
$ 1
4,928
$ 6
,182
$ ( 22,680)
Total NPV
$ 9
,829
15
$ 1
5,301
$ 1
94,185
$ -
$ 1
5,301
$ 5
,949
$ ( 16,730)
IRR
7.3%
16
$ 1
5,684
$ 2
09,868
$ -
$ 1
5,684
$ 5
,726
$ ( 11,004)
ROI
105%
17
$ 1
6,076
$ 2
25,944
$ -
$ 1
6,076
$ 5
,511
$ ( 5,493)
18
$ 1
6,478
$ 2
42,422
$ -
$ 1
6,478
$ 5
,304
$ ( 189)
25
19
$ 1
6,890
$ 2
59,311
$ -
$ 1
6,890
$ 5
,105
$ 4
,916
20
$ 1
7,312
$ 2
76,623
$ -
$ 1
7,312
$ 4
,913
$ 9
,829
Total
$ 2
76,623
$ 9
,829
Inflation Rate
Glossary of Terms
Discount Rate
The discount rate is the rate at which cash
depreciates with time, hence the value of annual
savings decreases.
Capital Cost
Capital costs are fixed one time expenses,
typically the purchase of plant.
Present Value (PV)
PV is the present day value of the future returns
from the investment.
Internal Rate Of Return (IRR)
IRR is the discount rate that make the NPV = 0
at the end of the assessment period. i.e. The
Internal Rate of Return is the rate where if you
discount all of the future cash flows, the present
value of the flows is equal to the cost.
Net Present Value (NPV)
NPV is the sum of all previous PV's.
Beca // 3 June 2016
5138221 // NZ1-12560810-12 0.12 // page 19