

 Business Case Report
Kerbside Collections
August 2019
© Morrison Low
1
 Document status
Ref
Approving Director
Date
Document status
Ref
Approving Director
Date
2397, draft
Dan Bonifant
18/04/2019
2397, final draft
Dan Bonifant
30/07/2019
2397, final
Dan Bonifant
08/08/2019
© Morrison Low
Except for all client data and factual information contained herein, this document is the copyright of Morrison Low. All or any part of
it may only be used, copied or reproduced for the purpose for which it was originally intended, except where the prior permission to
do otherwise has been sought from and granted by Morrison Low. Prospective users are invited to make enquiries of Morrison Low
concerning using all or part of this copyright document for purposes other than that for which it was intended.
link to page 4 link to page 5 link to page 5 link to page 7 link to page 7 link to page 7 link to page 9 link to page 9 link to page 9 link to page 13 link to page 13 link to page 15 link to page 15 link to page 18 link to page 18 link to page 18 link to page 21 link to page 22 link to page 22 link to page 22 link to page 23 link to page 23 link to page 24 link to page 27 link to page 28 link to page 32 link to page 34 link to page 41
 Contents
Executive summary
1
Introduction
2
BBC assessment methodology
3
Strategic case – the case for change
4
Refuse collection
4
Recycling collection
4
Recycling stations
6
Organics
6
Longlist assessment
7
Shortlisted options
10
Economic case – identifying the preferred option
10
Service use and tonnes collected
12
Service costs
12
The recommended option
15
Recycling services
15
Refuse collection service
15
Financial case
19
Rates funding
19
Bin and crate purchase
19
PAYT
19
Commercial case
20
Management case – the way forward
20
Appendix 1
Better Business Case Summary
Appendix 2
Investment Logic Map (ILM)
Appendix 3
Longlist Options Assessment
Appendix 4
Financial Modelling for Economic Case
Appendix 5
Hutt City Council Terms of Reference
Appendix 6
Health and Safety of Manual and Automated Collections
Contents
Executive summary
1
Introduction
2
BBC assessment methodology
3
Strategic case – the case for change
4
Refuse collection
4
Recycling collection
4
Recycling stations
6
Organics
6
Longlist assessment
7
Shortlisted options
10
Economic case – identifying the preferred option
10
Service use and tonnes collected
12
Service costs
12
The recommended option
15
Recycling services
15
Refuse collection service
15
Financial case
19
Rates funding
19
Bin and crate purchase
19
PAYT
19
Commercial case
20
Management case – the way forward
20
Appendix 1
Better Business Case Summary
Appendix 2
Investment Logic Map (ILM)
Appendix 3
Longlist Options Assessment
Appendix 4
Financial Modelling for Economic Case
Appendix 5
Hutt City Council Terms of Reference
Appendix 6
Health and Safety of Manual and Automated Collections
© Morrison Low
i
 Executive summary
A review of Hutt City Council’s refuse and recycling services has been undertaken using the Treasury’s Better
Business Case (BBC) process. The review also considered the role of recycling drop-off stations and the
opportunity to introduce a kerbside organics collection service.
Based on this assessment, the recommended approach for kerbside recycling collection is to move to a 2-
stream recycling service, providing households with a 240L wheelie bin for mixed recycling and a 45L crate
for glass, both collected fortnightly. Alongside this, the provision of recycling drop-off stations should be
reduced from five to two, with the new recycling drop-off stations restricted to locations where drop-off can
be supervised when open. Kerbside recycling and the recycling drop-off stations would continue to be
funded through rates.
For the kerbside refuse collection service, the recommended approach is a rates-funded wheelie bin
collected weekly, available in different sizes to match household needs, with an option to opt-out of the
rates-funded service, and a move to pay-as-you-throw (PAYT) when technology enables. Depending on the
availability of suitable and cost-effective technology, a PAYT bin service could be a workable alternative to a
rates-funded service. This could be confirmed via a procurement process for renewal of Council’s kerbside
collection services. The PAYT option could be tested in terms of technical feasibility and costs in comparison
to the rates-funded bin.
A kerbside organics collection service is not proposed at this point in time. Further analysis of carbon
emissions from organics services and learnings from Wellington City’s food waste collection trial will be used
to inform a decision on this service at a future time.
The recommended options will improve health and safety outcomes, reduce windblown litter and animal
strike, and divert more waste from landfill. For an average household, a rates-funded service can deliver both
a refuse collection and recycling collection service for less cost than a private refuse collection service alone
and is therefore more affordable. Offering the option of smaller bin sizes, opting out and a move to PAYT
when technology enables, provides a cost-effective option for smaller households and those that produce
less waste.
In order to successfully implement the recommended approach, the following actions are proposed, and a
possible timeline is provided:
•
Consult with community on proposed service changes for refuse collection, recycling collection and
recycling drop-off stations, e.g. through 2020 Annual Plan consultation.
•
Undertake procurement for new kerbside refuse and recycling collection services (run in parallel, but
only released to market after 2020 Annual Plan deliberations complete, i.e. release to market July
2020, awarded December 2020).
•
Based on procurement outcomes, inform community of cost of service changes, e.g. through
consultation on 2021-2031 Long Term Plan.
•
Mobilise and roll out new kerbside refuse and recycling collection services (mobilise from January
2021 and commence new services July 2021, at the earliest).
•
Progressively decommission recycling drop-off stations following introduction of new kerbside
recycling collection service (from July 2021 onwards).
© Morrison Low
1

 Introduction
Morrison Low was commissioned by Hutt City Council to review the provision of kerbside collection services
by completing a business case that considered options for future kerbside collection services. This review
was undertaken alongside two other service reviews: resource recovery centre provision, and hazardous
waste management. Morrison Low followed the New Zealand Treasury’s Better Business Case (BBC) process,
which is good practice for public sector decision-making.
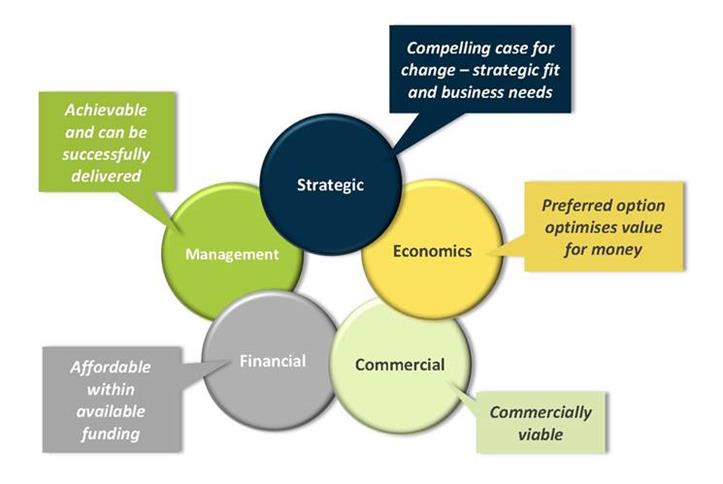
The aim of the approach is to provide objective analysis and consistent information to decision-makers,
enabling them to make smart investment decisions for public value.1 It is an ideal tool for the public sector to
make long-term decisions regarding service delivery. It looks at financial measures but in a weighted,
balanced context with four other factors (strategic, economic, commercial and management) as detailed in
Figure 1.
Figure 1: The Better Business Case Approach
This report provides an overview of the process followed to develop the BBC, but the key decision-making
document that summarises the findings of the BBC assessment with respect to the five cases above is the
one-page BBC Summary provided in Appendix 1. In addition, supporting information is provided in the
remaining four appendices. The full list of appended documents is:
•
Appendix 1 – Better Business Case Summary
•
Appendix 2 – Investment Logic Map (ILM)
•
Appendix 3 – Longlist options assessment
•
Appendix 4 – Financial modelling for Economic Case
•
Appendix 5 – Hutt City Council Terms of Reference
1 https://treasury.govt.nz/information-and-services/state-sector-leadership/investment-management/better-business-cases-bbc
© Morrison Low
2
 BBC assessment methodology
The following steps have been undertaken to complete the BBC:
•
Project initiation meeting and review of background information, including waste data and financial
information and previous studies looking at Council’s kerbside collection services.
•
Investment Logic Mapping (ILM) workshop with stakeholders representing council staff, staff from
neighbouring Upper Hutt City Council, and the existing kerbside collection service provider Waste
Management. The ILM identified issues and opportunities with the current services provided. The
collections ILM is attached in Appendix 2.
•
Development of strategic objectives to address the issues and opportunities from the ILM workshop.
These objectives were able to be standardised across the three waste services reviews.
•
Completion of the strategic case for change including issues and opportunities to be addressed, the
legal context, and for each of the objectives: the scope of the review, the anticipated benefits and
risks, and key performance indicators.
•
Development of a longlist of options for kerbside collection services and assessment of these options
against the strategic objectives and critical success factors. Critical success factors are common to all
BBCs and include alignment with Council objectives, supplier capability and capacity, value for money
and affordability, and achievability with Council’s resources. The options assessed covered the full
range of available options across the dimensions shown in Figure 2. The longlist assessment is
provided in Appendix 3.
Service scope
Service solution
Service delivery
Implementation
Funding
(what)
(how)
(who)
(when)
Figure 2: Longlist option dimensions
•
Review of the longlist assessment at a workshop with key stakeholders.
•
Meetings with project steering group members after completion of the strategic case and following
review of the longlist assessment to update them on progress.
•
Shortlisting of options and an economic assessment of these shortlisted options that included a
financial assessment (Net Present Value, NPV) and non-financial assessment (Multi Criteria
Assessment, MCA) to identify the preferred option. The NPV analysis for the shortlisted options is
provided in Appendix 4.
•
For the preferred option, completion of the commercial, financial and management cases.
•
Completion of a brief covering report detailing the BBC methodology and outcomes.
The project has been completed to meet the project requirements set out in Council’s Terms of Reference,
attached in Appendix 5.
© Morrison Low
3
 Strategic case – the case for change
The current contract for Council's kerbside collection service ends in the third quarter of 2019 albeit work is
currently underway to extend this contract, with a re-tender ahead of this (the recommended extension is to
June 2021). This contract also includes the provision of four recycling drop-off points in Kelson, Wainuiomata,
Alicetown and Naenae. A fifth recycling drop-off point is available to the community at Waste Management’s
Seaview transfer station on a commercial basis, i.e. this station is not funded by Council. There is an
opportunity to review the services ahead of re-tendering the contracts. A review of Hutt City Council’s refuse
bylaw is also currently underway and could support any service changes. Note that the bylaw may be a
regionally consistent bylaw to achieve better outcomes across the Greater Wellington Region.
Council's current kerbside collection services are discussed in the following sections.
Refuse collection
A weekly user-pays bag collection service is provided to both urban residential and commercial customers.
Customers can put out as many (or as few) bags as they have paid for. Waste companies also provide private
refuse wheelie bin services directly to customers (i.e. non-Council service).
Experience throughout New Zealand has shown that customers tend to prefer bins to bags for refuse
collection because they are more convenient, easier to use, less prone to animal strike and generally less
odorous.
In Lower Hutt, residents (that have the ability to pay or willingness) have taken up private wheelie bin
services and consequently Council's market share, although stable, sits at around 30%. The service is
currently self-funding and realising a surplus of approximately $400,000 for Council per year. However,
experience in other parts of New Zealand shows that further reductions in market share (e.g. following key
changes in the market) may result in the service being less cost-effective. To respond to this, Council could
increase the price of its rubbish bags to cover the funding shortfall. However, this may incentivise more
customers to move to a wheelie bin service as the cost difference between rubbish bags and a private
wheelie bin narrows.
Bag collection services have been identified as higher risk from a worker health and safety perspective than
bin collection services due to the need to exit the vehicle to complete the collection, manual handling of
bags, and exposure to sharps. The health and safety risks of different collection methodologies are outlined
in the discussion paper in Appendix 6.
Recycling collection
A weekly kerbside collection service is provided to residential customers only. The service is a kerbside sort
of 55L2 crates.
2 In the past, 45L crates were rolled out, but the current size of crates sold by Council is 55L. The current share of smaller vs larger
crates is not known.
© Morrison Low
4

Throughout New Zealand councils have found that customers prefer wheelie bins for their recycling
collection services because the materials are not impacted by wind and rain and the greater capacity enables
customers to recycle more3. Hutt City Council continues to see recyclables disposed of in their refuse service
despite a recycling service being provided4. This has been shown to reduce with wheelie bin recycling
services.
However, the improved convenience of wheelie bins is balanced by the need for post-collection sorting in a
processing facility and the inability to detect contamination until wheelie bins are lifted. Overall, these two
factors result in greater contamination of recyclables in wheelie bin services – albeit there are means to
manage this such as checking bin contents ahead of collections (bin audits), cameras on trucks to identify
non-compliant households, and providing feedback to them, or withdrawing bins as a last resort. The
separation of glass from other recyclables has been shown throughout the country to address a large
proportion of the contamination and reduction in recycling quality that results from mixed recycling wheelie
bin collections.
Recycling crate services have higher worker health and safety risks than wheelie bins due to the need for
workers to exit trucks, manually handle crates, and handle recyclables, including sharps (e.g. broken glass).
In addition, recycling crates, due to their design and lack of effective means to retain recyclables, tend to
lead to significant litter production during frequent windy days, as evidenced by frequent resident
complaints. This litter tends to enter the storm water system and can end up in Wellington Harbour, leading
to ocean and beach pollution.
Note that the existing service option with crates is not a full cost service, i.e. users are expected to pay for
their own crates. The use of flexinets to avoid wind-blown litter is voluntary and users are also expected to
pay for their own nets. This approach is relatively ineffective in practice, as some residents use their own
“containers” (such as cardboard boxes). There is little incentive for them to use the flexinets to avoid wind-
blown litter.
Some materials that are collected through Council's recycling service are not recycled. For example, plastic
grades 3-7 are sold as part of bales of mixed plastic (grades 1-7), but processors may then separate and
recycle the grade 1 and 2 plastics and dispose of the grade 3-7 plastics. Working collaboratively with their
contractor, Council needs to ensure that there are appropriate end-markets available for the materials
collected through Council's recycling services so that the community can be assured that materials collected
for recycling are actually recycled. In May 2019 Council ceased collection of plastic grades 3-7 and undertook
an education campaign with customers to ensure plastic grades 3-7 are no longer received through Council’s
recycling service.
There has always been volatility in the recycling commodities market, however the commodity prices are
currently at an all-time low due to the bans imposed by China on many recycling products that have
subsequently been followed by other recycling markets.
3 34 councils in NZ (out of 67) use wheelie bins for recycling. A further six councils are currently looking to change to wheelie bins.
4 Council are planning to undertake a survey of the composition of kerbside refuse and recycling receptacles in September 2019 to
confirm this quantity. Results from a similar audit in Napier-Hastings identified 18% of Napier’s refuse and 10% of Hastings’ refuse
could be diverted.
© Morrison Low
5
 Recycling stations
In addition to the kerbside collection, Council provides community recycling stations at five locations. There
are contamination and significant illegal dumping issues at these stations, which are open 24/7 and are
unstaffed. Some sites such as the station in Naenae have had repeated occurrences of loads being too
contaminated to allow further processing and being re-directed to the landfill. In relative terms, the Seaview
site appears to attract the fewest concerns, likely due to the fact that it is co-located with the Seaview
transfer station (e.g. staffing during the day, cameras, good natural surveillance).
It is possible that at least some of the illegal dumping that is occurring is due to residents not understanding
the waste collection system that is in place (e.g. language barriers), hardship, or lack of willingness to pay for
refuse disposal. However, Council does not have data available to show the exact causes of illegal dumping
behaviours.5
Organics
No kerbside collection service is provided for organics, although customers can pay for a private green waste
collection service.
There is a low rate of diversion of organics waste, with compostable food and green waste accounting for
approximately 45% of domestic refuse.
There is an opportunity to increase diversion of kerbside collected waste by targeting organics, however this
needs to be balanced by the high cost of organics collection services.
In addition, food and green waste breaks down quickly in landfill and can assist in breaking down other
materials, because of the carbon and moisture they introduce. Breaking down quickly, food and green waste
do not take up valuable airspace in the landfill. However, the breakdown of organic waste can cause odour,
increases landfill gas production and the risk of increased fugitive emissions of greenhouse gases such as
methane. While Silverstream has an effective gas recovery system, it cannot necessarily capture all such
emissions (albeit at this point in time, it is not fully clear how the carbon footprint of landfilling at
Silverstream compares to alternative options such as composting).
The issues and opportunities with the current kerbside collection services were identified through the ILM
process which can be seen in Appendix 2. Further details on the Strategic Case including how these issues are
addressed by the strategic objectives can be found in the blue box in the BBC Summary in Appendix 1.
5 Council has undertaken various initiatives such as trialling cameras, increased enforcement and education, but this has not
resulted in a reduction in illegal dumping occurrences. In some cases, Council has identified repeat offenders and infringements
notices do not appear to be effective in stopping such behaviour.
© Morrison Low
6
 Longlist assessment
A longlist of future kerbside collection service delivery options was developed using the BBC five option
dimensions as demonstrated in Figure 2.
The longlist options were assessed against the strategic objectives developed through the ILM process. These
objectives were able to be standardised across the three waste services reviews. The strategic objectives are:
•
to provide services that are cost-effective
•
to provide services that are safe
•
to provide services that reduce greenhouse gas emissions
•
to provide services that customers want and can use appropriately
•
to reduce waste and protect the environment from the harmful effects of waste.
The longlist options were also assessed against critical success factors. These critical success factors are
considered standard practice for BBC analysis:
•
Strategic fit and business needs: alignment with the Waste Management and Minimisation Plan
2017-23 and other relevant plans.
•
Potential value for money: right solution, right time, at the right price.
•
Supplier capacity and capability: is it a sustainable and viable arrangement (external).
•
Potential affordability: manageable within funding constraints.
•
Potential achievability: ability and skills to deliver (internal).
The longlist of options was assessed against the strategic objectives and critical success factors at the options
assessment workshop. Options which did not meet the strategic objectives or critical success factors were
discarded from further analysis.
The following tables provide a summary of the longlist assessment for the refuse collection, recycling
collection, recycling drop-off stations and organics collection options. The longlist of options is provided in
Appendix 3.
© Morrison Low
7
 Table 1
Assessment of refuse collection options
Shortlisted for
Option
Overall assessment
economic case?
Table 1
Assessment of refuse collection options
Shortlisted for
Option
Overall assessment
economic case?
Does not meet strategic objectives but continue to economic
Status quo: bags, collect
assessment for comparison. Not preferred as bags are being
Yes
weekly
phased out in other areas due to safety concerns
Bins, size restricted, collect
Possible – cost-effective and safe but less customer choice
Yes
weekly
Bins, range of sizes, collect
Preferred – cost-effective, safe and provides customer choice
Yes
weekly
Bins with pay-as-you-throw
Possible – cost-effective, customer friendly and safer than bag
Yes
user tags, collect weekly
collections, but added complexity
Bins with pay-as-you-throw
Discard - unknowns associated with RFID for PAYT. Possible
with RFID technology, collect
No6
future option when technology enables.
weekly
Bins (either 1b, 1c, 1d or 1e
methodology), collect
Discard - only feasible if combined with food waste collection
No
fortnightly
Council opts out of refuse
Possible - private sector could provide service but Council may
Yes
collection
retain administrative function
Table 2
Assessment of recycling collection options
Shortlisted for
Option
Overall assessment
economic case?
Does not meet strategic objectives but continue to economic
Status quo: crates, collect
assessment for comparison. Not preferred as crate service
Yes
weekly
generates litter, less safe than bins but better recycling products
2-stream: 45L glass crate and
Possible - crate collection (for glass) less safe than bins, but
240L mixed recycling, collect
Yes
better recycling products
fortnightly
2-stream: 80L glass bin and
240L mixed recycling bin,
Discard - glass bin collections only in trial phase
No
collect fortnightly
240L fully commingled bin,
Discard - lower quality recycling products that cost more to
No
collect fortnightly
process; no current processing capacity in the Wellington region
Kerbside service
Discard - customers expect kerbside service and waste disposal
No
discontinued
would increase
6 Although possible future option
© Morrison Low
8
 Table 3
Assessment of recycling drop-off options
Shortlisted for
Option
Overall assessment
economic case?
Table 3
Assessment of recycling drop-off options
Shortlisted for
Option
Overall assessment
economic case?
Does not meet strategic objectives but continue to economic
Status quo: four council
assessment for comparison. Not preferred as high cost for
recycling stations (plus
Yes
limited diversion and contamination and illegal dumping
private Seaview)
impacting ability to recycle materials collected
Increased network of
Discard - high cost and reduced diversion due to contamination
No
recycling stations
Drop off at strategic,
Preferred - supervision, enforcement and cameras reduce illegal
supervised locations (e.g.
Yes
dumping
RTS, RRC)
Recycling stations
Discard - no outlet for customers' excess recyclables
No
discontinued
Table 4
Assessment of organic collection options
Shortlisted for
Option
Overall assessment
economic case?
Status quo: drop off green
waste at transfer station,
Possible - status quo is cost-effective but alternative landfill
Yes
green waste used as landfill
covers more effective, landfill diversion possible
cover
Drop off green waste,
Possible - diverts green waste from landfill but alternative daily
Yes
composted
cover required
25L Bin for food waste only,
Discard - high cost, requirement to identify food waste
No
collect weekly
processor, carbon benefits would need confirmation
240L bin for food and green
Discard - high cost, requirement to identify food waste
No
waste, collect weekly
processor, carbon benefits would need confirmation
240L bin for green waste,
Discard - additional service to manage, increased cost, however
No
collect monthly
easier to process than food waste
No food or green waste
Discard - community expects green waste service
No
services
© Morrison Low
9
 Shortlisted options
From the longlist assessment, the following options were taken forward for economic assessment. For the
kerbside recycling collection service, a change to a two-stream service was clearly preferred over other
options. For refuse collection, a number of options were shortlisted for more detailed analysis.
Table 5
Summary of shortlisted options
Option Description
Elements common to all options
Option 1: Status quo
• Continuation of refuse bag
• Replacing recycling crates with a two-stream recycling
collection service
collection service using a 240L wheelie bin for mixed
Option 2: Opt out
recyclables and a 45L crate for glass collected fortnightly
• Discontinue Council’s refuse
• Retain current kerbside collection areas
collection service, refuse collection
• Phase out the unstaffed recycling stations, with drop-off only
provided by private sector
being retained at two strategic locations (e.g. at the privately-
run Seaview transfer station and another suitable location)
Option 3: Rates-funded refuse bin
• No kerbside organics collection service introduced at this stage
• Provide all residents with a
• Separate assessment (outside of this report) of the ongoing use
wheelie bin for refuse, funded
of green waste as landfill cover
through a targeted rate
• Continuation of outsourced contracts for kerbside collection
Option 4: PAYT (pay as you throw) refuse
service delivery, with potential collaboration with Upper Hutt
bin
City Council
• Provide all residents with a
• All service delivery changes implemented as part of kerbside
wheelie bin for refuse, but only
collection contract re-tender
charge customers when they use
the service
Economic case – identifying the preferred option
The aim of the economic case is to determine the cost-effectiveness of the shortlisted options from both a
financial and non-financial perspective and identify a preferred option.
This was determined by three separate assessments:
•
Whole of life cost: This takes into consideration the Capex and Opex cost of the service over the
lifetime of the service. A 10-year assessment period has been used to align with LTP funding
envelopes.
•
Net Present Value (NPV): This is an assessment of monetary benefits and cost. Only direct costs have
been considered for this BBC. A typical public sector discount rate of 7% has been used for NPVs.
•
Multi Criteria Analysis: This method identifies and ranks non-monetary benefits and costs using the
following risk areas
– Political: negative media coverage or negative community feedback
– Economic: unexpected cost increases
– Social: risk to public health or working safety
© Morrison Low
10

– Technical: untried technology or process
– Legal: council decisions legally challenged
– Environmental: risk of discharge to environment
The economic case is shown in the red box in the BBC summary in Appendix 1 and the NPV calculations are
provided in Appendix 4. Table 6 below provides a summary of the economic assessment.
Table 6
Summary of economic assessment (Net Present Value and Multi Criteria Assessment)
Option 1: Status
Option 3: Rates-
Option 4: PAYT
Assessment criteria
quo, pre-paid
Option 2: Opt out
funded refuse bin
refuse bin
official bag
Net Present Value
-$18.7 million
-$14.2 million
-$45.7 million
-$13.5 million
Medium risk - no
Political risk -
longer offering
negative media
Low risk -
Medium risk - rates
Low risk - improved
council refuse
coverage or
continuation of
increase may attract
level of service with
service, private
negative community
current service
coverage
bins
service costs may be
feedback
high
Medium risk - long
Medium risk - long
Medium risk - long
Medium risk - long
Economic risk -
term recycling
term recycling
term recycling
term recycling
unexpected cost
commodity prices
commodity prices
commodity prices
commodity prices
increases
unknown
unknown
unknown
unknown
Social risk - risk to
public health or
Medium risk - some
High risk - manual
Medium risk - some
Medium risk - some
worker safety (n.b.
manual handling
handling with crates
manual handling
manual handling
community
with glass crates and
and bags
with glass crates
with glass crates
opposition assessed
removal PAYT tags
under Political)
Technical risk -
Medium risk -
Low risk - approach
Low risk - approach
Low risk - approach
Untried technology
solution not widely
is common in NZ
is common in NZ
is common in NZ
or process
used in NZ
Legal risk - Council
Low risk - unlikely to
Low risk - unlikely to
Low risk - unlikely to
Low risk - unlikely to
decisions legally
be legally challenged
be legally challenged
be legally challenged
be legally challenged
challenged
Medium risk -
Medium risk - rates
Medium risk - more
High risk - no refuse
existing diversion,
funded refuse may
diversion
Environmental risk -
price control to drive
but some illegal
encourage more
anticipated, but
risk of discharge to
diversion and no
dumping associated
disposal, but
some illegal dumping
environment
reduction in illegal
with user-pays
partially decrease
associated with user-
dumping
model
illegal dumping
pays model
© Morrison Low
11
 Service use and tonnes collected
Key information relating to the different options is provided below. This is used throughout the assessment
as part of the comparison of shortlisted options.
Table 7
Refuse and recycling collection service use and tonnes
Service use and tonnes
Refuse Collection
Recycling Collection
Pre-paid
Opt-out
Rates
PAYT
Crates,
2-stream,
Service option
Official Refuse
Refuse
Funded
Refuse Bins
Weekly
Fortnightly
Bag
Service
Refuse Bins
Households
36,000
in Lower Hutt
Participation rate
30%
0%
100%
90%
100%
100%
Presentation rate
90%
n/a
90%
60%
90%
90%
Tonnes per year
1,900
0
20,300
16,300
7,800
8,900
The participation rate is the percentage of households that participate in the service, while the presentation
rate is the number of participating households that use the service in any given week. A 90% presentation
rate is typical in urban areas. For the current pre-paid official refuse bags, 30% of households participate in
the service. This compares with all households participating in recycling services and rates-funded refuse
services. The PAYT participation rate is estimated at 90% to reflect households opting out at service
commencement. The PAYT refuse bin has a 60% presentation rate to reflect that customers will only present
their bin for collection when it is full.
The tonnes collected per year are derived from the different participation and presentation rates. For
recycling this also recognises that residents will recycle more with the larger volume provided with the two-
stream system.
Service costs
The following table compares the operating costs, revenue and cost per household for the different options.
The costs are based on modelling undertaken by Morrison Low using actual household numbers from Lower
Hutt, anticipated tonnage based on proposed service changes, and representative costs for collection vehicle
lease and operation, fuel, staff, bin supply and maintenance and contract overheads. These costs are
representative of actual tendered prices from waste contracts procured throughout New Zealand.
Council’s current contract cost for its pre-paid official refuse bag collection service and recycling crate
collection service are also provided. For both services, the contracts have been in place for over ten years
and, based on Morrison Low’s recent procurement experience, significant cost increases are anticipated for
these services if re-tendered now.
© Morrison Low
12
 Table 8
Comparison of refuse and recycling service costs and revenue
Service cost
Refuse Collection
Recycling Collection
Pre-paid Official Refuse Bag
Opt-out Refuse
Rates Funded
PAYT(1) Refuse
Crates, Weekly
2-stream,
Service option
Service
Refuse Bins
Bins
Fortnightly
Current cost
Future cost
Current cost
Future cost
Collection cost
Table 8
Comparison of refuse and recycling service costs and revenue
Service cost
Refuse Collection
Recycling Collection
Pre-paid Official Refuse Bag
Opt-out Refuse
Rates Funded
PAYT(1) Refuse
Crates, Weekly
2-stream,
Service option
Service
Refuse Bins
Bins
Fortnightly
Current cost
Future cost
Current cost
Future cost
Collection cost
$768,000
$0
$1,935,000
$1,706,000
$2,593,000
$1,833,000
Disposal/processing
$212,000
$0
$2,176,000
$1,741,000
$390,000
$669,000
cost
$1,300,000
Recycling revenue
n/a
n/a
n/a
n/a
-$624,000
-$535,000
Council administration
$98,000
$0
$411,000
$345,000
$236,000
$197,000
cost(2)
Total service cost
$1,078,000
$0
$4,522,000
$3,792,000
$1,300,000
$2,595,000
$2,164,000
PAYT revenue(1)
$942,000
$0
$0
$3,858,000
n/a
n/a
n/a
$400,000
Cost recovery from
surplus from
$136,000(7)
$0
$4,522,000
$0(3)
$1,300,000
$2,595,000
$2,164,000
rates (excl. GST)
bag sales
Annual average cost per
participating household
$130(4)
$285(5)
$144
$234(6)
$40
$82
$69
(incl. GST)
(1) PAYT = pay as you throw or user-pays
(2) Council administration estimated at 10% of collection and processing/disposal costs
(3) Surplus revenue generated not shown here
(4) Average annual cost per participating household is 1 bag x 52 weeks x $2.50/bag.
(5) Based on the average 120L/140L annual service cost for private collectors operating in Hutt City
(6) Based on $4.50 per bin tag for 120L bin
(7) This cost recovery from rates for continuing with bags is based on the assumption that the cost per bag remains at $2.50.
© Morrison Low
13

While the above table shows overall costs and estimated average costs per household, the different options
have different cost effects on individual households, depending on their size. The below table shows the
impact of the different refuse service options for three different household types: small, medium and large.
Pre-paid Official
Opt-out Refuse
Rates Funded Refuse
Service option
PAYT Refuse Bins
Refuse Bag
Service(1)
Bins
$4.62/wk, 80L bin
$2.50 per bag in
$2.19/wk, 80L bin
$4.50 per pick up for
Assumptions
$5.50/wk, 120L bin
Lower Hutt
$2.77/wk, 120L bin
120L bin
$8.50/wk, 240L bin
Household A: One person, 60L of rubbish every three weeks
Estimated annual
$42.50
$58.50
$240
$114
cost
(17 bags)
(pick up four-weekly)
Household B: Three people, 120L of rubbish per week
Estimated annual
$260
$234
$286
$144
cost
(104 bags)
(pick up weekly)
Household C: Five people, 240L of rubbish per week
Estimated annual
$520
$288
$468
$442
cost
(208 bags)
(two 120L bins)
(2 pick ups weekly)
(1) Based on private waste collection charges as at May 2019. These are subject to change as private waste companies adjust
their service charges in response to competition from other service providers including Council.
Refuse collection
Due to the low participation rates, the total cost of the current pre-paid official refuse bag collection service
is significantly lower than refuse bin service options. The participation rates also drive the difference in cost
in delivering the rates-funded refuse bin and the PAYT refuse bin.
PAYT revenue either comes from the sale of pre-paid official refuse bags or from pre-paid refuse bin tags (or
similar technology enabled solution such as RFID7). Any residual costs are funded from rates, with residual
revenue used to fund other Council services.
For the opt out option, there are no Council costs associated with refuse collection. Households can choose
from the available private services.
The cost per household considers both the rates funding and PAYT components of the service.
Recycling collection
Overall the two-stream recycling service has lower service delivery costs than crates. Higher processing costs
and lower recycling revenue are off-set by lower collection costs. All costs are recovered from rates. Note
that continuing with crates is significantly higher cost than at present, this is due to the following key
reasons:
•
Recycling markets are volatile, and the value of recyclables is relatively low at present. This presents
a higher risk, with more uncertainty, for providers, which is expected to be reflected in their tender
prices
•
The option incorporates all costs including Council administration and the cost of crates and nets.
These costs are currently excluded from the targeted rate.
7 RFID = radio frequency identification. While the PAYT RFID option has been ranked as not viable at the moment, this technology
is developing rapidly and could be considered by Council instead of the PAYT option with pre-paid refuse bin tags.
© Morrison Low
14
 The recommended option
Recycling services
The recommended option
Recycling services
For the kerbside recycling collection service, a move to 2-stream recycling will provide a more cost-effective
service compared to retaining the crate-based service option. It will reduce the health and safety risks
associated with kerbside sorting of recyclables. It will also reduce incidences of wind-blown litter and rain
damage. The provision of recycling drop-off stations would be reduced from five to two (as the capacity of
crates to hold recyclables would be a lesser concern), with the new recycling drop-off stations restricted to
locations where drop-off can be supervised when open by existing staff overseeing co-located activities.
No kerbside organics collection services are proposed at this time. This is for two reasons:
•
Further analysis should be carried out by undertaking a full carbon emission comparison between
alternative options, including composting, anaerobic digestion and landfilling at Silverstream where
the gas recovery system appears to be relatively effective.
•
Wellington City is planning a trial of a separate food waste collection service, and it would be useful
to await its results and apply lessons learnt. It is also likely that there are benefits from economies of
scale by cooperating between the councils within the Wellington region on organics processing
facilities and identifying the associated end-markets.
Refuse collection service
The recommended approach is a rates-funded wheelie bin collected weekly for the kerbside refuse collection
service. Different bin sizes to match household needs should be available, with an option to opt-out of the
rates-funded service, and a move to pay as you throw when technology enables. Depending on the
availability of suitable and cost-effective technology, a pay as you throw bin service could be a workable
alternative to a rates-funded service. This could be confirmed via a procurement process for renewal of
Council’s kerbside collection services. The pay as you throw option could be tested in terms of technical
feasibility and costs in comparison to the rates-funded bin.
A summary of each option is set out below.
Status quo: refuse bags
Advantages
This option is principally able to provide cost effective disposal for residents, especially smaller households
that create small volumes of waste. By paying per bag, residents are also incentivised to minimise waste.
In principle, this option would enable Council to continue to make a small surplus from bag sales,
supplementing Council revenue (currently $400,000 per year), albeit this would likely require an increase in
bag costs compared to the present situation. For example, in Porirua bag costs are $2.75 compared to Lower
Hutt’s $2.50 per bag.
Refuse bags are a practical option for rural residents (e.g. Wainuiomata Coast Road) whereby they drop off
bags at a dedicated collection point. Rural roads can be too narrow for trucks and there are safety issues
associated with trucks stopping on high speed roads.
© Morrison Low
15
 Disadvantages
Health and safety concerns would continue in this option. These risks are considered too high for most of the
major waste collection companies in New Zealand, and these companies will not tender for council contracts
that continue refuse bag collection services. In general, the smaller waste companies will still tender for
refuse bag collection services. Their health and safety management systems are typically less mature than
those of the major waste companies. Therefore, they are not well positioned to take on the higher health
and safety risks that they would need to manage with a bag collection service.
Under the current health and safety legislation, Council would have to take on more responsibility for
managing the health and safety risks as the specifier of the collection methodology (i.e. safety in design
principles). Council would be held more accountable should an incident occur with the bag collection service
than it would have if it had followed the wider industry’s position of not supporting bag collection services.
As the bag service is a pay as you throw approach, there is scope for residents to avoid rubbish disposal costs
by illegally dumping waste. Council employs an Environmental Investigations Officer, and there are costs
associated with managing illegally dumped waste. It is possible that at least some of the illegal dumping that
is occurring is due to residents not willing to pay for refuse disposal. Therefore, while the Council bag service
yields $400,000 in revenue, this is not necessarily a net yield and does not account for potential costs
associated with illegal dumping or account for other Council administrative costs.
As a result, for the kerbside refuse collection service, a continuation of the status quo using refuse bags is not
recommended.
The three remaining options are all viable but the cost per household and the level of rates funding varies.
Opt-out
Opting out of refuse collection means rates funding is only required for the recycling collection service as
there is no Council-provided service. Households would contract a private waste company to receive a refuse
collection service (e.g. as is done on the Kapiti Coast). Already 70% of households in Lower Hutt use this
option.
Advantages
Health and Safety incidents are expected to decrease in line with the change to a bin service (private
operators do not offer bag collection).
Disadvantages
Based on current advertised prices for private wheelie bin services, households would pay more for their
refuse collection services. Costs would also increase significantly for those that currently use Council’s bag
collection service – albeit residents do have the option of sharing bins, enabling some to avoid higher costs.
Most private wheelie bin services provide 240L wheelie bins on a weekly basis at a price that is attractive to
customers. The large volume of the bins does not incentivise waste minimisation.
Council currently achieves approximately $400,000 in revenue from its bag service; this revenue source
would no longer be there.
It is possible that this change could also lead to an increase in illegal dumping, as the costs for rubbish
disposal can be avoided in this way.
© Morrison Low
16

In addition, Council would have less control over the refuse collection service both in terms of cost and its
ability to encourage diversion through restricting wheelie bin volume. Once out, Council cannot easily re-
enter the market.
Rates funded bins
Advantages
Health and safety incidents are expected to decrease in line with the change to a bin service.
Universally providing a rates-funded refuse bin is more cost-effective than households receiving a private
wheelie bin service, at least on average.
A range of bin sizes can be offered to match household needs and the cost could be adjusted to reflect
customer choice of bin size. In this way, this option can be relatively cost-effective even for smaller
households. In addition, residents could be offered the option to opt out of the Council service and continue
with their private collection service.
This option could still provide a market space for private service providers, if Council services are limited to
small bin options only such as 80L or 120L. Those wanting larger bins, e.g. 240L, could opt out of the Council
service and use a private service.
This option could result in a reduction in illegal dumping, as households choose to use a service they (or their
landlord) are already paying for and is convenient, because it is provided to them without them having to
make their own arrangements. Therefore, costs associated with managing illegally dumped waste (staff time,
contractor costs, disposal costs) could be reduced, albeit the quantum of avoided costs is unclear as illegal
dumping will continue to occur for other reasons (e.g. commercial illegal dumping).
For rental properties, the provision of a rates-funded refuse collection service would be paid for by the
landlord as part of the property’s rates. Experience in other districts has shown this reduces the instances of
tenants leaving waste on their rental properties, which becomes a cost to the landlord long term. The choice
of bin size and whether to opt out of the service would rest with the landlord, not the tenant.
Disadvantages
While more cost effective for households on average, additional rates funding of $4,500,000 per annum is
required for Council to provide this service. The associated rates increase may be unacceptable to ratepayers
when considered alongside other rate increases. Council would need clear messaging for its communication
with residents to explain that any rates increase would be more cost-effective for an average household.
Households that currently use a private service would be able to cancel this and obtain a cost saving to them
overall.
Very small households (single person, elderly) could see an increase in costs relative to Council’s current bag
service.
Council currently achieves approximately $400,000 in revenue from its bag service; this revenue source
would no longer be there.
If bin collection is not feasible for rural residents (e.g. Wainuiomata Coast Road) then an alternative
collection service would need to be provided, such as rates-funded bags delivered to dedicated collection
points (potentially with bigger 660L bins at the drop-off points).
© Morrison Low
17

There may be opposition from private wheelie bin service providers, particularly smaller local companies
who may see a loss of revenue with the introduction of a Council service. However, under this option
commercial services would continue to be outside the Council collection service, as well as those choosing to
opt out of Council’s service, providing an ongoing market for private waste companies to cater for.
PAYT bins
This option uses a similar funding model to the bag service, except that it uses bins. Households only pay for
bin collection when needed (e.g. by purchasing bin tags or alternatively using RFID technology and invoicing
of costs directly to households). The technology required to link a recorded bin lift to a customer account is
not yet fully established in New Zealand and is the greatest technology barrier to these services being widely
introduced at this time.
PAYT refuse bins off-set rates funding by charging participating households a fee (either per pick up or an
annual fee) for receiving the service. In order to recover sufficient fees to fund the service, Council would
need to charge a similar fee to that currently charged for private wheelie bin services. Rates funding could be
eliminated entirely if the bin lift price is set to fully cover operating costs and customers are willing to pay the
charge.
Advantages
Health and safety incidents are expected to decrease in line with the change to a bin service.
This option incentivises diversion with households only paying for the disposal volume they use.
PAYT refuse bins are more cost-effective for households compared to them receiving a private wheelie bin
service, especially for very small households.
This option could still provide a market space for private service providers who would compete with Council
for services, particularly if Council services are limited to smaller bin options such as a standard 120L bin.
Council currently achieves approximately $400,000 in revenue from its bag service. In principle, this revenue
source could still be retained, subject to costs for bin tags or bin lift being slightly higher than operating
costs.
Disadvantages
From an average household perspective, the cost would be similar to a private collection service.
The technology and administrative requirements to implement PAYT refuse bins are not yet well advanced in
New Zealand, although technology is improving quickly. Depending on the availability of suitable and cost-
effective technology, a pay as you throw bin service could be a workable option. This could be confirmed via
a procurement process.
If bin collection is not feasible for rural residents (e.g. Wainuiomata Coast Road) then an alternative
collection service would need to be provided, such as pre-paid official bags delivered to dedicated collection
points (potentially with bigger 660L bins at the drop-off points).
This option may not result in a reduction in illegal dumping, as households can still avoid the rubbish
collection service. Therefore, associated costs would continue to arise (e.g. staff time, contractor costs,
disposal costs).
© Morrison Low
18
 Financial case
The financial case looks at the overall cost to Council, including the funding required, whether there is any
revenue to offset the funding, and whether the service is affordable overall. The financial case is shown in
the orange box in the BBC summary in Appendix 1.
Rates funding
The overall targeted rate for both the rates-funded recycling service and rates-funded refuse service is
estimated at $213 per household. This combined cost is lower than what households are currently paying
just for a private refuse collection service.
The rates funding required for the recycling collection service, including the two-stream recycling collection
and recycling drop-off stations, is estimated at $2,200,000 per annum or $69 per household. This estimate is
in line with the actual cost per household currently in Porirua City and Dunedin City.
The rates funding required for the universal 120L refuse bin collection service is estimated at $4,500,000 per
annum or $144 per household. This estimate is in line with actual cost per household in Waimakariri District
and Christchurch City.
Bin and crate purchase
The rollout of wheelie bins and crates for the refuse and recycling collection service can either be financed
from capital expenditure or operating expenditure. Generally up-front capital expenditure can be more cost-
effective for Council due to lower borrowing costs. It is also possible for the Council’s collections contractor
to fund the upfront capital cost, with bin capital payback through amortisation over the contract term (this
would move this to a Council operating expenditure). In the latter, Council would own the wheelie bins and
crates at the end of the contract and could pass this ownership onto the next contractor.
Note, for comparison purposes the wheelie bin and crate purchase has been amortised over the contract
term in the financial modelling.
PAYT
The introduction of PAYT, either through bin tags or an RFID-enabled automated system, would introduce
user-pays funding for the refuse collection services, avoiding the requirement for rates funding for this
service.
© Morrison Low
19
 Commercial case
The commercial case is about confirming that appropriate commercial agreements can be put in place to
deliver the services. This includes procurement considerations as well as wider contractual and governance
arrangements, risk-sharing approach and procurement timeframes. The commercial case is shown in the
yellow box in the BBC summary in Appendix 1.
Implementation of any of the shortlisted options will occur through the procurement of a new kerbside
collection service contract. The current contracts expire in September 2019, although work is currently under
way to extend this contract, with a re-tender ahead of this (the recommended extension is to June 2021).
This means there should be sufficient time for the procurement and mobilisation of the new contracts. It is
noted that six to nine months is required for procurement and at least six months is required for the
mobilisation period (with contractors preferring at least nine months) to allow enough time for new vehicles,
bins and crates to be supplied, recruitment of collection vehicle drivers, and the rollout of new bins and
crates prior to the service commencement date. Risk-sharing associated with recycling commodity revenue is
recommended to balance the risk associated with the current volatility in commodity markets.
Options for implementing PAYT can be requested from suppliers through this procurement, from which
Council can decide whether to implement the changes from the start of its new contracts or reconsider its
introduction in future once technology enables.
Management case – the way forward
In order to successfully implement the recommended approach, the following actions are proposed, and a
possible timeline is provided:
•
Consult with community on proposed service changes for refuse collection, recycling collection and
recycling drop-off stations, e.g. through 2020 Annual Plan consultation.
•
Undertake procurement for new kerbside refuse and recycling collection services (run in parallel, but
only released to market after 2020 Annual Plan deliberations complete, i.e. release to market July
2020, awarded December 2020).
•
Inform community of cost of service changes based on procurement outcomes, e.g. through
consultation on 2021-2031 Long Term Plan.
•
Mobilise and roll out new kerbside refuse and recycling collection services (mobilise from January
2021 and commence new services July 2021, at the earliest).
•
Progressively decommission recycling drop-off stations following introduction of new kerbside
recycling collection service (from July 2021 onwards).
At a high level, the following risks have been identified for implementing the preferred option, with these
risks needing to be managed through the project:
•
Community opposition to rates increases associated with a rates-funded refuse collection service,
and kerbside recycling.
•
Private collector opposition to a rates-funded refuse collection service that impacts their market
share.
•
Continued volatility in the recycling commodity markets.
•
Tight procurement timeframes for renewing kerbside collection services.
© Morrison Low
20
 Appendix 1
Better Business Case Summary
Appendix 1
Better Business Case Summary

Summary
Kerbside Col ection Services Business Case
Strategic Case:
Need to invest
Investment Objectives and Case for Change
The current contract for Council's kerbside collection service ends in the third quarter of 2019 albeit work is currently under way to extend this
contract. There is an opportunity to review the services ahead of re-tendering the contracts.
Objective 1
To provide services that are cost effective
A review of Hutt City Council’s refuse bylaw is also currently under way, and could support any service changes.
Status Quo
A user-pays bag refuse collection service provides a price incentive to divert waste. With 30% market
share, the cost of providing the service is covered by the bag sales, but this may not be the case if bag
sales drop. Council's recycling collection costs Council $1.3 million (excl GST) per annum. Refuse
collection costs Council $1.07 per bag sold or approximately $510K (excl GST) per annum
Relevant Investment Benefits The overall suite of Council kerbside services provided is a cost-effective package. Customers are
encouraged to divert waste with the right funding mechanism. Fixed cost are shared across sufficient
Refuse collection
customers to achieve efficiencies from scale
A weekly user-pays bag collection service is provided to both urban residential and commercial customers. Customers can put out as many (or as
Relevant KPIs
Overall service cost within approved budgets
few) bags as they have paid for. Waste companies also provide private refuse wheelie bin services directly to customers (i.e. non-Council service).
Experience throughout New Zealand has shown that customers tend to prefer bins to bags for refuse collection because they are more convenient,
Potential Scope
Changes to Council kerbside collection services and drop-off points are considered as a total package
easier to use, less prone to animal strike and generally less odorous.
from a cost perspective
Constraints and dependencies Refuse and recycling collection contract expires in September 2019. The hilly terrain of the Hutt Valley
In Lower Hutt, residents (that have the ability to pay or willingness) have taken up private wheelie bin services and consequently Council's market
coupled with strong winds and rain impact service delivery
share, although stable, sits at around 30%. The service is currently self-funding and realising a surplus of approximately $400,000 for Council per
Risks
Preferred collection methodology and funding mechanisms do not align (e.g. user pays and refuse
year. However, experience in other parts of New Zealand shows that further reductions in market share (e.g. following key changes in the market)
wheelie bins). Service costs recovered through rates are unacceptable to ratepayers
may result in the service being less cost-effective. To respond to this, Council could increase the price of its rubbish bags to cover the funding
shortfall. However, this may incentivise more customers to move to a wheelie bin service as the cost difference between rubbish bags and a private
Objective 2
To provide services that are safe
wheelie bin narrows.
Status Quo
Council's services include manual collections of bags and crates, which are generally considered higher
risk from a health and safety perspective
Bag collection services have been identified as higher risk from a worker health and safety perspective than bin collection services due to the need
Relevant Investment Benefits Contractor, council staff and the general public are kept safe at all times
to exit the vehicle to complete the collection, manual handling of bags and exposure to sharps.
Relevant KPIs
Zero reportable incidents associated with Council's hazardous waste services
Potential Scope
Health and safety considered as part of service options
Constraints and dependencies Changes to kerbside services must improve health and safety standards and comply with regulatory
Recycling collection
requirements
A weekly kerbside collection service is provided to residential customers only. The service is a kerbside sort of 55L crates.
Throughout New Zealand councils have found that customers prefer wheelie bins for their recycling collection services because the materials are not
Risks
Continuing with bag collection for refuse or crate collection for recycling may not be acceptable to
impacted by wind and rain and the greater capacity enables customers to recycle more.
some contractors due to H&S risks, and may open Council up to undue H&S liability should a serious
incident occur
However, the improved convenience of wheelie bins is balanced by the need for post-collection sorting in a processing facility and the inability to
detect contamination until wheelie bins are lifted.
Recycling crate services have higher worker health and safety risks than wheelie bins due to the need for workers to exit trucks, manually handle
crates, and handle recyclables, including sharps (eg broken glass).
Objective 3
To provide services that reduce greenhouse gas emissions
Some materials that are collected through Council's recycling service are not recycled. For example, plastic grades 3-7.
Status Quo
Transportation emissions associated with weekly refuse and recycling collections plus private refuse
collection vehicles also driving the same streets. Emissions from landfill disposal as well as the
processing of kerbside collected recycling
Relevant Investment Benefits Greenhouse gas emissions are unchanged or reduced as a result of service changes
Recycling stations
In addition to the kerbside collection, Council provides community recycling stations at five locations. There are contamination and significant illegal
dumping issues at these stations, which are open 24/7 and are unstaffed.
Relevant KPIs
Reduce carbon emissions to zero by 2050
Reduce landfill disposal of material with high greenhouse gas generation potential
Potential Scope
Greenhouse
gas em
issions cons
ider
ed as part o
f serv
ice op
tions
Organics
No kerbside collection service is provided for organics, although customers can pay for a private greenwaste collection service.
Constraints and dependencies Changes to kerbside services must reduce or maintain current greenhouse gas emissions
There is a low rate of diversion of organics waste, with compostable food and greenwaste accounting for approximately 45% of domestic refuse.
There is an opportunity to increase diversion of kerbside collected waste by targeting organics, however this needs to be balanced by the high cost
Risks
Changes to services introduce new greenhouse gas emissions not previously considered
of organics collection services and the need to confirm greenhouse gas implications.
Strategic Context
Objective 4
To provide services that customers want and can use appropriately
Council waste minimisation and management is governed by the Waste Minimisation Act (WMA). The purpose of the WMA is to:
Status Quo
Council has received requests from residents for a change to wheelie bins for both refuse and
“encourage waste minimisation and a decrease in waste disposal in order to
recycling, although the level of satisfaction with the current service is relatively high. In the case of
(a) protect the environment from harm: and
refuse, this only applies to the 30% of residents that use the service, with the remaining 70% of
(b) provide environmental, social, economic, and cultural benefits.”
residents opting to use private wheelie bin services
To further it’s aims, the WMA requires councils to promote effective and efficient waste management and minimisation within their district. To
Relevant Investment Benefits Reduced contamination of recycling products. Increased customer satisfaction recorded in Council's
achieve this, all councils are required by the legislation to adopt a Waste Management and Minimisation Plan (WMMP).
annual customer survey
In 2017 the Councils of the Greater Wellington Region, including Hutt City, adopted a new Joint WMMP. The vision for the WMMP is “waste free,
Relevant KPIs
High level of satisfaction with Council's kerbside collection services in Council's annual customer
together – for people, environment and economy”.
satisfaction survey
The WMMP also outlines Council's vision, goals, objectives and targets for waste minimisation and management in the region and include both
regional and Council-specific action plans. As part of the WWMP action plan, HCC has committed to further investigate a number of options of its
Potential Scope
Change in kerbside collection methodology from status quo. Potential introduction of organics
ongoing waste services. The two key actions are:
collection. Potential changes to recycling drop-off points
• C.1: Investigate Options and costs of a two-stream recycling collection, by 2019
• C.2: Investigate the use of wheelie bins for kerbside recycling by 2019
Constraints and dependencies Refuse and recycling collection contract expires in September 2019. The hilly terrain of the Hutt Valley
coupled with strong winds and rain impact service delivery
Further, there are three actions in the WMMP that relate to the above actions, these need to be jointly considered:
• C.3: Investigate methods to prevent recycling from being put in council rubbish bags
Risks
Residents uncertain how to use the new recycling system, may result in increased contamination
• C.4: Provide city wide weekly refuse and recycling collection service plus recycling collection stations
• IN.4: Review effectiveness, number, and positions of community recycling stations. Implement agreed changes (if any).
In additional to the WMA, kerbside collection services are governed by the Local Government Act and the Health and Safety at Work Act.
Objective 5
To reduce waste and protect the environment from the harmful effects of waste
Status Quo
Large quantities of recyclable material and organics that could be diverted are currently being
Hutt City Council has also adopted a carbon reduction goal of carbon zero by 2050 (subject to approval at 11 December 2018 meeting).
landfilled. Material collected as recyclables may be disposed of at the end processor if no market exists
for them
Relevant Investment Benefits Reduction in waste to landfill and improved recycling outcomes. Reduction in contamination of
recycling products
Relevant KPIs
Meet regional WMMP diversion targets
Potential Scope
Change in kerbside collection methodology from status quo. Potential introduction of organics
collection. Potential changes to recycling drop-off points
Constraints and dependencies Refuse and recycling collection contract expires in September 2019. Alignment with the
implementation of regulatory framework change (e.g. solid waste bylaw). The hilly terrain of the Hutt
Valley coupled with strong winds and rain impact service delivery
Risks
Residents uncertain how to use the new recycling system, may result in increased contamination.
Markets not available for some recyclables, resulting in the need to landfill these materials
1
HCC Col ections BBC FINAL 20190807
8/08/2019

Summary
Economic Case:
Financial Case:
Determine Potential Value for Money
Financial Costing for 2-stream recycling
(COSTS ARE INDICATIVE AND FOR COMPARISON ONLY. ACTUAL COSTS WILL DEPEND ON MARKET RESPONSE)
and range of refuse options
Status quo:
Opt out refuse,
Refuse bins,
PAYT refuse bins,
Year One
Total
bags, crates
2-stream recycling
2-stream recycling
2-stream recycling
Appraisal period (years)
10
10
10
10
Capital
0.00
0.00
Expenses ($m)
Capital costs ($m)
0.0
0.0
0.0
0.0
Whole of Life Costs ($m)
-44.2
-27.5
-72.8
-65.5
Refuse $0m to
Refuse $0m to
Operating
$4.5m
$45m
Expenses ($m)
Recycling $2.2m
Recycling $22m
Cost-Benefit Analysis of (monetary benefits and costs at the Public Sector Discount Rate)
Net Present Value of Benefits ($m)
12.4
5.2
5.5
32.6
Refuse $0m to
Refuse $0m to
Total Revenue
$4.5m
$45m
($m)
Recycling $0m
Recycling $0m
Net Present Costs ($m)
-31.1
-19.4
-51.2
-46.1
(rates funded)
(rates funded)
Benefit Cost Ratio
Not calculated
Net Present Value (NPV, $m)
Capital Funding
-18.7
-14.2
-45.7
-13.5
0.00
0.00
Required ($m)
Multi-criteria Analysis (ranking of non-monetary benefits and costs, if any)
Medium risk - no longer
Medium risk - rates
Political risk - negative media coverage or negative
Low risk - continuation of
offering council refuse
increase may attract
Low risk - improved level of
community feedback
current service
service, private service
coverage
service with bins
costs may be high
Operating
Refuse $0m to
Refuse $0m to
Funding
$4.5m
$45m
Required ($m)
Recycling $2.2m
Recycling $22m
Medium risk - long term
Medium risk - long term
Medium risk - long term
Medium risk - long term
Economic risk - unexpected cost increases
recycling commodity prices recycling commodity prices recycling commodity prices recycling commodity prices
unknown
unknown
unknown
unknown
Social risk - risk to public health or worker safety (n.b.
High risk - manual handling Medium risk - some manual Medium risk - some manual Medium risk - some manual
community opposition assessed under Political)
with crates and bags
handling with glass crates
handling with glass crates
handling with glass crates
and removal PAYT tags
Affordability and funding
The overall targeted rate for both the rates-funded
Low risk - approach is
Low risk - approach is
Low risk - approach is
Medium risk - solution not
recycling service and rates-funded refuse service is
Technical risk - Untried technology or process
common in NZ
common in NZ
common in NZ
widely used in NZ
estimated at $213 per household. This combined cost is
lower than what households are currently paying just for
a private refuse collection service.
The rates funding required for the recycling collection
Low risk - unlikely to be
Low risk - unlikely to be
Low risk - unlikely to be
Low risk - unlikely to be
service, including the two-stream recycling collection and
Legal risk - Council decisions legally challenged
legally challenged
legally challenged
legally challenged
legally challenged
recycling drop-off stations, is estimated at $2,200,000 per
annum or $69 per household.
The rates funding required for the universal 120L refuse
Medium risk - existing
High risk - no refuse price Medium risk - rates funded
Medium risk - more
bin collection service is estimated at $4,500,000 per
diversion, but some illegal control to drive diversion refuse may encourage more diversion anticpated, but
Environmental risk - risk of discharge to environment
annum or $144 per household.
dumping assoc. user pays and no reduction in illegal
disposal, but partially
some illegal dumping assoc.
The introduction of PAYT, either through bin tags or an
model
dumping
decrease illegal dumping
user pays model
RFID-enabled automated system, would introduce user-
pays funding for the refuse collection services, avoiding
the requirement for rates funding for this service.
Preferred Option:
The rollout of wheelie bins and crates for the refuse and
recycling collection service can either be financed from
capital expenditure or operating expenditure. Generally
up-front capital expenditure can be more cost-effective
for Council due to lower borrowing costs. It is also
possible for the Council’s collections contractor to fund
The Preferred Option:
the upfront capital cost, with bin capital payback through
Based on this assessment, the recommended approach for kerbside recycling collection is to move to a 2-stream recycling service, providing households with a 240L wheelie bin
amortisation over the contract term (this would move this
for mixed recycling and a 45L crate for glass, both collected fortnightly. Alongside this the provision of recycling drop-off stations should be reduced from five to two, with the new
to a Council operating expenditure). In the latter, Council
recycling drop-off stations restricted to locations where drop-off can be supervised when open. Kerbside recycling and the recycling drop-off stations would continue to be funded
would own the wheelie bins and crates at the end of the
through rates.
contract and could pass this ownership onto the next
contractor.
For the kerbside refuse collection service, the recommended approach is a rates-funded wheelie bin collected weekly, available in different sizes to match household needs, with
an option to opt-out of the rates-funded service, and a move to pay-as-you-throw (PAYT) when technology enables. Depending on the availability of suitable and cost-effective
technology, a PAYT bin service could be a workable alternative to a rates-funded service. This could be confirmed via a procurement process for renewal of Council’s kerbside
collection services. The PAYT option could be tested in terms of technical feasibility and costs in comparison to the rates-funded bin.
A kerbside organics collection service is not proposed at this point in time. Further analysis of carbon emissions from organics services and learnings from Wellington City’s food
waste collection trial will be used to inform a decision on this service at a future time.
Management Case:
Plan for Successful Delivery:
In order to successfully implement the recommended
approach, the following actions are proposed and a
possible timeline is provided:
The recommended options will improve health and safety outcomes, reduce windblown litter and animal strike and divert more waste from landfill. For an average household, a
- Consult with community on proposed service changes
rates-funded service can deliver both a refuse collection and recycling collection service for less cost than a private refuse collection service alone and is therefore more
for refuse collection, recycling collection and recycling
affordable. Offering the option of smaller bin sizes, opting out and a move to PAYT when technology enables, provides a cost-effective option for smaller households and those
drop-off stations
that produce less waste.
- Undertake procurement for new kerbside refuse and
recycling collection services
- Inform community of cost of service changes based on
procurement outcomes
- Mobilise and roll out new kerbside refuse and recycling
collection services
- Progressively decommission recycling drop-off stations
following introduction of new kerbside recycling
Commercial
Case:
collection service
Prepare for the Potential Deal:
Implementation of any of the shortlisted options will occur through the procurement of a new kerbside collection service contract. The current contracts expire in September
At a high level, the following risks have been identified for
2019, albeit work is currently under way to extend this contract (the recommended extension is to June 2021). This means there should be sufficient time for the procurement and
implementing the preferred option, with these risks
mobilisation of the new contracts. It is noted that six to nine months is required for procurement and at least six months is required for the mobilisation period (with contractors
needing to be managed through the project:
preferring at least nine months) to allow enough time for new vehicles, bins and crates to be supplied, recruitment of collection vehicle drivers and the rollout of new bins and
- Community opposition to rates increases
crates prior to the service commencement date. Risk-sharing associated with recycling commodity revenue is recommended to balance the risk associated with the current
- Private collector opposition to a rates-funded refuse
volatility in commodity markets.
col ection service that impacts their market share
Options for implementing PAYT can be requested from suppliers through this procurement, from which Council can decide whether to implement the changes from the start of its
- Continued volatility in the recycling commodity markets
new contracts or reconsider its introduction in future once technology enables.
- Tight procurement timeframes for renewing kerbside
collection services
2
HCC Col ections BBC FINAL 20190807
8/08/2019

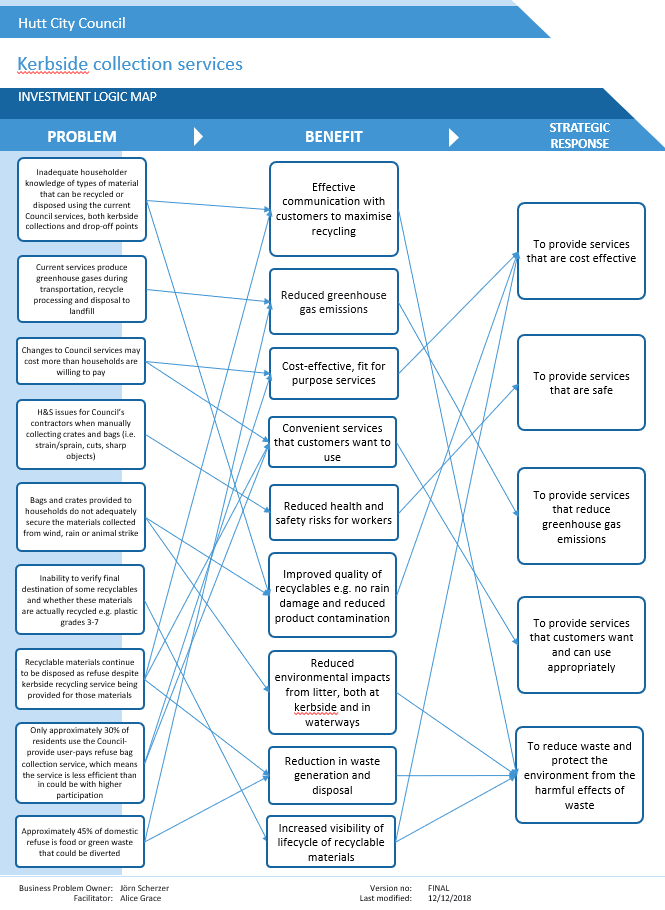 Appendix 2
Investment Logic Map (ILM)
Appendix 2
Investment Logic Map (ILM)
 Appendix 3
Longlist Options Assessment
Appendix 3
Longlist Options Assessment

Long-list
Long-list Options Assessment
Service Solution Options (How)
Scope Options (What)
SS-2: Recycling
SS-1: Refuse
SS-2a: Kerbside
SS-2b: Drop Off
SC-1
SC-2
SC-3
SS-1a
SS-1b
SS-1c
SS-1d
SS-1e
SS-1f
SS-1g
SS-2a(i)
SS-2a(ii)
SS-2a(iii)
SS-2a(iv)
SS-2a(v)
SS-2b(i)
SS-2b(ii)
SS-2b(iii)
Status quo: current
Bins with pay-as-you-
2-stream: 45L glass
2-stream: 80L glass
Status quo: four
collection areas
Extend to schools,
Bins with pay-as-you-
Bins (either 1b, 1c, 1d
240L fully
Drop off at strategic,
Extend to all
Status quo: bags,
Bins, size restricted, Bins, range of sizes,
throw with RFID
Council opts out of
Status quo: crates,
crate and 240L mixed bin and 240L mixed
Kerbside service
council recycling
Increased network of
Description of Option:
(including all
early childhood
throw user tags,
or 1e methodology),
commingled bin,
supervised locations
commercial areas
collect weekly
collect weekly
collect weekly
technology, collect
refuse collection
collect weekly
recycling, collect
recycling bin, collect
discontinued
stations (plus private
recycling stations
residents in
centers and churches
collect weekly
collect fortnightly
collect fortnightly
(e.g. RTS, RRC)
weekly
fortnightly
fortnightly
Seaview)
commercial areas)
Investment Objectives
No - bins less
Partial - bins cost
expensive to collect
Yes - potential
Partial - a range of
Partial - No cost to
Partial - crates more
Partial - bins less
Partial - bins less
Partial - efficiencies
No - high cost of
No - high cost of
Partial - cost may be
Partial - bags cost
less to collect than
Partial - potential
Yes - fortnightly
but more expensive
Yes - cost shared
economies of scale,
Yes - bins cost less
size can potentially
council but residents expensive to collect
expensive to collect
expensive to collect
from a citywide
service for limited
service for limited
To provide services that are cost effective
Yes - cost effective
higher for bespoke
more than bins to
bags but additional
higher costs because collections would cost
to process
with RTS or RRC
albeit overall cost
than bags to collect
create inefficiencies
may pay more for
but less expensive to but more expensive
but more expensive
service (economies
diversion (due to
diversion (due to
solution
collect
cost to manufacture
of RFID technology
less
commingled recycling
costs
increase
for collections
private service
process
to process
to process
of scale)
illegal dumping)
illegal dumping)
and distribute tags
(may need transport
out of region)
Partial - demand for
Partial - servicing
Partial - recycling
Partial - potential
Partial - potential
Partial - bespoke
No - bag collections
Yes - automated bin
Yes - automated bin
Partial - removal of
Yes - automated bin
Yes - automated bin
Partial - crates are
Yes - automated bin
Yes - automated bin
drop-off sites may
Yes - does not impact
schools and early
Yes - no kerbside
crates (for glass) are
exposure to
exposure to
Yes - use of recycling
To provide services that are safe
services adds
are being phased out collections are safer
collections are safer tags requires driver to collections are safer
collections are safer
not as safe as bins to
collections are safer
collections are safer
increase, increasing
safety
childhood centres
collection service
not as safe as bins to
hazardous materials hazardous materials
station supervised
complexity
due to safety
than manual bags
than manual bags
exit truck
than manual bags
than manual bags
collect
than manual crates
than manual crates
H&S management at
adds complexity
collect
illegally dumped
illegally dumped
sites
Yes - even though
Yes - even though
Partial - limited
Partial - more
transport
transport
Yes - transport
Partial - increased
Partial - increased
Yes - no Council
Yes - status quo can
Council influence e.g.
Yes - status quo can
Partial - customers
emissions from
Yes - use of drop off
requirements would
requirements would
Yes - similar to status
Yes - similar to status
Yes - similar to status
Yes - similar to status
Yes - similar to status requirements would
transport emissions
transport emissions
Yes - similar to status transport emissions
To provide services that reduce greenhouse gas emissions
support this (e.g.
electric trucks not
support this (e.g.
could use kerbside
customers driving to
facility while visiting
increse, use of
increse, use of
quo
quo
quo
quo
quo
decrease, also use
from two collection
from two collection
quo emissions
from kerbside
electric trucks)
specified, more
electric trucks)
service alone
stations and haulage
RTS or RRC
electric vehicles
electric vehicles
electric vehicles
runs
runs
collection service
trucks driving routes
of recyclables
could off-set
could off-set
Partial - high
Partial - demand
Partial - Less
Partial - more
Partial - demand not
satisfaction but
Partial - bins are
Partial - bins are
Partial - recycling
Partial - less
Partial - unclear
from people who
Yes - typically
Yes - typically
Yes - typically
Yes - typically
Partial - fortnightly
customer focused as
No - customers
stations may not
Yes - satisfaction with
fully known, although
customers also want
more popular than
more popular than
Yes - bins are more
stations are used but
recycling stations
To provide services that customers want and can use appropriately
demand for
produce low waste
households prefer
households prefer
households prefer
households prefer
collection less
Council has limited
expect kerbside
increase use as
status quo
some schools have
bins (complaints
crates, but require
crates, but require
popular than crates
kerbside service used
available but kerbside
commercial users
volumes but only 30
bins to bags
bins to bags
bins to bags
bins to bags
desirable
control of the
service
customers prefer
enquired
about litter, cant take storage bin and crate
storage two bins
more
service used more
per cent market share
services
kerbside
recyclables)
Partial - Council has
Partial - lower quality
No - high
No - high
Partial - some
Yes - service reduces
Yes - service reduces
Partial - bigger bin
Yes - service reduces
Yes - service reduces
Yes - service reduces limited control of the
Yes - reduces harm
Yes - reduces harm
Yes - reduces harm
No - crate service
Yes - service reduces
Yes - service reduces
recycling products
No - waste disposal
contamination and
contamination and
recycling that does
To reduce waste and protect the environment from the harmful effects of waste
harm and waste with
harm and waste by
options may increase
harm and reduces
harm and reduces
harm and waste by
services (capacity
and waste
and waste
and waste
generates litter
harm and waste
harm and waste
result in less
would increase
limited recycling as a limited recycling as a
take place may no
user pays
restricting volume
waste
waste with PAYT
waste with PAYT
reducing frequency
drives waste
recycling overall
result
result
longer occur
increase)
Critical Success Factors (as these CSFs are crucial (not just desirable) any options that score a 'no' are automatically discounted from further analysis
Partial - some
No - bag collections
Partial - community
Strategic fit and business needs -
Alignment with Waste Mgmt and Min Plan Yes - alignment with
Yes - alignment with
Yes - alignment with
Yes - alignment with
Yes - alignment with
Yes - alignment with
Yes - alignment with
Yes - alignment with
alignment, however
Yes - aligns with
Yes - aligns with
Yes - aligns with
No - contamination
Yes - aligns with
are being phased out
expects a Council
17-23 and other relevant plans
strategic objectives
strategic objectives
strategic objectives
strategic objectives
strategic objectives
strategic objectives
strategic objectives
strategic objectives
some H&S risks with
strategic objectives
strategic objectives
strategic objectives
limiting recycling
strategic objectives
due to safety
service
crates
Partial - bins cost
Yes - fortnightly
less than bags to
Partial - potential
Partial - can
Yes - customer
collections would cost
Partial - No cost to
Partial - status quo
Partial - a bin
Partial - a bin
Partial - higher
Partial - high
Partial - cost may be
Partial - status quo
collect, but fixed
higher costs because
Yes - cost shared
Yes - potential
potentially create
focused and cost
less, but low waste
council but residents
may cost more
collection service
collection service
processing costs due
contamination results
Potential value for money -
right solution, right time at the right price
Yes - cost-effective
higher for bespoke
may cost more with
volume means low
of RFID technology
with RTS or RRC
economies of scale
inefficiencies for
efffective; users only
producers may pay
may pay more for
reflecting supplier
would be higher cost would be higher cost to glass commingled
in high cost to service
solution
limited suppliers
waste producers pay
but users only pay for
costs
collections
pay for volume used
for more volume than
private service
reluctance
than status quo
than status quo
with other recyclables
for limited diversion
for more capacity
volume used
need
than need
Partial - private
No - OJI MRF does
No - the
majority
services common
Partial - majority
Yes - approx 130,000
No - glass bin
not process
Yes - common
Partial - suppliers
Partial - suppliers
suppliers with
Yes - common
Yes - common
No - very limited
Yes - common
service across New
suppliers with
Yes - common
Yes - common
Yes - common to
Not assessed. Does
Not assessed. Does
households receive
collections are
commingled glass,
Supplier capacity and capability -
is it a sustainable arrangement (external)
service across New
may not want to
may not want to
capability and
service across New
service across New
supplier experience
service across New
Zealand
however
capability and
service across New
not meet strategic
service across New
not meet strategic
combine these
collections with this
currently in trial
would need to
Zealand
compete
compete
capacity no longer
Zealand
Zealand
with RFID billing
Zealand
Council would need
capacity reluctant to
Zealand
objectives.
Zealand
objectives.
activities
method in NZ
phase
transport out of
collect bags
to ensure all areas
collect crates only
region for processing
serviced
Partial - status quo
Partial - a bin
Partial - a bin
Partial - a bin
Partial - added rates
Partial - added rates
Partial - status quo
Partial - some
Partial - high
Partial - added rates
Partial - added rates
Yes - option is
Partial - added rates
Yes - no cost of
may cost more
collection service
collection service
collection service
Yes - reduces
Potential affordability -
are there no funding constraints
Yes - no constraints
cost from extending
cost from extending
may cost more with
unknown costs with
contamination
costs
costs
affordable
costs
collection for Council
reflecting increasing would be higher cost would be higher cost would be higher cost
funding required
service
service
limited suppliers
RFID technology
resulting in high cost
supplier reluctance
than status quo
than status quo
than status quo
Partial - added
Partial - residents
Partial - option is
complexity in
Yes - similar
Yes - similar
likely to continue to
Yes - would be
Partial - more
Partial - more
Yes - no change from
Partial - added
achievable
but some
Partial - added billng
Yes - no change from
Yes - similar to status
Yes - similar to status
changing to
Yes - no change from
Yes - less services to
Potential achievability -
ability and skills to deliver (internal)
management to
management to
contact Council
achievable
customers to manage customers to manage
status quo
customer complexity
concerns about bin
complexity
status quo
quo
quo
alternative MRF that
status quo
manage
status quo
status quo
regarding collection
tag theft
processed
service
commingled glass
Summary of Advantages and Disadvantages:
Does not meet
Possible - private
Does not meet
Does not meet
Possible - cost
Possible - crate
Discard - customers
Preferred -
Yes - Important to
strategic objectives
Preferred - cost
Discard - only
sector could provide
strategic objectives
Discard - lower
strategic objectives
Discard - high cost
Discard - limited
Discard - limited
Possible - cost
effective, customer
Discard - unknowns
collection (for glass)
Discard - glass bin
expect kerbside
supervision,
assess status quo
but continue to
effective, safe and
feasible if combined
service but Council
but continue to
quality recycling
but continue to
and reduced
Overall Assessment:
benefit over status
benefit over status
effective and safe but
friendly and safer
associated with RFID
less safe than bins,
collections only in
service and waste
enforcement and
against the other
economic
improves customer
with food waste
may retain
economic
products that cost
economic
diversion due to
quo
quo
less customer choice
than bag collections,
for PAYT
but better recycling
trial phase
disposal would
cameras reduce
options
assessment for
choice
collection
administrative
assessment for
more to process
assessment for
contamination
but added complexity
products
increase
illegal dumping
comparison
function
comparison
comparison
Short-listed options:
Status Quo: refuse bags, crate recycling
SS-1a: Weekly bag collection
SS-2(i): Crates, collected weekly
SS-2b(i): Four recycling stations
Option 1: opt out refuse, 2 stream recycling
SS-1g: Opt out of refuse collection
SC-1: Current Collection Areas
Option 2: refuse bins, 2 stream recycling
SS-1b: Restrict bin size, collect weekly
SS-2a(ii): 45L glass crate, 240L mixed recycling bin, collected alternating weeks
SS-2b(i): Drop off at strategic locations
Option 3: refuse bins with user pays tags, 2 stream recycling
SS-1d: Range bin sizes with PAYT tags, collect weekly
Note, Option 1 usually "do minimum", Option 2 "preferred" and Option 3 "more ambitious"
1
HCC Collections BBC FINAL 20190807
12/08/2019

Long-list
Long-list Options Assessment
Service Solution Options (How)
Service Delivery Options (Who)
SS-2: Recycling
SS-3: Organics
SS-2b: Drop Off
SS-2b(iv)
SS-3a
SS-3b
SS-3c
SS-3d
SS-3e
SS-3f
SD-1
SD-2
SD-3
SD-4
SD-5
SD-6
SD-7
SD-8
SD-9
Status quo: drop off
green waste at
25L Bin for food
240L bin for food and
Status quo: council
CCO/CCTO for waste
Council in partnership Council in partnership No council service,
Recycling stations
Drop off green waste,
240L bin for green
No food or green
Council alone, in-
Shared service with
Regional shared
Regional CCO/CCTO
Description of Option:
transfer station, green
waste only, collect
green waste, collect
alone, out-sourced
services by council
with private sector
with community
service controlled via
discontinued
composted
waste, collect monthly
waste services
house resources
UHCC
service
for waste services
waste used as landfill
weekly
weekly
contracts
alone
e.g. joint venture
sector e.g. a trust
bylaw
cover
Investment Objectives
Partial - cost
Partial - in-house
Partial - Council with
increase for
Partial - high cost to
Partial - high cost to
may cost more due to
Partial - services
Partial - Council has
Yes - no recycling
Partial - less cost
Yes - no cost for
Yes - economies of
Yes - economies of
No - high start up and
No - high start up and
community may cost
To provide services that are cost effective
Yes - cost effective composting and need
deliver food waste
deliver food waste
Yes - cost effective inexperience, need to
may cost more with
limited control of the
station costs
than food waste
service
scale
scale
management cost
management cost
more due to
alternative landfill
collection service
collection service
scale up resources
less Council control
services
inexperience
cover
and systems
No - Council and
Partial - manual
No - Council not
Yes - automated bin
Yes - automated bin
community group not
Partial - Council has
Yes - no recycling
Yes - service is seen
Yes - service is seen collection of 25L bins
Yes - option supports
experienced in
Yes - similar to status
Yes - similar to status
Yes - similar to status
Yes - similar to status
Yes - similar to status
To provide services that are safe
collections seen as
collections seen as
Yes - no services
experienced in
limited control of the
station service
as safe
as safe
is not as safe as bins
this
managing H&S risks
quo
quo
quo
quo
quo
safer service
safer service
managing H&S risks
services
to collect
with services
with services
Yes - reduced
Partial - emission
Partial - emission
Partial - emission
Partial - emission
Partial - emission
Partial - emission
transport emissions
benefit uncertain in
benefit uncertain in
benefit uncertain in
benefit uncertain in
benefit uncertain in
benefit uncertain in
Yes - option can
Yes - option can
Yes - option can
Yes - option can
Yes - option can
Yes - option can
Yes - option can
Yes - option can
Yes - option can
To provide services that reduce greenhouse gas emissions
to use and service
light of effective gas
light of effective gas
light of effective gas
light of effective gas
light of effective gas
light of effective gas
support this
support this
support this
support this
support this
support this
support this
support this
support this
stations
capture
capture
capture
capture
capture
capture
No - no recycling
Partial - Some use of
Partial - Some use of
Yes - services are
Yes - services are
Yes - services are
No - customers
Yes - option supports
Yes - option supports
Yes - option supports
Yes - option supports
Yes - option supports
Yes - option supports
Yes - option supports
Yes - option supports
Yes - option supports
To provide services that customers want and can use appropriately
stations available for drop-off services by
drop-off services by
functionable and
functionable and
functionable and
expect organic waste
this
this
this
this
this
this
this
this
this
excess recyclables
residents
residents
popular
popular
popular
services are available
Partial - increases
Partial - reduces
Yes - reduces waste
Yes - reduces waste
Yes - reduces waste
waste to landfill but
Partial - some
Partial - reduces
waste to landfill but
to landfill, soil cover
to landfill, greenwaste to landfill, greenwaste
some food waste
recycling that does
waste to landfill, but
food waste degrade
Yes - option supports
Yes - option supports
Yes - option supports
Yes - option supports
Yes - option supports
Yes - option supports
Yes - option supports
Yes - option supports
Yes - option supports
To reduce waste and protect the environment from the harmful effects of waste
likely to be more
takes longer to break takes longer to break degrades quickly and
take place may no
more diversion
quickly and does not
this
this
this
this
this
this
this
this
this
effective than
down than food waste down than food waste
does not take up
longer occur
possible
take up landfill space
greenwaste
(wood content)
(wood content)
landfill space long
long term
term
Critical Success Factors (as these CSFs are crucial (not just desirable) any options that score a 'no' are automatically discounted from further analysis
Partial - private
Strategic fit and business needs -
Alignment with Waste Mgmt and Min Plan
Partial - green waste
Yes - aligns with
Yes - aligns with
Yes - aligns with
Yes - aligns with
Yes - aligns with
Yes - aligns with
Yes - aligns with
Yes - aligns with
services may cost
17-23 and other relevant plans
landfilled not diverted
strategic objectives
strategic objectives
strategic objectives
strategic objectives
strategic objectives
strategic objectives
strategic objectives
strategic objectives
more
Partial - cost
increase for
Partial - high cost to
Partial - high cost to
Partial - services
Partial - reduced cost
Partial - less cost
Yes - economies of
Yes - economies of
Potential value for money -
right solution, right time at the right price
Yes - cost effective composting and need
deliver food waste
deliver food waste
Yes - cost effective
may cost more with
for Council, increased
than food waste
scale
scale
alternative landfill
collection service
collection service
less Council control
cost for ratepayer
cover
Yes - common
Partial - collections
Partial - collections
service across New
use common
use common
Not assessed. Does
Zealand and existing
methods but
methods but
Yes - common
Yes - common
Yes - common
Yes - common
Partial - suppliers
Yes - common
Yes - continue status
Not assessed. Does
Not assessed. Does
Not assessed. Does
Not assessed. Does
Not assessed. Does
Supplier capacity and capability -
is it a sustainable arrangement (external)
not meet strategic
compost facilities
processing requires
processing requires
service across New
not meet strategic
service across New
not meet strategic
service across New
service across New
not meet strategic
not meet strategic
may not favour joint
not meet strategic
services across New
quo
objectives.
available, use
site with capacity for site with capacity for
Zealand
objectives.
Zealand
objectives.
Zealand
Zealand
objectives.
objectives.
venture
objectives.
Zealand
alternative cover
large volumes food
large volumes food
materials is common
waste
waste
Partial - cost
increase for
Partial - an organics
Partial - services
Partial - private
No - significant cost
No - significant cost
Yes - possible cost
Yes - possible cost
Potential affordability -
are there no funding constraints
Yes - cost effective composting and need
collection would
Yes - affordable
may cost more with
services may cost
increase for Council increase for Council
savings
savings
alternative landfill
increase costs
less Council control
more
cover
No - more
Partial - more
coordination with
Partial - may require
Yes - reduced council
Yes - no change from
Yes - similar to status
Partial - additional
Partial - additional
Partial - additional
Yes - similar to status
coordination with
shared services and
more Council
Potential achievability -
ability and skills to deliver (internal)
requirement with
status quo
quo
service to manage
service to manage
service to manage
quo
shared services with
complexity with
resources to
bylaw admin only
UHCC
services differing
administer
between the cities
Summary of Advantages and Disadvantages:
Possible - status quo
Discard - high cost,
Discard - high cost,
Discard - additional
Discard - Council
Discard - inhouse
Discard - does not
is cost effective but
Possible - diverts
requirement to
requirement to
service to manage,
Preferred - status
Possible - potential
Discard - insufficient
Discard - insufficient
and community
Discard - reduced
Discard - no outlet
Discard - community
resources not
Discard - potential
warrant effort for all
alternative landfill
green waste from
identify food waste
identify food waste
increased cost,
quo is effective,
cost savings and only
scale to warrant high scale to warrant high
resources not
Council involvement
Overall Assessment:
for customers' excess
expects green waste
experienced and
cost savings but
waste services. Still
covers more
landfill but alternative
processor, carbon
processor, carbon
however easier to
explore collaboration
need coordination
start up and ongoing start up and ongoing
experienced and
may cost customers
recyclables
service
qualified to manage
more coordination
possible for particular
effective, landfill
daily cover required
benefits would need
benefits would need
process than food
in future
with UHCC
management cost
management cost
qualified to manage
more
services
projects
diversion possible
confirmation
confirmation
waste
services
Short-listed options:
Status Quo: refuse bags, crate recycling
SS-2b(i): Four recycling stations
Option 1: opt out refuse, 2 stream recycling
SS-3a: Greenwaste drop-off at transfer station, use as landfill cover
SD-1: Council alone, out-sourced contracts (potential collaboration with UHCC)
Option 2: refuse bins, 2 stream recyc
S lin
S- g
2b(i): Drop off at strategic locations
Option 3: refuse bins with user pays tags, 2 stream recycling
SS-3b: Greenwaste drop-off at transfer station, composted
Note, Option 1 usually "do minimum", Option 2 "preferred" and Option 3 "more ambitious"
2
HCC Collections BBC FINAL 20190807
12/08/2019

Long-list
Long-list Options Assessment
Implementation Options (When)
Funding Options
IM-1
IM-2
IM-3
FU-1
FU-2
FU-3
Status quo: user pays Rates funded refuse, Rates funded but opt-
Methodology changes Defer to next contract
refuse and rates
Description of Option:
All at contract expiry
recycling, and
in for refuse and
during next contract
renewal
funded diversion (e.g.
organics
organics
recycling)
Investment Objectives
Yes - cost effective to
No - increase cost
Partial - can create
Partial - can create
Partial - can create
To provide services that are cost effective
make all changes at
with status quo
inefficiencies if
Yes - cost effective inefficiencies if opt-in
inefficiencies
once
continuing
market share low
low
Yes - option supports
Yes - option supports
No - safety issues
Yes - option supports
Yes - option supports
Yes - option supports
To provide services that are safe
this
this
with status quo
this
this
this
Yes - option can
Yes - option can
No - no reduction
Yes - option can
Yes - option can
Yes - option can
To provide services that reduce greenhouse gas emissions
support this
support this
emissions
support this
support this
support this
Partial - no customer
Yes - option supports
Yes - option supports
No - customers
Yes - status quo
Yes - option supports
To provide services that customers want and can use appropriately
choice of service
this
this
seeking change
supported
this
provider
No - as not
Partial - less
Yes - option supports
Yes - option supports
Yes - option supports
Yes - option supports
To reduce waste and protect the environment from the harmful effects of waste
improvement in waste
diversion if organics
this
this
this
this
reduction
optional
Critical Success Factors (as these CSFs are crucial (not just desirable) any options that score a 'no' are automatically discounted from further analysis
Strategic fit and business needs -
Alignment with Waste Mgmt and Min Plan
Yes - aligns with
Yes - aligns with
Yes - aligns with
Yes - aligns with
Yes - aligns with
17-23 and other relevant plans
strategic objectives
strategic objectives
strategic objectives
strategic objectives
strategic objectives
Partial - can create
Partial - can create
Partial - can create
Potential value for money -
right solution, right time at the right price
Yes - cost effective
inefficiencies if
Yes - cost effective inefficiencies if opt-in
inefficiencies
market share low
low
Partial - user pays
Yes - common
Partial - can create
Yes - common
Partial - limited
Not assessed. Does
common with refuse
Supplier capacity and capability -
is it a sustainable arrangement (external)
service across New
complexity for
not meet strategic
service across New
examples of opt-out
bags untried with
Zealand
suppliers
objectives.
Zealand
in NZ
refuse bin collections
Partial - can create
Partial - can create
Partial - can create
Partial - higher rates
Potential affordability -
are there no funding constraints
Yes - cost effective
inefficiencies if
inefficiencies if opt-in
inefficiencies
cost than status quo
market share low
low
Partial - can create
Partial - opt-in
Yes - would be
Yes - similar to status
Yes - similar to status
Potential achievability -
ability and skills to deliver (internal)
administrative
requires more
achievable
quo
quo
complexity
administration
Summary of Advantages and Disadvantages:
Possible - impact of
Possible - cost
Possible - impact of
Possible - introduces
Discard - changes
Preferred - most cost
the market share on effective but reduces market share on cost,
Overall Assessment:
complexity and
are required short
effective approach
cost, but retains
customer choice of
but retains customer
potentially cost
term
customer choice
supplier
choice
Short-listed options:
Status Quo: refuse bags, crate recycling
FU-1: User pays refuse, rates funded diversion
Option 1: opt out refuse, 2 stream recycling
FU-2: rates funded diversion (no refuse service)
IM-1: All at contract expiry
Option 2: refuse bins, 2 stream recycling
FU-2: rates funded refuse and diversion
Option 3: refuse bins with user pays tags, 2 stream recycling
FU-1: User pays refuse, rates funded diversion
Note, Option 1 usually "do minimum", Option 2 "preferred" and Option 3 "more ambitious"
3
HCC Collections BBC FINAL 20190807
12/08/2019
 Appendix 4
Financial Modelling for Economic Case
Appendix 4
Financial Modelling for Economic Case
 Option
Status Quo: refuse bags, crate recycling
Direct benefits and costs
Option
Status Quo: refuse bags, crate recycling
Direct benefits and costs
Can be readily quantified and attributed to the organisation. Examples of direct benefits include:
ProjectID:
- Maintenance improvements - the asset will be better maintained
Project Name:
Kerbside Collection Services Business Case
- Reduction in repair costs
- Operating improvements - the asset will operate more effectively, or will provide better service.
Discount Rate:
7%
- Revenue generation
Timeframe (yrs):
10
- Improved asset capacity and/or life
Year:
0
1
2
3
4
5
6
7
8
9
10
Discount:
1.00
0.93
0.87
0.82
0.76
0.71
0.67
0.62
0.58
0.54
0.51
Investment Costs (-ve)
Scoping
Concept Design
Costs associated
Detailed Design
with project only.
Construction/Implementation
Consents
Disposal of existing asset
TOTAL
0
-
-
-
-
-
-
-
-
-
-
-
-
-
-
PV TOTAL
0
-
-
-
-
-
-
-
-
-
-
-
Costs
Annual Costs (-ve)
Maintenance Costs
Operating Costs - refuse collections
-980,339
-980,339
-980,339
-980,339
-980,339
-980,339
-980,339
-980,339
-980,339
-980,339
Costs measured
Operating Costs - recycling collections
-2,987,985 -2,987,985 -2,987,985 -2,987,985 -2,987,985 -2,987,985 -2,987,985 -2,987,985 -2,987,985 -2,987,985
against the status
Operating Costs - recycling drop offs
-120,000
-120,000
-120,000
-120,000
-120,000
-120,000
-120,000
-120,000
-120,000
-120,000
quo.
Management Costs - council admin
-334,443
-334,443
-334,443
-334,443
-334,443
-334,443
-334,443
-334,443
-334,443
-334,443
Other
TOTAL
-44,227,662
-
4
- ,422,766
4
- ,422,766
4
- ,422,766
4
- ,422,766
4
- ,422,766
4
- ,422,766
4
- ,422,766
4
- ,422,766
4
- ,422,766
4
- ,422,766
-
-
-
PV TOTAL
-31,063,659
-
4
- ,133,426
3
- ,863,015
3
- ,610,295
3
- ,374,107
3
- ,153,371
2
- ,947,076
2
- ,754,277
2
- ,574,090
2
- ,405,692
2
- ,248,310
Annual Benefits (+ve)
Reduction in Maintenance
Reduction in Operations
All benefits are
Reduction in Capital / Deferred Works
measured against
Residual Value / Increase in asset life
Benefits
372,610
the status quo.
(New DRC at end of analysis period)
Increased Revenue - refuse PAYT
942,334
942,334
942,334
942,334
942,334
942,334
942,334
942,334
942,334
942,334
Increased Revenue - recyclables sales
623,899
623,899
748,678
748,678
898,414
898,414
898,414
898,414
898,414
898,414
TOTAL
17,931,588
-
1
,566,233
1
,566,233
1
,691,012
1
,691,012
1
,840,748
1
,840,748
1
,840,748
1
,840,748
1
,840,748
2
,213,358
-
-
-
PV TOTAL
12,385,269
-
1
,463,769
1
,368,008
1
,380,370
1
,290,065
1
,312,428
1
,226,568
1
,146,325
1
,071,332
1
,001,245
1
,125,159
PV of Net Benefits (NPV)
-18,678,389.9
Benefit Cost Ratio
not calculated
 O ption
Opt out refuse, 2 stream recycling
Di
D re
r ct
c
t b
e
b ne
n fits
t a
s n
a d
n
d co
c st
o s
st
O ption
Opt out refuse, 2 stream recycling
Di
D re
r ct
c
t b
e
b ne
n fits
t a
s n
a d
n
d co
c st
o s
st
Can
Ca b
e re
r ad
a ily quan
a tifie
i d
d a
n
a d att
a r
tt i
r buted
te to th
to e org
r a
g n
a isati
a on. Ex
E amp
a
le
l s
s o
f dire
r ct
c b
t enef
e ifts
ts i ncl
c u
l de:
e
ProjectID:
0
- Ma
M i
a ntenan
a ce
c impro
r veme
e
n
me ts - the as
a set w
t ill be bette
tt r mai
ma ntai
ta n
i ed
e
- Re
R ducti
c on in re
r pai
a r
r co
c sts
Project Name: Kerbside Collection Services
Business Case
- Opera
r ti
a ng
g impro
r veme
e
n
me ts - the as
a set w
t ill opera
r te
a
te more
r effec
e ti
c ve
v ly
l , ,o
r
r will lp
ro
r vid
i e
e b
ette
t r
r serv
r ic
i e
c .
Discount Rate:
7%
- Re
R venue ge
g ner
e a
r ti
a on
o
Timeframe (yrs):
10
- Impro
r ved a
s
a set c
t a
c p
a ac
a i
c ty an
a d/or
r life
Year:
0
1
2
3
4
5
6
7
8
9
10
Discount:
1.00
0.93
0.87
0.82
0.76
0.71
0.67
0.62
0.58
0.54
0.51
Costs
Investment Costs
Costs associated
Scoping
with project only.
Concept Design
Detailed Design
Construction/Implementation
Consents
Disposal of existing asset
TOTAL
0
-
-
-
-
-
-
-
-
-
-
-
-
-
-
-
PV TOTAL
0
-
-
-
-
-
-
-
-
-
-
-
Annual Costs
Costs measured
Maintenance Costs
against the status
Operating Costs - refuse collections
0
0
0
0
0
0
0
0
0
0
Operating Costs - recycling collections
-2,508,086 -2,508,086 -2,508,086 -2,508,086 -2,508,086 -2,508,086 -2,508,086 -2,508,086 -2,508,086 -2,508,086
Operating Costs - recycling drop offs
-120,000
-120,000
-80,000
-80,000
-40,000
-40,000
0
0
0
0
Management Costs - council admin
-197,318
-197,318
-197,318
-197,318
-197,318
-197,318
-197,318
-197,318
-197,318
-197,318
Other
TOTAL
-27,534,043
-
2
- ,825,404
2
- ,825,404
2
- ,785,404
2
- ,785,404
2
- ,745,404
2
- ,745,404
2
- ,705,404
2
- ,705,404
2
- ,705,404
2
- ,705,404
-
-
-
-
PV TOTAL
-19,400,099
-
2
- ,640,565
2
- ,467,818
2
- ,273,720
2
- ,124,972
1
- ,957,435
1
- ,829,379
1
- ,684,790
1
- ,574,570
1
- ,471,561
1
- ,375,290
Benefits
Annual Benefits
All benefits are
Reduction in Maintenance
measured against
Reduction in Operations
Reduction in Capital / Deferred Works
Residual Value / Increase in asset life
909,963
(New DRC at end of analysis period)
Increased Revenue - refuse PAYT
0
0
0
0
0
0
0
0
0
0
Increased Revenue - recyclables sales
534,905
534,905
641,887
641,887
770,264
770,264
770,264
770,264
770,264
770,264
TOTAL
7,885,130
-
5
34,905
5
34,905
6
41,887
6
41,887
7
70,264
7
70,264
7
70,264
7
70,264
7
70,264
1
,680,226
-
-
-
-
PV TOTAL
5,244,325
-
4
99,912
4
67,207
5
23,971
4
89,692
5
49,187
5
13,259
4
79,682
4
48,301
4
18,973
8
54,142
PV of Net
-14,155,773.7
Benefits (NPV)
Benefit Cost
not calculated
Ratio
 Option
Refuse bins, 2 stream recycling
Direct benefits and costs
Option
Refuse bins, 2 stream recycling
Direct benefits and costs
Can be readily quantified and attributed to the organisation. Examples of direct benefits include:
ProjectID:
0
- Maintenance improvements - the asset will be better maintained
Project Name: Kerbside Collection Services Business Case
- Reduction in repair costs
- Operating improvements - the asset will operate more effectively, or will provide better service.
Discount Rate:
7%
- Revenue generation
Timeframe (yrs):
10
- Improved asset capacity and/or life
Year:
0
1
2
3
4
5
6
7
8
9
10
Discount:
1.00
0.93
0.87
0.82
0.76
0.71
0.67
0.62
0.58
0.54
0.51
Investment Costs (-ve)
Scoping
Concept Design
Costs associated
Detailed Design
with project only.
Construction/Implementation
Consents
Disposal of existing asset
TOTAL
0
-
-
-
-
-
-
-
-
-
-
-
-
-
-
-
PV TOTAL
0
-
-
-
-
-
-
-
-
-
-
-
Costs
Annual Costs (-ve)
Maintenance Costs
Operating Costs - refuse collections
-4,117,460 -4,117,460 -4,117,460 -4,117,460 -4,117,460 -4,117,460 -4,117,460 -4,117,460 -4,117,460 -4,117,460
Costs measured
Operating Costs - recycling collections
-2,508,086 -2,508,086 -2,508,086 -2,508,086 -2,508,086 -2,508,086 -2,508,086 -2,508,086 -2,508,086 -2,508,086
against the status
Operating Costs - recycling drop offs
-120,000
-120,000
-80,000
-80,000
-40,000
-40,000
0
0
0
0
quo.
Management Costs - council admin
-609,064
-609,064
-609,064
-609,064
-609,064
-609,064
-609,064
-609,064
-609,064
-609,064
Other
TOTAL
-72,826,100
-
7
- ,354,610
7
- ,354,610
7
- ,314,610
7
- ,314,610
7
- ,274,610
7
- ,274,610
7
- ,234,610
7
- ,234,610
7
- ,234,610
7
- ,234,610
-
-
-
-
PV TOTAL
-51,211,344
-
6
- ,873,467
6
- ,423,801
5
- ,970,901
5
- ,580,281
5
- ,186,696
4
- ,847,380
4
- ,505,352
4
- ,210,609
3
- ,935,149
3
- ,677,709
Annual Benefits (+ve)
Reduction in Maintenance
Reduction in Operations
All benefits are
Reduction in Capital / Deferred Works
measured against
Residual Value / Increase in asset life
Benefits
1,459,390
the status quo.
(New DRC at end of analysis period)
Increased Revenue - refuse PAYT
0
0
0
0
0
0
0
0
0
0
Increased Revenue - recyclables sales
534,905
534,905
641,887
641,887
770,264
770,264
770,264
770,264
770,264
770,264
TOTAL
8,434,557
-
5
34,905
5
34,905
6
41,887
6
41,887
7
70,264
7
70,264
7
70,264
7
70,264
7
70,264
2
,229,654
-
-
-
-
PV TOTAL
5,523,626
-
4
99,912
4
67,207
5
23,971
4
89,692
5
49,187
5
13,259
4
79,682
4
48,301
4
18,973
1
,133,443
PV of Net Benefits (NPV)
-45,687,717.9
Benefit Cost Ratio
not calculated
 Option
Refuse bins with user pays tags, 2 stream recycling Direct benefits and costs
Option
Refuse bins with user pays tags, 2 stream recycling Direct benefits and costs
Can be readily quantified and attributed to the organisation. Examples of direct benefits include:
ProjectID:
0
- Maintenance improvements - the asset will be better maintained
- Reduction in repair costs
Project Name: Kerbside Collection Services Business Case
- Operating improvements - the asset will operate more effectively, or will provide better service.
Discount Rate:
7%
- Revenue generation
Timeframe (yrs):
10
- Improved asset capacity and/or life
Year:
0
1
2
3
4
5
6
7
8
9
10
Discount:
1.00
0.93
0.87
0.82
0.76
0.71
0.67
0.62
0.58
0.54
0.51
Investment Costs (-ve)
Scoping
Concept Design
Costs associated
Detailed Design
with project only.
Construction/Implementation
Consents
Disposal of existing asset
TOTAL
0
-
-
-
-
-
-
-
-
-
-
-
-
-
-
-
PV TOTAL
0
-
-
-
-
-
-
-
-
-
-
-
Costs
Annual Costs (-ve)
Maintenance Costs
Operating Costs - refuse collections
-3,451,902 -3,451,902 -3,451,902 -3,451,902 -3,451,902 -3,451,902 -3,451,902 -3,451,902 -3,451,902 -3,451,902
Costs measured
Operating Costs - recycling collections
-2,508,086 -2,508,086 -2,508,086 -2,508,086 -2,508,086 -2,508,086 -2,508,086 -2,508,086 -2,508,086 -2,508,086
against the status
Operating Costs - recycling drop offs
-120,000
-120,000
-80,000
-80,000
-40,000
-40,000
0
0
0
0
quo.
Management Costs - council admin
-542,508
-542,508
-542,508
-542,508
-542,508
-542,508
-542,508
-542,508
-542,508
-542,508
Other
TOTAL
-65,504,970
-
6
- ,622,497
6
- ,622,497
6
- ,582,497
6
- ,582,497
6
- ,542,497
6
- ,542,497
6
- ,502,497
6
- ,502,497
6
- ,502,497
6
- ,502,497
-
-
-
-
PV TOTAL
-46,069,289
-
6
- ,189,250
5
- ,784,345
5
- ,373,278
5
- ,021,755
4
- ,664,710
4
- ,359,542
4
- ,049,428
3
- ,784,512
3
- ,536,928
3
- ,305,540
Annual Benefits (+ve)
Reduction in Maintenance
Reduction in Operations
All benefits are
Reduction in Capital / Deferred Works
measured against
Residual Value / Increase in asset life
Benefits
1,404,448
the status quo.
(New DRC at end of analysis period)
Increased Revenue - refuse PAYT
3,858,383
3,858,383
3,858,383
3,858,383
3,858,383
3,858,383
3,858,383
3,858,383
3,858,383
3,858,383
Increased Revenue - recyclables sales
534,905
534,905
641,887
641,887
770,264
770,264
770,264
770,264
770,264
770,264
TOTAL
46,963,442
-
4
,393,288
4
,393,288
4
,500,269
4
,500,269
4
,628,647
4
,628,647
4
,628,647
4
,628,647
4
,628,647
6
,033,094
-
-
-
-
PV TOTAL
32,595,362
-
4
,105,877
3
,837,268
3
,673,560
3
,433,234
3
,300,161
3
,084,263
2
,882,488
2
,693,914
2
,517,677
3
,066,919
PV of Net Benefits (NPV)
-13,473,926.9
Benefit Cost Ratio
not calculated
 Appendix 5
Hutt City Council Terms of Reference
Appendix 5
Hutt City Council Terms of Reference
 TERMS OF REFERENCE – “Kerbside collection review”
Project Title
TERMS OF REFERENCE – “Kerbside collection review”
Project Title
Kerbside collection review
Version
1.3
Project
-
To develop a business case for identifying a preferred option for kerbside
Definition
collection of recycling and waste, for implementation from mid-2019
Background
-
Under the Waste Management and Minimisation Plan (WMMP) 2017-23,
Hutt City Council has committed to two key actions:
o
C.1: Investigate Options and costs of a two-stream recycling
collection, by 2019, and
o
C.2: Investigate the use of wheelie bins for kerbside recycling by
2019.
-
There are three actions in the WMMP that relate to the above actions
(changes to the above may impact on these, or they may have to be
considered as part of review of the waste management system):
o
C.3: Investigate methods to prevent recycling from being put in
council rubbish bags (effectively this is looking at how to improve
current recycling rates)
o
C.4: Provide city wide weekly refuse and recycling collection
service plus recycling collection stations (albeit this is subject to
periodic reviews, such as the one proposed here).
o
IN.4: Review effectiveness, number, and positions of community
recycling stations. Implement agreed changes (if any).
-
In parallel, the contract for Hutt City Council’s recycling kerbside collection
service is coming up for re-tender in the third quarter of 2019.
-
In line with these actions, and the timing constraint of re-tendering our
kerbside collection service contract, a business case is required to inform
decisions by the Council on the preferred option for kerbside recycling and
waste collection in the future.
Objectives
-
A business case for a preferred option for kerbside collection, including a
cost-benefit analysis of the various options identified
Desired
-
Key outcome: certainty about the costs and benefits of various kerbside
Outcomes
collection options
-
To inform a decision by the Hutt City Council on the preferred option for
kerbside collection
-
Implementation of that decision in a follow-up project (eg tender of
preferred model, and selection of a preferred provider for kerbside
collection services in Lower Hutt – depending on the preferred approach
selected)
Scope
The review/analysis should cover the following issues:
-
A description of the waste and recycling market for different types of
recyclables and waste materials such as organics (eg the value of
recyclables in the waste stream, recyclability, markets for those materials
such as Type 1 plastics going to ‘Flight Plastics’ in Lower Hutt), and

analysis on the issue of certain markets for recyclables reducing as a result
of policy changes in China
-
A description of how the current residential waste system operates in
Lower Hutt, and relevant advantages and disadvantages (eg wind-blown
litter as a result of open crates), including volumes and the recycling
percentage of total waste
-
A description of other systems, and relevant lessons learnt in other council,
including benchmarking Hutt City Council’s current system against what
other councils are doing in this regard (eg Christchurch City Council),
including greenhouse gas emissions performance
-
Identification and description of all available options for kerbside waste and
recycling collection, including status quo (eg fully private vs current mixed
vs fully council controlled but tendered out), and types of separation (eg co-
mingled vs separated into glass and plastics; the analysis for each option
should identify all pros and cons, eg based on experience in other councils
-
The analysis should consider the benefits and costs of a separate organics
collection, including the experience of councils that already have separate
organics collection: food waste only (Auckland model) or food waste and
green waste (Christchurch model). The analysis should consider the
associated greenhouse gas footprint vs the current approach of landfill with
methane capture and electricity production
-
Analysis should consider the issue of some users not requiring weekly
kerbside collection (eg bags get put out every few weeks because of little
waste creation), including the options and role of pay-as-you-throw wheelie
bin systems (this could also include considering recent experience in
Auckland where payment tokens were stolen)
-
Potentially a survey of actual consumer costs of council-provided and
private-provided services, including bin vs bag collection
-
Potentially a survey of, or selected consultation with, residents on their
views on what sort of recycling system they would like or be prepared to
pay for, what are the public’s expectations; the business case should take
into account public expectations regarding recycling
-
A cost-benefit analysis and/or multi criteria analysis of the various options,
including a greenhouse gas emission assessment of the various options
-
Where possible, the CBA should be based on established best practice
(e.g. Treasury’s Better Business Case approach)
-
Review should include sensitivity analysis based on different scenarios
and/or assumptions.
-
Analysis should consider the role of local recycling drop off stations. Do
they have a role in a revised system? (There are currently five stations, all
of which are experiencing instances of illegal dumping and cross-
contamination. One is currently in the process of being closed down due to
these problems.)
-
Assessment of whether a potential Resource Recovery Centre could affect
the kerbside collection approach in any way (eg organics processing)?
What are the potential implications due to a future container deposit
scheme as is currently being considered by central government?
-
How can risks be managed, such as the occurrence of different providers
collecting wastes/recyclables on different days, thereby making local
streets less attractive due to litter bins being outside several days of the
week
 Exclusions
-
A cost-benefit analysis of related items such as resource recovery centre is
outside the scope
Who will
-
The Lower Hutt community will benefit from a more efficient and cost
benefit from
effective service, with a potential increase in the diversion of recyclable
the project
waste and a reduction in greenhouse gas emissions
Assumptions
-
The Hutt City Council kerbside collection contract needs to be re-tendered
and
before third quarter of 2019
constraints
HCC contact /
-
Joern Scherzer (Manager Sustainability and Resilience) or delegated staff
project lead
member in the Sustainability and Resilience team
Major
-
Review: September 2018 to February 2019
Milestones
-
Business case complete: February 2019
-
Decision on preferred approach: mid-2019
-
Procurement of provider under new kerbside contract: mid-to-late 2019
-
Implementation of new model: from late 2019
link to page 41
 Appendix 6
Health and Safety of Manual and Automated Collections
Introduction
Appendix 6
Health and Safety of Manual and Automated Collections
Introduction
Options under consideration for HCC’s kerbside refuse and recycling collection services include both manual
and automated collection methodologies. This paper presents an assessment of the health and safety risks
associated with different refuse and recycling collection services as shown in
Table 1.
Table 1
Refuse and recycling collection services
Collection service
Collection type
Current or proposed
Recycling
Recycling crate collection in Wanaka
Manual crate
Current
Two stream recycling with mixed recycling bin and
Automated bin +
Proposed
colour sorted glass crate
manual crate
Refuse
Bag collection
Manual
Current
Bin collection
Automated bin
Proposed
Health and safety considerations are consistent across different types of household waste, e.g. applying to
both refuse and recycling, and essentially compare risks between manual and automated collection and
between bin and bag options.
Data review
In 2008 Research New Zealand undertook a causation study of injuries in the waste sector, utilising data
provided by the country’s four largest waste operators. Together these companies represented around 75%
of the waste industry workforce and provided both manual (i.e. bag and crate services) and automated (i.e.
MGB) collection methodologies. 8
In 2010 Morrison Low drew upon that data to prepare a Position Report on behalf of the Waste
Management Institute New Zealand (WasteMINZ) Health and Safety Sector Group9. Table 2 presents data
summarised within that Position Report.
8 Research New Zealand, September 2008 “
Solid Waste and Recoverable Resources Industry Injury Causation study (#3726)” study
prepared for ACC Injury Prevention
9 Morrison Low, Updated Final 29 March 2012
“An assessment of the health and safety costs and benefits of manual vs automated
waste collections”, Position Report prepared for WasteMINZ Health and Safety Sector Group (draws upon data compiled by
Research New Zealand for their 2008 report titled “
Solid Waste and Recoverable Resources Industry Injury Causation study
(#3726)”)
link to page 42
 Table 2
Total fatalities and Injuries per collection method (based on 2007 national data)
Automated
Non-automated
Loose
Bag collection
Category
Total
bin collection
bin collection
collection
injuries
injuries
injuries*
injuries**
Total fatalities and injuries
Table 2
Total fatalities and Injuries per collection method (based on 2007 national data)
Automated
Non-automated
Loose
Bag collection
Category
Total
bin collection
bin collection
collection
injuries
injuries
injuries*
injuries**
Total fatalities and injuries
744
37
270
129
308
Fatality
1****
0
1
0
0
Serious Harm Incidents (SHI)***
13
2
4
4
3
Lost Time injury – non-SHI
50
6
18
4
22
Medical treatment only injury
375
19
136
65
155
First Aid treatment only
305
10
111
56
128
*
Refers to recycling crates
**
Refers to inorganic waste collection as well as separate paper, cardboard and green waste collection
***
Serious Harm Incidents are assumed to also result in lost time. Therefore, total Lost Time injuries is 13 + 50 = 63 Lost Time
injuries for 2007
**** ACC coded this fatality as a motor vehicle accident; however it was coded by the company as being an injury from manual
waste collections
Of the total injuries, loose collection methods resulted in the most non-fatal injuries at 41%, followed by bag
collections at 36%, then non-automated bin collections 17% and automated bin collections (5%) of all non-
fatal injuries. When broken down by collection method the first aid treatment injuries for loose collection
incidents accounted for 17%, bag collection for 15%, non-automated bin collection for 8%, and automated
bin collection for 1%.
For manual collection of loose materials and refuse bags, around half of the injuries were classified as strains
or sprains, around 30% were lacerations/cuts and around 10% were bruising injuries. For automated bin (side
arm) collection injuries, 51% were classified as strains or sprains, 22% as lacerations/cuts and 24% were
bruising. For non-automated bin collection injuries, 35% were classified as strains or sprains, 27% as
lacerations/cuts and 26% were bruising.
It is to be expected that bin collections would lead to a reduction in lacerations/cuts, due to reduced
exposure to sharp materials compared to bagged or loose waste. In terms of injury type, automated bin
collection appears to result in less bruising injuries than manual bin collection but comparatively more
strain/sprain injuries.
Proportion of injuries by collection method
Research New Zealand’s study analysed the proportion of injuries per collection method, reproduced within
Table 3.
Table 3
Overall usage of each method
Collection Method
Usage of this method (%)
Total injuries for this method (%)
Automated bin
46
5
Bag
32
36
Non-automated bin
13
17
Loose materials
9
41
Total
100
100

Automated bin collection accounted for 46% of all collections yet only accounted for 5% of the injuries.
(Manual) bag collection was the second most common collection method with 32% of the collections
resulting in 36% of the total injuries sustained.
Overall, the Position Report concluded that:
“The major finding was that overall, when the frequency of injuries sustained in the waste industry
was examined by the number of hours worked; employees using automated bin collection methods
are much less likely to suffer an injury.”
Potential severity of injuries
The fatality noted in Table 1 referred to the death of a refuse manual collection runner in 2007. Since 2010
there have been four workplace fatalities associated with Council waste collections.
In December 2017 a Waikato refuse collector died in Tuakau, with early reports being “It appeared (th)at a
rubbish collection worker had fallen from a rubbish truck and died after being run over”.10 Due to the recent
nature of this fatality, Worksafe’s investigation has not yet been concluded.
In May 2017 a Gisborne girl died on her way home from school after being hit by a council refuse collection
truck. Due to the recent nature of this fatality, Worksafe’s investigation has not yet been concluded.11
In August 2015 a collection runner died in Auckland when the brakes on the refuse truck failed, causing the
truck to roll off the road and crush the young worker. This fatality led to the prosecution of Auckland Council,
its refuse collection contractor, the truck owner, and the vehicle maintenance service provider – all
considered to have failed to take all practical steps to ensure that that collection workers were not harmed.12
In March 2015 a recycling collector died in Wellington when he became trapped between the bin lifter and
the centre pod of his truck as he collected recycling. This fatality led to the prosecution of EnviroWaste, the
Council’s recycling collection contractor. 13 EnviroWaste have modified their glass collection vehicles as a
result of this incident.
Recent Auckland Council experience
In 2017, Auckland Council changed the kerbside refuse collection service in the Manukau area from bags to
bins. This service change was made mid-contract and therefore the same workers were undertaking the new
bin collection service as those that had been completing the bag collection service. Auckland Council’s press
release at the time stated:
“From a health and safety perspective it’s also very positive. In the last three years more than 80
Auckland rubbish collectors have been injured on the job due to dangerous items thrown away by
residents in rubbish bags. With the move from bags to bins this risk disappears."14
Since the introduction of the service, the anticipated reduction in injuries has been realised.
10 Weblink: http://www.nzherald.co.nz/nz/news/article.cfm?c_id=1&objectid=11959709
11 Weblink: https://www.stuff.co.nz/national/92165266/gisborne-girl-7-killed-by-rubbish-collection-truck-on-way-home-from-
school
12 Weblink: https://www.stuff.co.nz/business/97867792/truck-company-fined-110000-over-death-of-auckland-teen-jane-
devonshire
13 Weblink: https://www.stuff.co.nz/business/78241059/enviro-waste-missed-many-opportunities-to-spot-danger-which-killed-
20yearold
14 https://ourauckland.aucklandcouncil.govt.nz/articles/news/2017/02/manukau-and-howick-residents-get-to-bin-the-bags/
 Summary
In summary, the following conclusions are drawn with respect to the assessment of the health and safety
risks associated with kerbside collection services.
• Bag collections carry a greater risk of injury than non-automated bin collection (including crates),
while automated bin-collection is the least risk option.
• Not only are employees using automated bin collection methods much less likely to suffer an injury
than those using manual collection methods, the potential severity of worker injuries are higher for
manual collection.