From:
Amy Kearse
To:
at.govt.nz
s 9(2)
Cc:
Claire Pascoe; Delaney Myers
s 9(2)
Subject:
FW: One network framework PT classifications [feedback sought by Waka Kotahi by 19 February]
Date:
Friday, 19 March 2021 3:43:00 PM
Attachments:
image001 png
image004 png
Public Transport section of ONF Detailed Design.pdf
Kia ora Pete
Thank you for taking the time to provide feedback on the ONF PT classifications – it was very helpful and useful for us to
consider how the ONF may apply in an Auckland context.
I have attached the final PT classifications, and in the table below responded to your specific comments.
More generally, the Waka Kotahi Board has now endorsed the ONF. Following extensive feedback on the detailed ONF
classification, REG will be publishing the detailed design for movement and place classification by the end of March This
includes the section on public transport. Online materials will be updated early April to include case studies and other
guidance material. The focus for the next three months (April to June), is for RCAs to reclassify their curren networks to
align with the street families. RCAs won’t be required to classify their public transport networks at this stage
Although the detailed design will be published, there will continue to be opportunity to refine this design, particularly to align
with the RPTP guidance when that is complete. The ONF project team is very keen to work with you so frameworks are
connected. Successfully embedding the ONF will deliver on the expectations set out though a number of national initiatives,
including Road to Zero. REG is working with the sector to look for early adopters and engagement opportunities. If you wish
to get in touch with the project team to discuss the implementation and/or engagement opportunities, please email:
[email address].
Once again, thank you for taking the time to comment on the ONF PT classifica ions.
s 9(2) please note, I will send a separate email to you for distribution to the TSIG PT group.)
Ngā mihi nui,
Amy
Comment
Respo se
Change
If we could include reference to
ferry in Auckland as part
Yes, agree we have adjusted the classifications to include ferries
Amended to include
of this review, it would certainly help the cause for
too.
ferries.
investment and also allow for a level-playing field across
modes. It also supports and justifies the title of the
document ‘One Network Framework’.
The emphasis needs to be on span (at least 7 ho rs a
The ONF is not intended to replace RPTPs. Councils can still retain
No change.
day, 7 days a week) with peak services at least 15 minutes
their own classification systems that provide more service provision
and all-day at least 30 minutes.
details like operating hours and different measures of frequency
This should be based on the RPTP asp rations not the
etc.
actual operations where it is an xe
service like
Devonport.
We recommend further classification is left to local jurisidcations to
Note that Devonport fe ry service becomes part of the
decide if they’d like to add these parameters for local classifications.
RTN under the Auckla d RPTP.
It is untenable for smaller ciites to meet Auckland’s RPTP
classification system.
under the Official Information Act 1982
Note, the ONF team had previously discussed using a more
traditional frequency classification as it is so fundamental to PT
planning but in the end it was decided not to as the ONF is intended
to classify what is happening at a point on a street rather than a full
PT service/route.
Based on the definition in slide 2, I understand that PT1
Slide 2 presented background commentary rather than a definition.
Note text referred to
dedicated means -
By design, they are able to cater for an
The text won’t be included in the ONF as published.
is not included in
increasing frequency and capacity of public transport
ONF.
service.
The changes we have made to the strategic significance description
I am thinking this is why we have all rail (low and high
aims to better align with the GPS and NPS-UD definitions of rapid
frequency/capacity) in the same bucket of ‘PT1
transit.
Released
dedicated’? If so, might need to modify the description of
this category in slide 3 under ‘Strategic Significance’.
The other point I would make on the document is that no
We are not intending to provide this level of detail through the ONF
No change.
minimum frequency is given as part of the rapid transit
at this point in time.
service definition.
We [AT] define this as every 15 mins or better (currently)
Councils can still retain their own classification systems that provide
18hrs a day, 7 days a week – increasing to every 10 mins
more service provision details like operating hours and different
by 2028. See below extract from Auckland’s RPTP.
measures of frequency etc.
 Subject:
 RE: One network framework PT classifications [feedback sought by Waka Kotahi by 19 February]
Hi Amy
Thank you for the opportunity to comment. Please see some comments below from AT.
General
If we could include reference to
ferry in Auckland as part of this review, it would certainly help the cause for investment and
also allow for a level-playing field across modes. It also supports and justifies the title of the document ‘One Network
Framework’.
The emphasis needs to be on span (at least 17 hours a day, 7 days a week) with peak services at least 15 minutes and all-day
at least 30 minutes. This should be based on the RPTP aspirations not the actual operations where it is an exempt service like
Devonport. Note that Devonport ferry service becomes part of the RTN under the Auckland RPTP
The four service which eventually could meet this definition are:
Hobsonville,
Devonport,
Waiheke,
Pine Harbour
I daresay the Ferry issue primarily applies to Auckland, although Eastbourne ferry in Wellington could get there. There may
be a slightly different process for ferry as there are not stops on the route like train and bus (generally).
Slide 2
Based on the definition in slide 2, I understand that PT1 dedicated means -
By design, they are able to cater for an increasing
frequency and capacity of public transport service. I am thinking thi is why we have all rail (low and high frequency/capacity)
in the same bucket of ‘PT1 dedicated’? If so, might need to modify the description of this category in slide 3 under ‘Strategic
Significance’.
Slide 3 – PT 1 – Strategic Significance
The other point I would make on the document is that no minimum frequency is given as part of the rapid transit service
definition. We define this as every 15 min or better (currently) 18hrs a day, 7 days a week – increasing to every 10 mins by
2028. See below extract from Auckla d s RPTP. “Frequency is Freedom” and we need to get away from focussing purely on
the peak.
under the Official Information Act 1982
Released
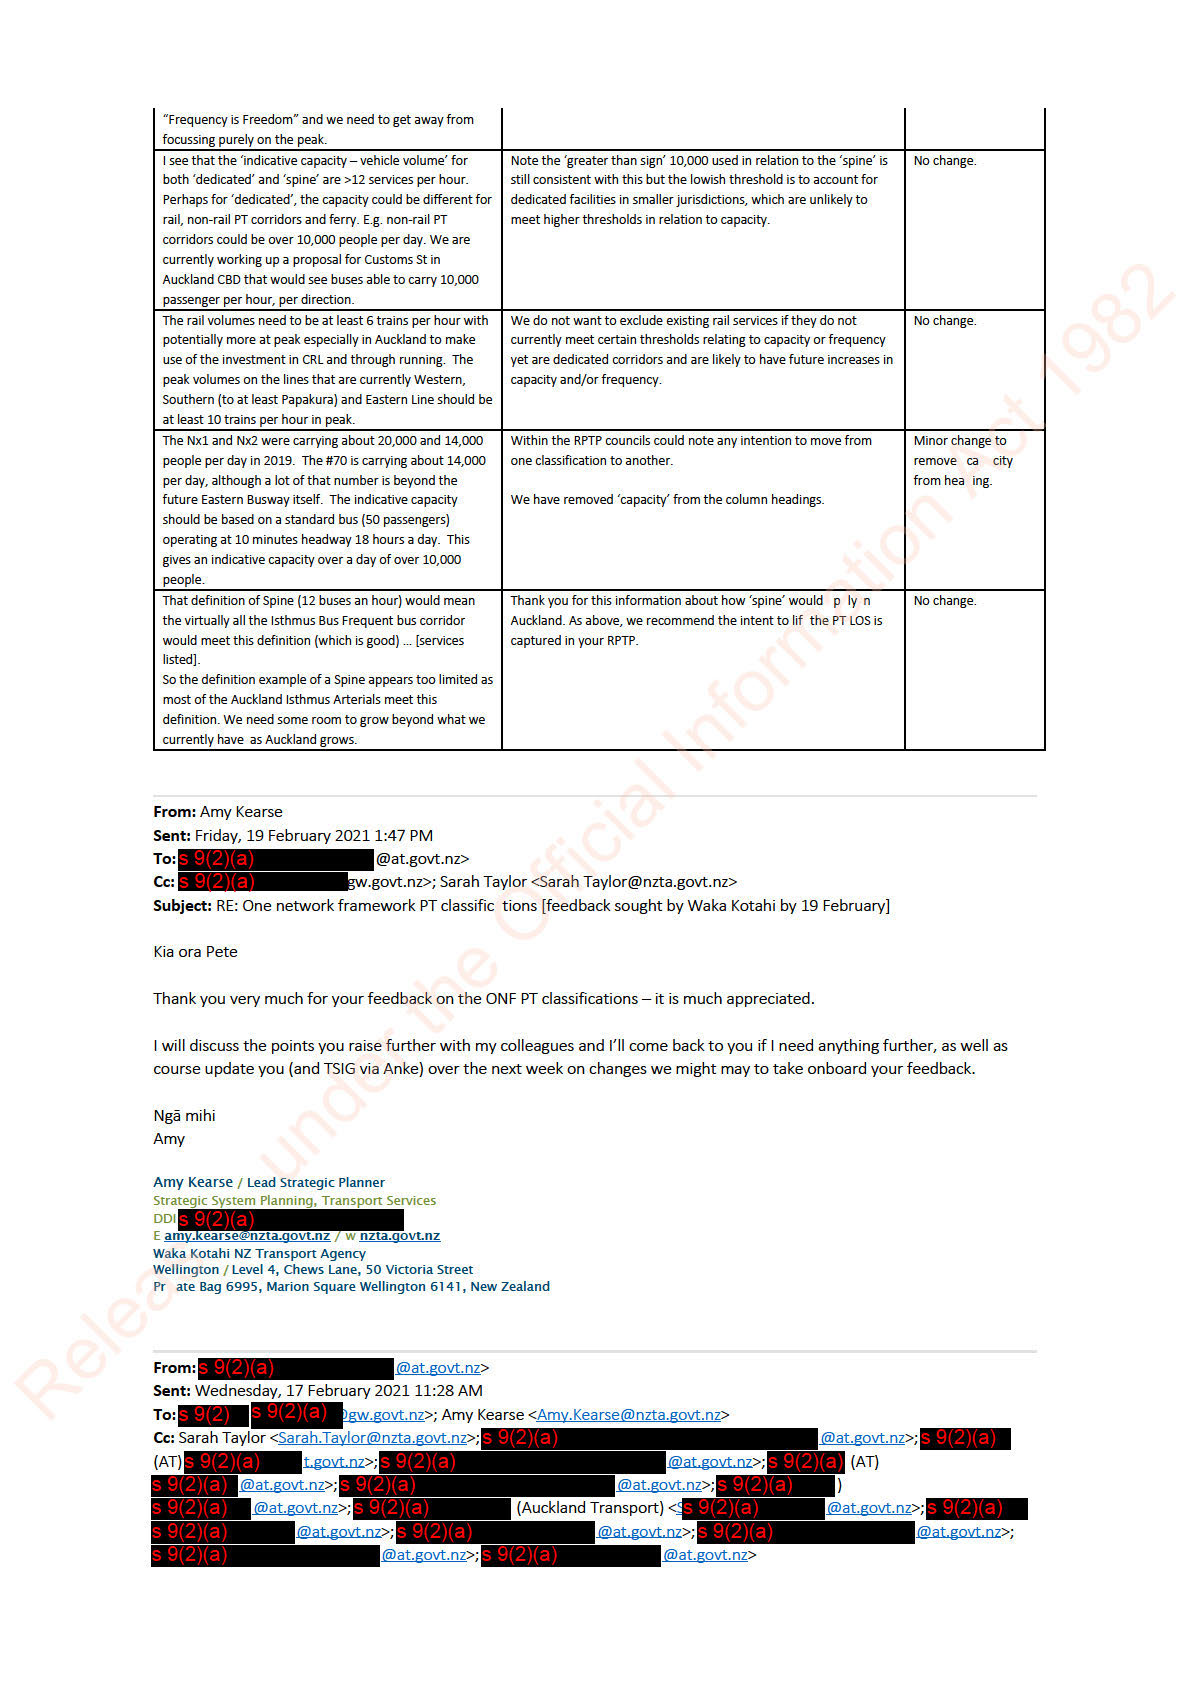
Slide 3 – PT 1 passenger volumes per day at 3,000 per hour seems too low
I see that the ‘indicative capacity – vehicle volume’ for both ‘dedicated’ and ‘spine’ are >12 services per hour.
Perhaps for ‘dedicated’, the capacity could be different for rail, non-rail PT corridors and ferry. E.g. non-rail PT
corridors could be over 10,000 people per day. We are currently working up a proposal for Customs St in Auckland
CBD that would see buses able to carry 10,000 passenger per hour, per direction.

The rail volumes need to be at least 6 trains per hour with potentially more at peak especially in Auckland to make
use of the investment in CRL and through running. The peak volumes on the lines that are currently Western,
Southern (to at least Papakura) and Eastern Line should be at least 10 trains per hour in peak.
The Nx1 and Nx2 were carrying about 20,000 and 14,000 people per day in 2019. The #70 is carrying about 14,000
per day, although a lot of that number is beyond the future Eastern Busway itself. The indicative capacity should be
based on a standard bus (50 passengers) operating at 10 minutes headway 18 hours a day. This gives an indicative
capacity over a day of over 10,000 people.
Slide 3 – Spine
That definition of Spine (12 buses an hour) would mean the virtually all the Isthmus Bus Frequent bus corridor would
meet this definition (which is good) would include:
All 18, all of the Inner LINK route (due to overlaps with other services)
Common section of 22’s, 24’s, 25’s, 27’s, 30 and 309 overlap, Tamaki Drive from Kohimarama, Onewa Rd,
Constellation Drive, parts of the network in Albany, section between Smales Farm and Takapuna
The 70, 75 and Outer LINK are just outside the 12 per hour number on their unique sections
So the definition example of a Spine appears too limited as most of the Auckland Isthmu Arterials meet this
definition. We need some room to grow beyond what we currently have as Auckland grows.
Many thanks
s
s 9(2)(a)
| Service Network Development Manager
Integrated Network Enablement
Integrated Networks
M s 9(2)(a)
s 9(2) [email address]
s 9(2)(a)
the Official Information Act 1982
From:
@at.govt.nz>
Sent: Tuesday, 16 February 2021 1:49 p.m.
To: s 9(2)(a)
at.govt.nz>; s 9(2)(a)
@at.govt.nz>
Subject: FW: One network framework PT classifications [feedback sought by Waka Kotahi by 19 February]
Hi all
un
We need to provide feedback on the attached proposal. My feedback below. Please provide any further comments.
Looks like a decent change proposal, but I do wonder that ferries should be explicitly included in this / new definitions.
Considering:
Corridors where ‘rapid transit’ services are operated, providing a fast, quick, frequent, highly reliable, and high-capacity
service that form of urban transport along a dedicated PT corridor operates on a permanent route (road or rail) that is
dedicated to public transport or largely separated from other traffic.
Released
A 20 minute, 200 seat vessel, ferry service from Devonport and Hobsonville Point (for example) would fall in under this
definition
Inclusion of such services could be justified by measuring its frequency, quickness, reliability and capacity relative to the
relevant location; and would certainly supports the objectives of providing well-functioning urban environments, competitive
land and development markets, and having more people living near public transport.