 West Coast District Health Board
Te Poari Hauora a Rohe o Tai Poutini
Corporate Office
Telephone 03 769-7400
High Street, Greymouth 7840
Fax 03 769-7791
West Coast District Health Board
Te Poari Hauora a Rohe o Tai Poutini
Corporate Office
Telephone 03 769-7400
High Street, Greymouth 7840
Fax 03 769-7791
23 June 2021
Elodie Green
Email: [FYI request #15256 email]
Dear Elodie
RE Official Information Act request WCDHB 9549
I refer to your email dated 23 April 2021 requesting the following information under the Official Information Act
from West Coast DHB. Specifically:
I am seeking information on the performance and service of DHBs for their provision of mental health services.
I would like data for the following:
1. For Community Mental Health; Child and adolescent metal health; and (Te Haika) Mental Health Crisis
response:
a. Number of distinct new entries/cases per month, by age group (five-year bands if possible*), 2015 – 2020
calendar year
Please refer to
Appendix 1 (attached) for the number of distinct new entries / cases per month, by age group
(five-year bands) 2015-2020 calendar years.
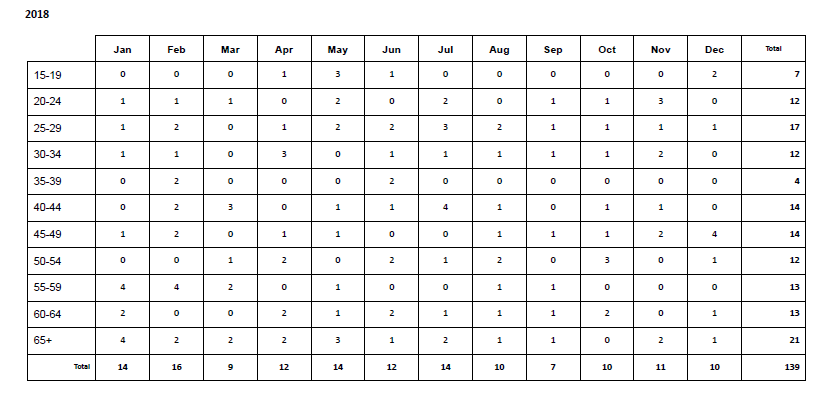
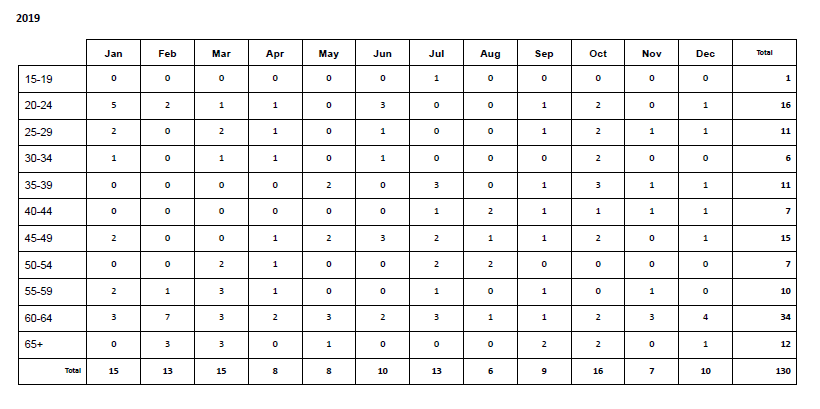
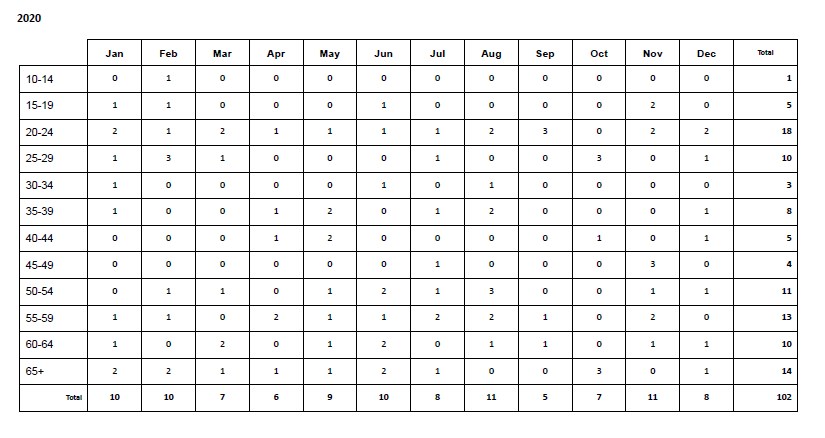
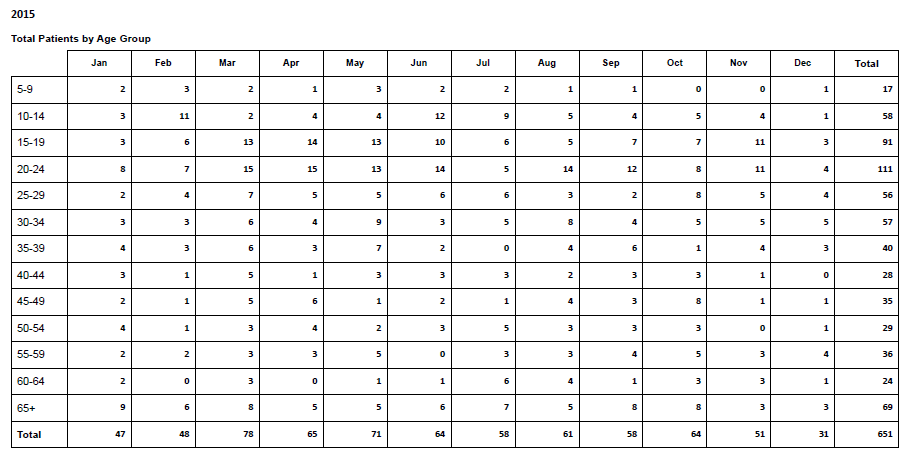
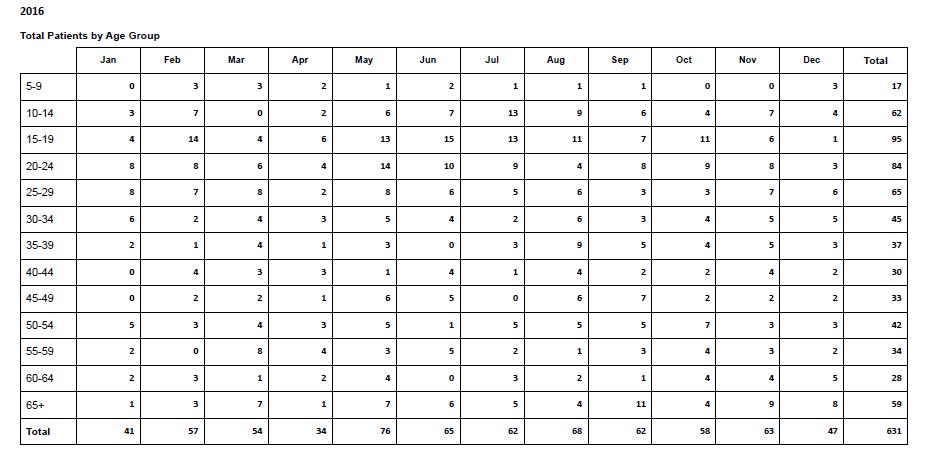
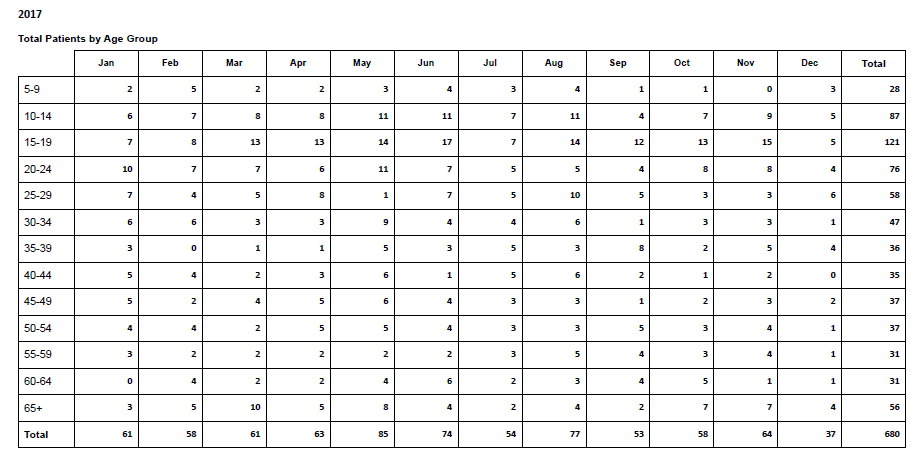
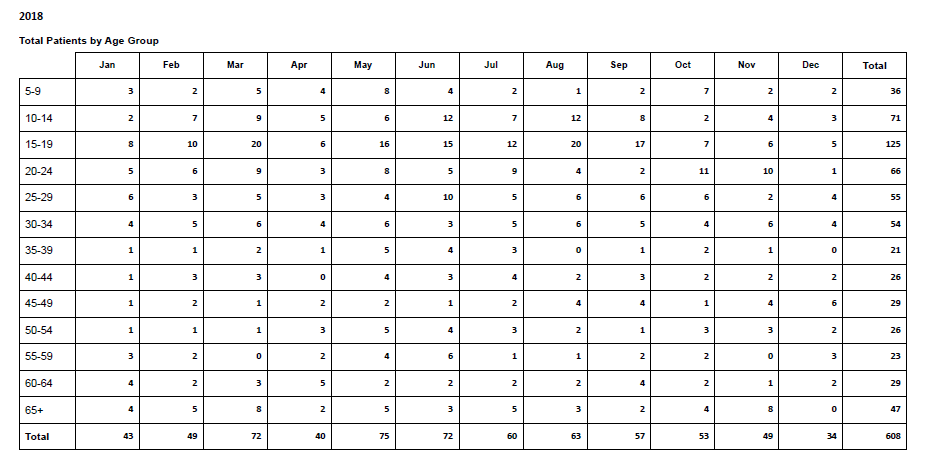
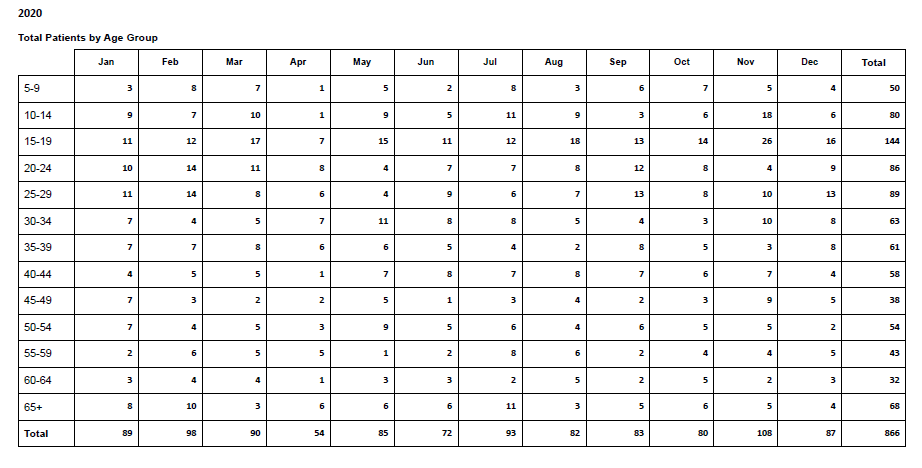
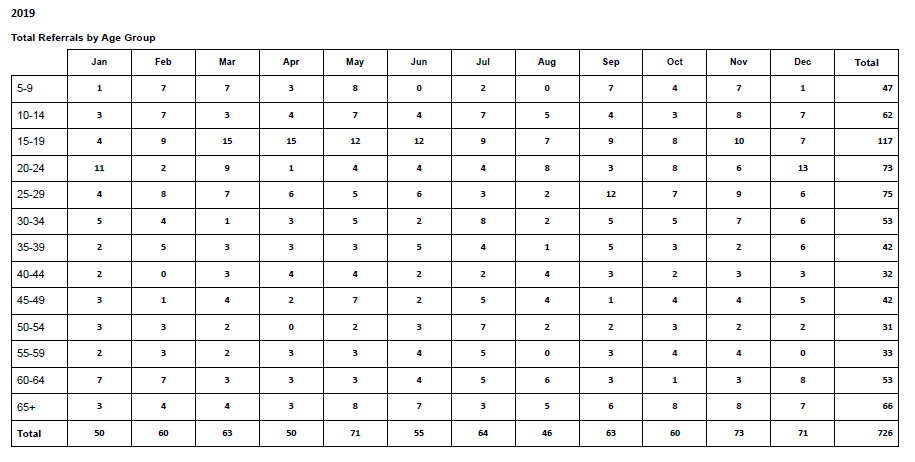
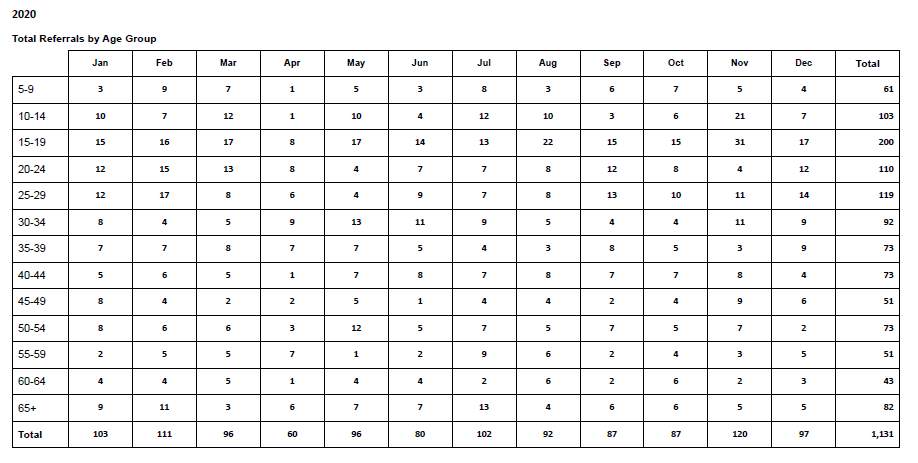
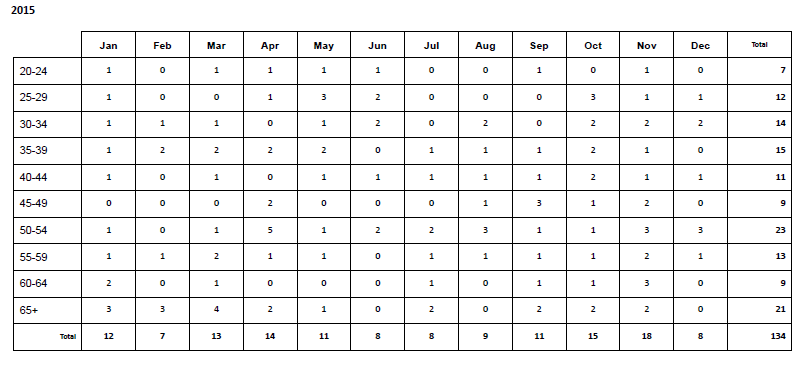
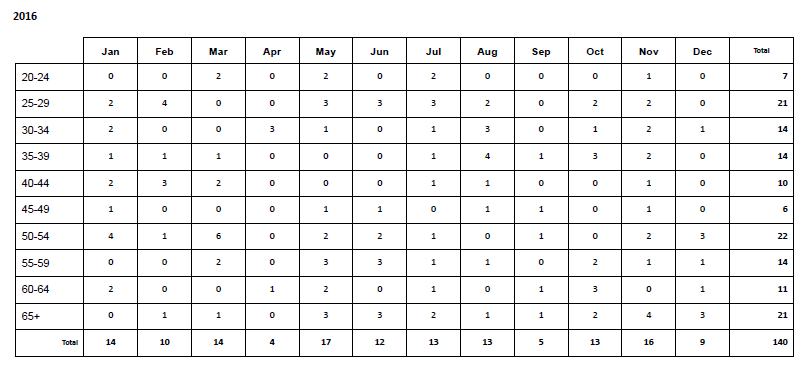
b. Number of total new entries/cases per month, by age group (five-year bands), 2015 – 2020 calendar year
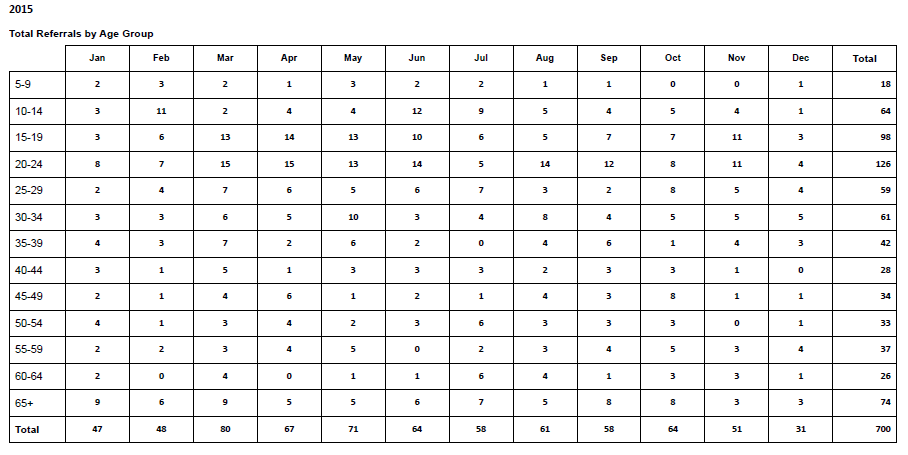
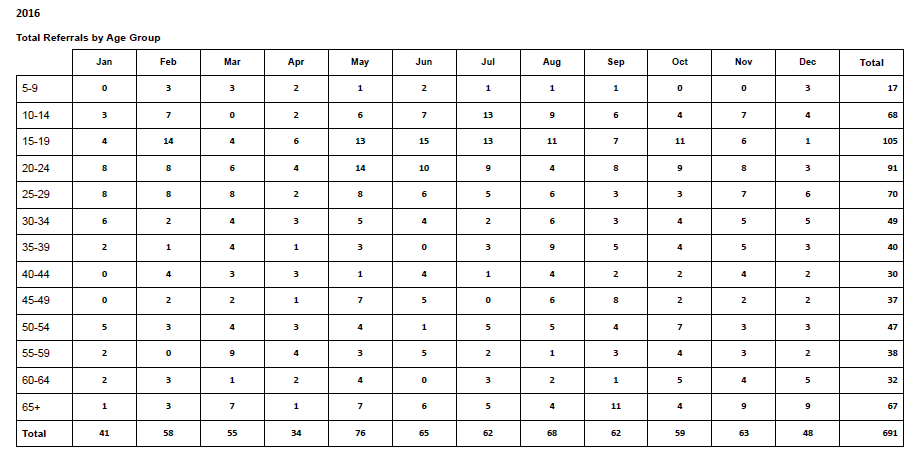
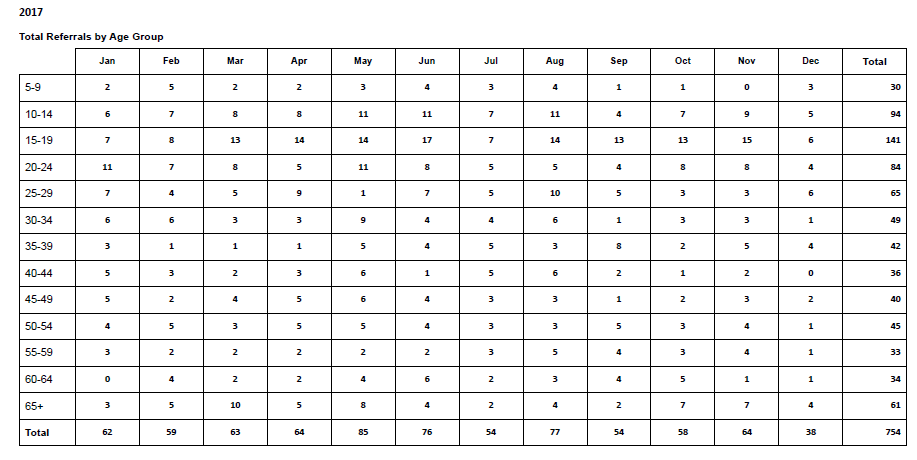
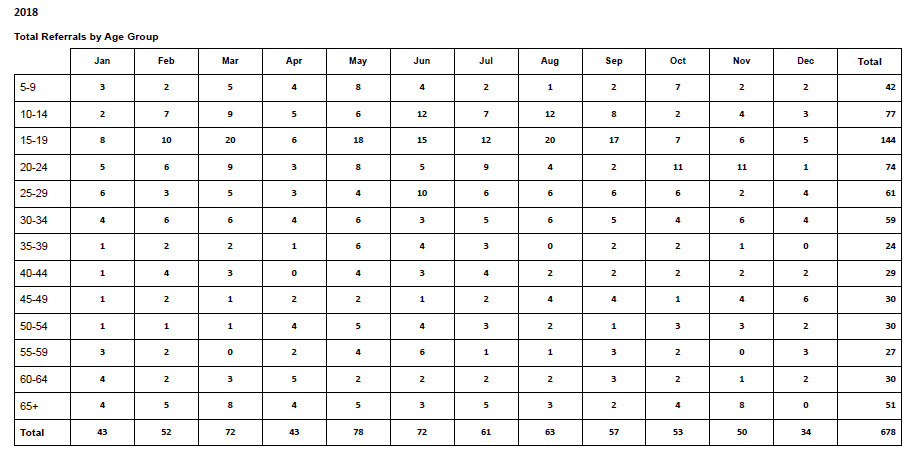
Please refer to
Appendix 2 (attached) for number of total new entries/cases per month, by age group (five-year
bands), 2015 – 2020 calendar year.
c. Number of distinct cases open at month end, by age group (five-year bands), 2015 – 2020 calendar year
Please refer to
Appendix 3 (attached) for number of distinct cases open at month end, by age group (five-year
bands), 2015 – 2020 calendar year.
d. Number of distinct exits per month, by age group (five-year bands if possible*), 2015 – 2020 calendar year
**Please refer to
Appendix 4 (attached) for number of distinct cases open at year end, by age group (five-year
bands), 2015 – 2020 calendar year. The WCDHB has reported by year due to the identifiable information due to
low numbers.
e. Number of total new exits per month, by age group (five-year bands), 2015 – 2020 calendar year
**Please refer to
Appendix 5 (attached) for Number of total new exits per year, by age group (five-year bands),
2015 – 2020 calendar year. The WCDHB has reported by year due to the identifiable information due to low
numbers.
2. For the West Coast DHB:
a. Number of hospitalisations for mental health per year, by age group (five-year bands), 2015 – 2020
calendar year

Please refer to
Appendix 6 (attached) Number of hospitalisations for mental health per year, by age group (five-
year bands), 2015 – 2020 calendar year
b. Number of people waitlisted to see a psychologist per year, by age group (five year bands), 2015 – 2020
calendar year
The West Coast DHB does not hold waitlists for psychologists. We are therefore declining a response to this
question pursuant to section 18(g) of the Official Information Act
c. Number of people seeing a psychologist, per year, by age group (five year bands), 2015 – 2020 calendar
year
The West Coast DHB does not hold waitlists for psychologists. We are therefore declining a response to this
question pursuant to section 18(g) of the Official Information Act
d. Number of psychologists employed by the DHB at year end (split by part time, full time, contracted) by
year, 2015 – 2020 calendar year
Table one: Number of psychologists employed by the West Coast DHB at year end 2015 – 2020 (calendar years)
Year
Casual
Fixed Term
Permanent
Total
Headcount
Full Time*
0
1
2
3
2015
4**
Part Time
0
0
1
1
Full Time*
0
2
0
2
2016
2
Part Time
0
0
0
0
Full Time*
0
0
1
1
2017
1
Part Time
0
0
0
0
Full Time*
0
0
1
1
2018
1
Part Time
0
0
0
0
Full Time*
0
0
1
1
2019
1
Part Time
0
0
0
0
Full Time*
0
0
1
1
2020
1
Part Time
0
0
0
0
*Full time equals 0.9 FTE or above
**Total includes one full time psychology intern.
Additional services are provided by psychologists based in the community.
I trust this satisfies your interest in this matter.
You may, under section 28(3) of the Official Information Act, seek a review of our decision to withhold
information by the Ombudsman. Information about how to make a complaint is available at
www.ombudsman.parliament.nz; or Freephone 0800 802 602.
Please note that this response, or an edited version of this response, may be published on the West Coast DHB
website after your receipt of this response.
Yours sincerely
Tracey Maisey
Executive Director
Planning, Funding & Decision Support
 Appendix 1
Number of distinct new entries/cases per month, by age group (five-year bands), 2015 – 2020
calendar year

 Appendix 2
Number of total new entries/cases per month, by age group (five-year bands), 2015 – 2020 calendar year
Appendix 3
Number of distinct cases open at month end, by age group (five-year bands), 2015 – 2020 calendar year
05-
10-
15-
20-
25-
30-
35-
40-
45-
50-
55-
60-
65-
70-
75-
80-
85-
Grand
09
14
19
24
29
34
39
44
49
54
59
64
69
74
79
84
89
Total
01/01/2015
2
5
3
3
5
16
13
8
10
6
2
1
1
75
01/02/2015
1
6
3
3
5
15
14
8
10
6
2
1
1
75
01/03/2015
1
5
5
3
5
15
14
8
11
6
2
1
1
77
01/04/2015
1
5
5
3
5
14
15
8
10
7
2
1
1
77
01/05/2015
1
5
5
3
5
14
15
8
10
7
2
1
1
77
01/06/2015
1
5
5
3
6
14
14
9
10
7
2
1
1
78
01/07/2015
1
5
5
3
6
15
14
9
10
7
2
1
1
79
01/08/2015
1
5
5
3
6
14
15
9
10
7
2
1
1
79
01/09/2015
1
5
5
3
6
14
15
9
9
8
2
1
1
79
01/10/2015
1
5
4
4
6
14
15
9
9
8
2
1
1
79
01/11/2015
1
5
4
3
7
14
15
9
8
9
2
1
1
79
01/12/2015
1
5
4
3
7
14
15
9
7
10
2
1
1
79
01/01/2016
1
5
4
2
8
14
15
9
7
10
2
1
1
79
01/02/2016
1
5
3
3
8
14
15
9
7
10
2
1
1
79
01/03/2016
1
5
3
4
8
15
14
10
7
10
2
1
1
81
01/04/2016
1
5
3
4
8
15
14
11
7
10
2
1
1
82
01/05/2016
1
6
3
4
8
15
15
12
7
11
2
1
1
86
01/06/2016
1
6
2
5
8
16
15
12
7
11
2
1
1
87
01/07/2016
1
4
4
5
7
17
15
11
7
12
2
1
1
87
01/08/2016
1
5
4
5
7
17
14
12
7
12
2
1
1
88
01/09/2016
1
5
4
5
7
16
15
12
7
12
2
1
1
88
01/10/2016
1
5
5
5
7
16
14
12
8
12
2
1
1
89
01/11/2016
7
5
6
6
17
14
12
8
12
2
1
1
91
01/12/2016
7
5
6
6
17
14
11
9
12
2
1
1
91
01/01/2017
1
8
5
6
7
17
14
11
9
11
3
1
1
94
01/02/2017
1
8
5
6
7
16
15
11
9
11
3
1
1
94
01/03/2017
1
8
5
6
7
16
15
11
9
11
3
1
1
94
01/04/2017
1
8
5
6
7
14
17
11
9
11
3
1
1
94
01/05/2017
1
8
5
7
8
14
16
12
9
12
3
1
1
97
01/06/2017
1
8
5
7
7
15
18
13
10
13
3
1
1
102
01/07/2017
1
1
7
6
7
7
15
18
13
10
12
3
2
1
103
01/08/2017
1
2
7
6
6
8
15
18
12
11
12
3
2
1
104
01/09/2017
1
2
7
6
6
8
14
19
12
12
11
4
1
1
1
105
01/10/2017
1
2
7
6
6
7
15
20
13
12
11
5
1
1
1
108
01/11/2017
1
2
7
6
6
7
15
19
14
12
11
5
1
1
1
108
01/12/2017
1
2
6
7
6
7
14
19
15
12
10
5
2
1
1
108
01/01/2018
1
2
6
7
7
7
14
19
14
13
10
6
2
1
1
110
01/02/2018
3
6
7
7
6
15
20
14
14
10
6
2
1
1
112
01/03/2018
2
7
7
7
6
15
20
14
14
11
7
2
1
1
114
01/04/2018
2
7
8
7
6
15
20
13
15
11
7
2
2
1
116
01/05/2018
2
7
9
7
6
15
20
13
16
11
7
2
2
1
118
01/06/2018
2
7
9
8
6
15
22
13
14
13
7
2
2
1
121
01/07/2018
2
7
9
8
6
15
22
12
15
13
7
2
2
1
121
01/08/2018
2
7
10
8
6
14
23
12
15
13
6
3
2
1
122
01/09/2018
2
7
10
8
7
13
24
12
15
13
6
3
2
1
123
01/10/2018
2
7
10
8
7
13
23
13
15
13
6
3
2
1
123
01/11/2018
3
7
10
8
5
15
23
12
15
14
6
3
2
1
124
01/12/2018
3
8
10
8
6
14
24
12
15
13
7
3
2
1
126
01/01/2019
3
8
10
10
7
14
24
13
16
13
7
3
2
1
131
01/02/2019
3
9
10
10
7
14
24
13
16
14
7
3
2
1
133
01/03/2019
3
10
10
10
7
14
24
14
15
15
7
3
2
1
135
01/04/2019
3
10
10
10
7
14
24
14
15
16
7
3
2
1
136
01/05/2019
4
10
10
9
8
14
25
15
15
16
7
3
2
1
139
01/06/2019
5
10
10
9
9
14
26
15
16
16
7
3
2
1
143
01/07/2019
1
5
11
10
11
9
13
25
17
17
16
7
3
2
1
148
01/08/2019
1
6
11
10
9
11
14
24
19
17
15
8
3
2
1
151
01/09/2019
1
6
11
12
9
11
13
26
19
18
14
9
3
2
1
155
01/10/2019
1
7
11
12
11
11
14
25
19
19
14
10
3
2
1
160
01/11/2019
1
7
12
13
11
13
14
24
23
18
15
9
4
3
1
168
01/12/2019
1
8
11
14
11
13
14
22
24
20
16
9
4
4
1
172
01/01/2020
1
8
11
14
11
14
15
22
24
20
16
9
4
4
1
174
01/02/2020
1
9
11
16
11
14
15
23
25
20
16
9
4
4
1
179
01/03/2020
2
13
11
15
13
14
15
22
27
20
16
10
4
4
1
187
01/04/2020
2
15
12
15
13
13
17
24
28
19
15
12
4
4
1
194
01/05/2020
2
15
12
15
15
15
17
24
29
20
16
12
4
4
1
201
01/06/2020
1
16
13
17
15
15
19
25
28
22
16
12
5
4
1
209
01/07/2020
1
1
16
13
17
17
15
21
25
27
25
15
13
5
4
1
216
01/08/2020
1
2
3
16
13
18
16
19
22
24
32
26
14
13
6
3
2
230
01/09/2020
1
2
4
17
15
19
17
20
23
27
32
27
14
14
6
3
2
243
01/10/2020
1
2
6
19
16
20
16
21
22
28
34
28
14
15
6
3
2
253
01/11/2020
1
2
9
18
17
23
15
22
27
30
35
29
14
17
7
3
2
271
01/12/2020
1
3
11
16
23
25
19
22
26
31
34
31
13
19
7
3
2
286
Grand Total
5
12
62
299
589
616
555
635
1120
1414
1098
991
862
418
168
127
45
9016
Appendix 4 Number of distinct exits per year, by age group (five-year bands), 2015 – 2020 calendar year
00-04 05-09 10-14 15-19 20-24 25-29 30-34 35-39 40-44 45-49 50-54 55-59 60-64 65-69 70-74 75-79 80-84 85-89 90-94 95-99 Grand Total
2015
48
79
120
132
64
65
33
32
38
33
30
35
29
21
7
6
3
4
779
2016
16
57
100
108
62
47
42
29
29
51
45
32
29
20
14
9
4
1
1
696
2017
15
99
107
119
67
62
44
42
40
45
37
27
27
11
13
7
5
2
769
2018
5
68
111
109
65
52
33
39
23
34
25
28
32
16
7
9
2
4
1
1
664
2019
6
68
81
115
67
68
48
24
36
37
38
33
39
14
20
8
4
1
707
2020
1
78
113
170
95
107
72
61
59
46
51
42
52
26
30
15
3
7
1028
Grand Total
91
449
632
753
420
401
272
227
225
246
226
197
208
108
91
54
21
18
3
1
4643
 Appendix 5
Number of total new exits per year, by age group (five-year bands), 2015 – 2020 calendar year
00-04 05-09 10-14 15-19 20-24 25-29 30-34 35-39 40-44 45-49 50-54 55-59 60-64 65-69 70-74 75-79 80-84 85-89 90-94 95-99 Grand Total
2015
48
79
120
133
64
66
34
32
38
33
30
35
29
21
7
6
3
4
782
2016
16
58
100
108
63
47
42
31
29
51
47
34
29
20
14
9
4
1
1
704
2017
15
99
107
121
69
63
44
44
41
46
38
27
27
11
13
7
5
2
779
2018
5
68
111
111
65
52
33
39
23
34
25
28
32
16
7
9
2
4
1
1
666
2019
6
68
81
116
67
69
48
24
38
37
38
34
39
14
20
8
4
1
712
2020
1
79
118
178
97
110
74
63
59
48
55
42
52
26
31
15
3
7
1058
Grand Total
91
451
637
767
425
407
275
233
228
249
233
200
208
108
92
54
21
18
3
1
4701
Appendix 6
Number of hospitalisations for mental health per year, by age group (five-year bands), 2015 – 2020 calendar
year