
 GW Corporate Carbon Pathways for the 2021-31 LTP
Overview
• Background and scenario building
• Officer’s preferred option - B2-R1-P1.5
• Option two - B2-R2-P2
• Option three - B1-R1-P1
• Comparison
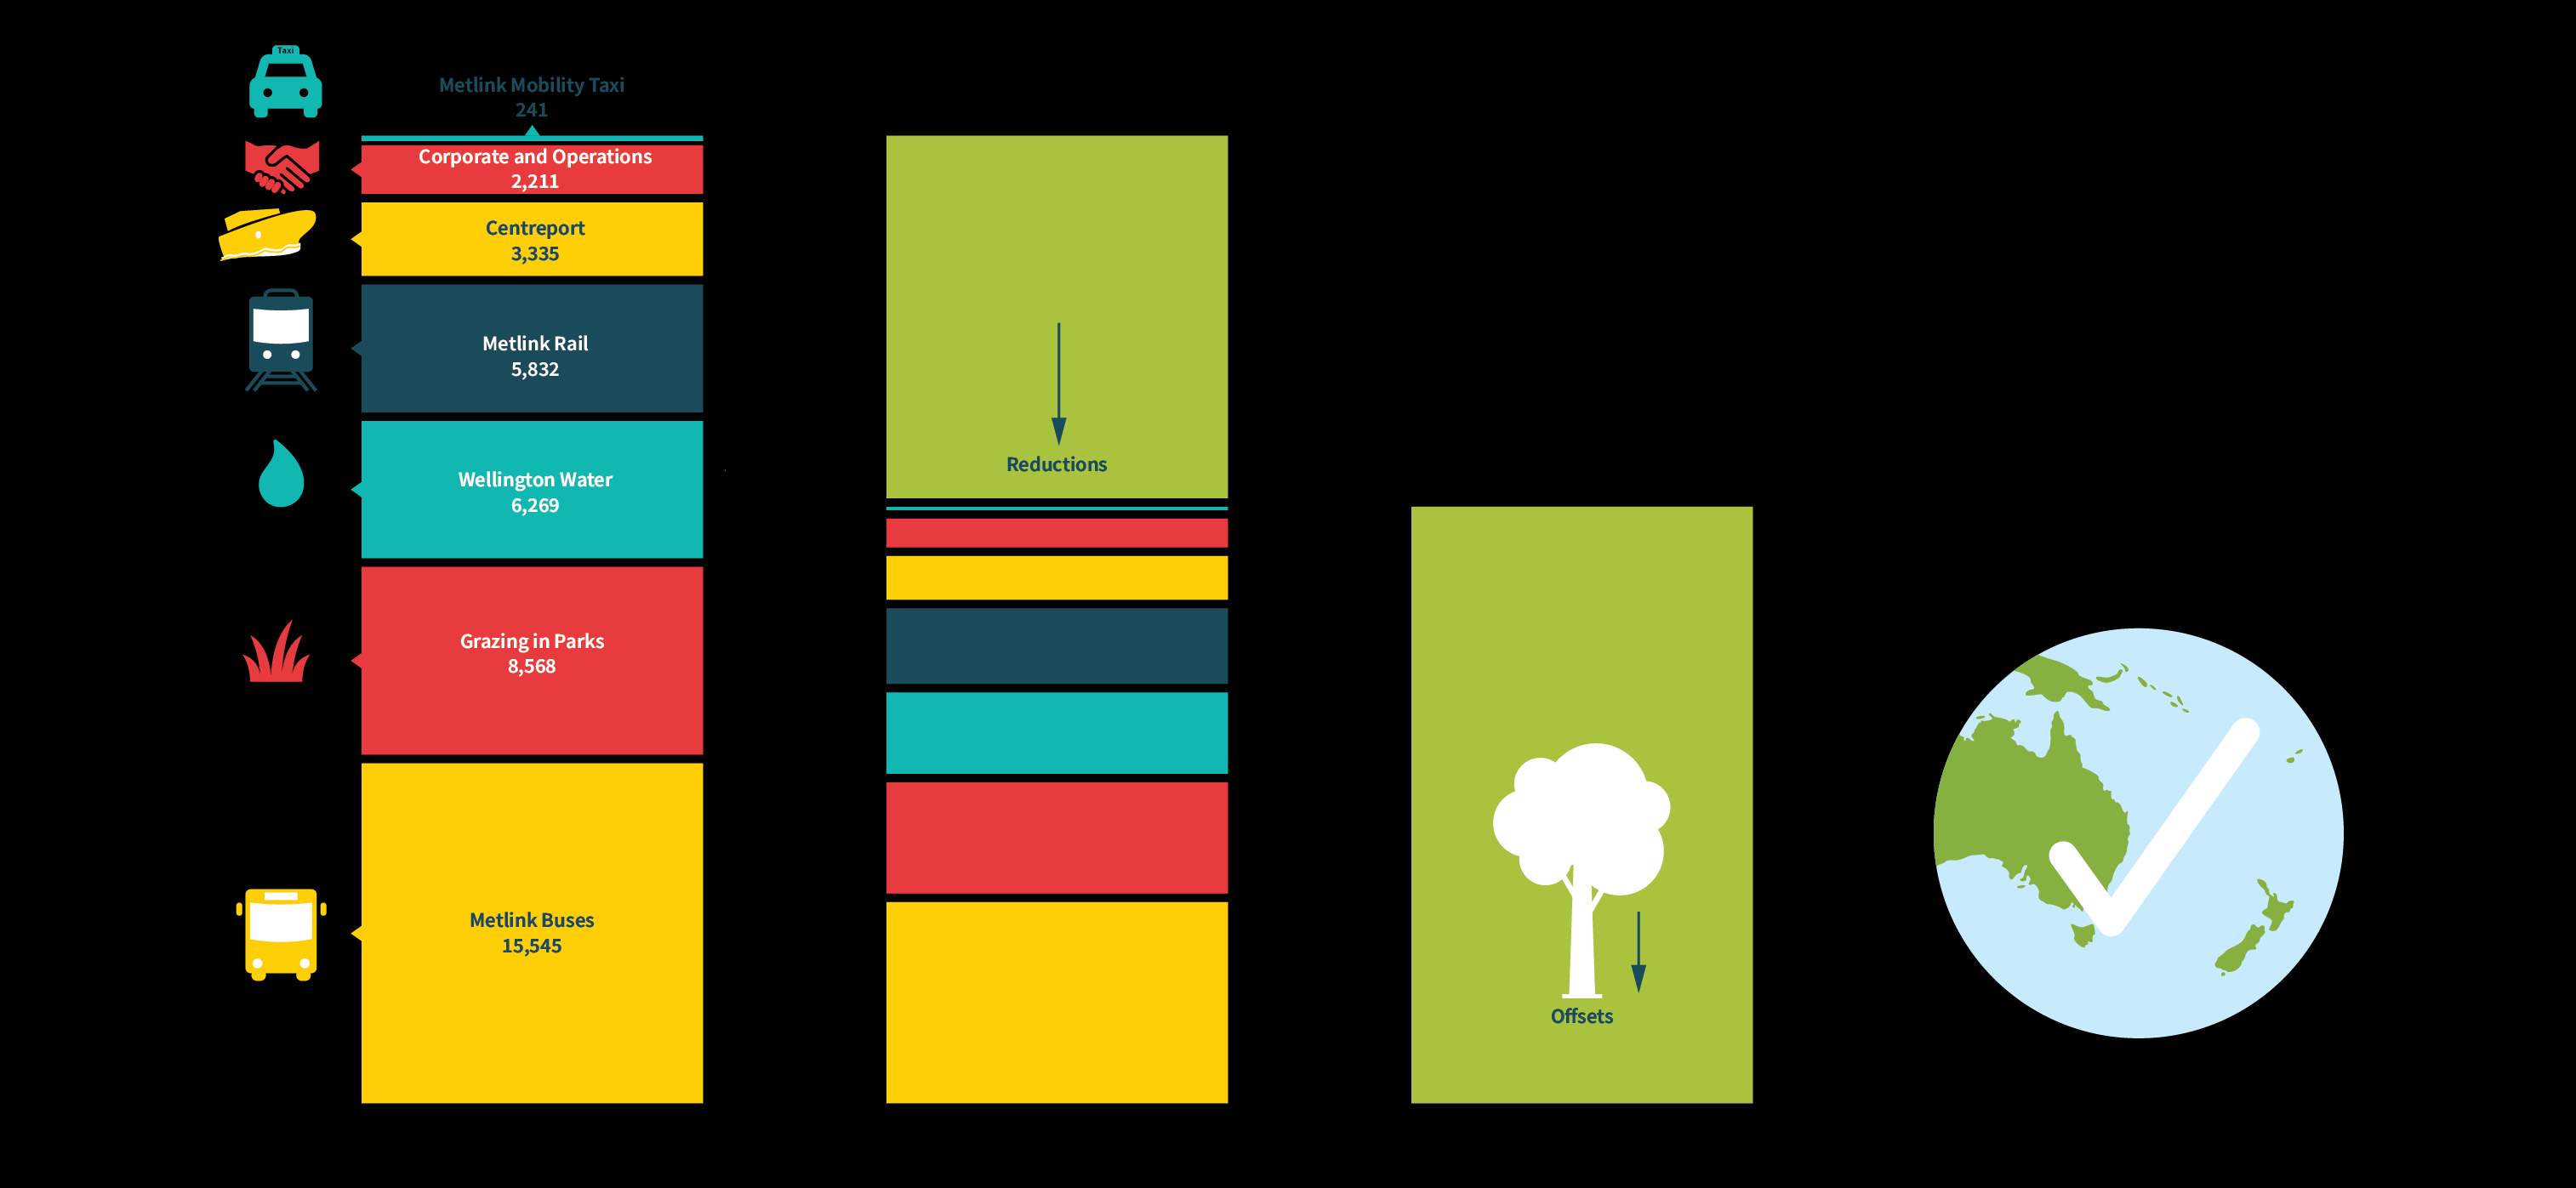 Greater Wellington – the path to carbon neutrality and beyond
 GW’s corporate targets
• 40% reduction in net emissions in 2025
• 100% reduction in net emissions in 2030
(carbon neutral or net-zero)
• ‘Carbon positive’ by 2035 (units being
generated by GW exceed gross emissions)
• Set five-yearly carbon budgets
Background
• On 29 October Council agreed that there would be at least two
decarbonisations scenarios in the LTP consultation document and one of
these would be B2-R2-P2
• Since then the various scenarios have been investigated further and costs
refined
• The current scenario included in the draft LTP is B2-R1-P1.5
• Following workshop feedback, offsetting assumed not to begin until 2025
at the earliest
 Scenario building
• 100% renewable electricity by 2030 (updated
post election)
• All electric light fleet by 2030
• Cuba Street change included
• CentrePort and CCOs removed from footprint
and modelling (total 10,370 tonnes CO2e/year
in 2018-19)
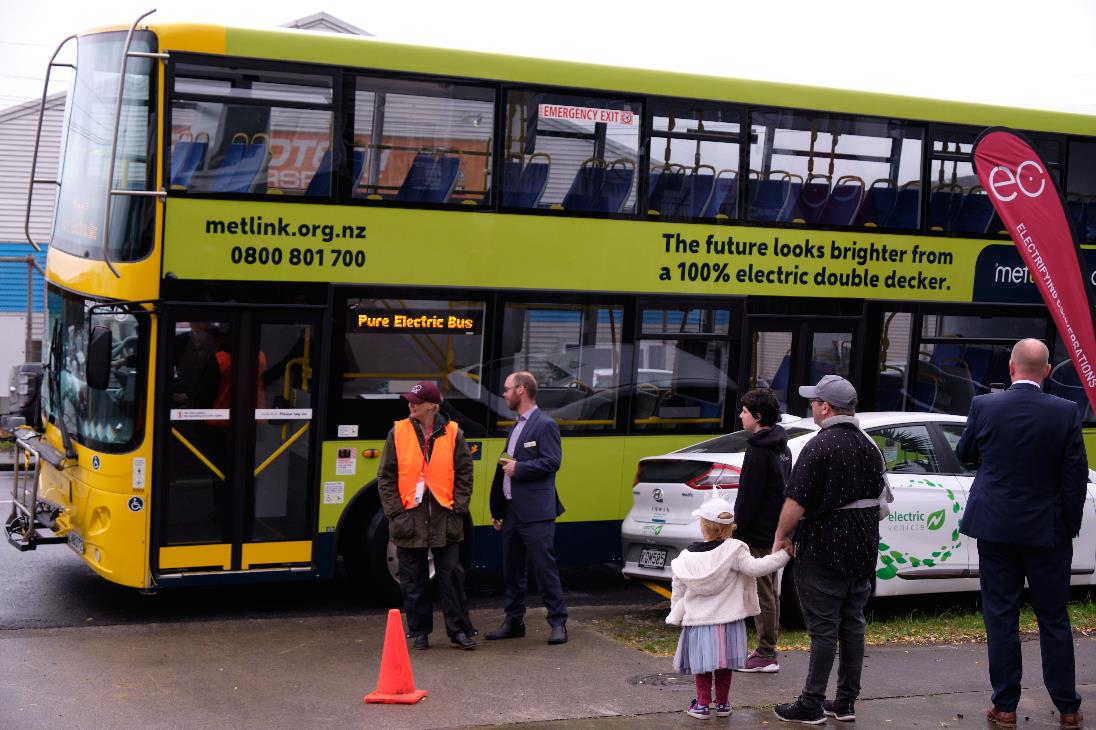
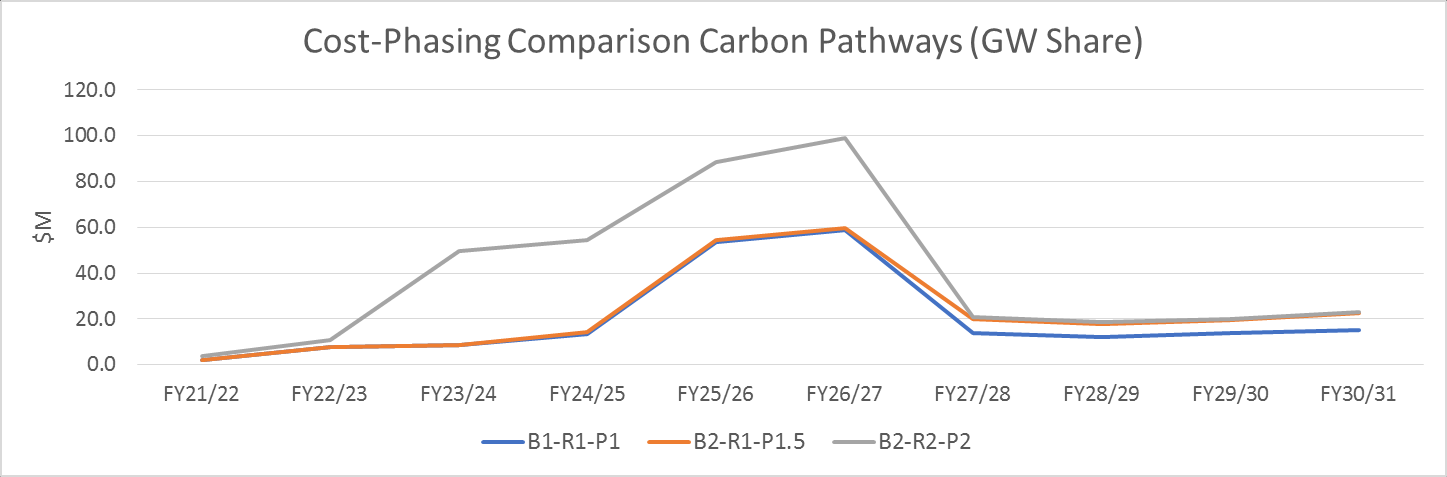
Scenario building - Bus
Level/
Description
GW share of cost
Total cost
label
(2021-30)
(2021-30)
B1
Existing commitment electric buses, plus
$63M
$128M
new EVs at replacement only (‘Organic
Growth)
B2
All bus peak vehicle commitment EV
$83M
$169M
from contract renewal, spares are diesel
(‘Step Change’)
•
Costings are based on existing contractual arrangements. 51% NZTA subsidy.
•
Costs common to both scenarios excluded.
•
B2 achieves a 75% reduction in emissions in 2030 compared to 2019. Scenarios with spare
buses as EV achieve an 82% reduction.
•
~21% of the bus fleet are spares (138 of 663 buses in 2030)
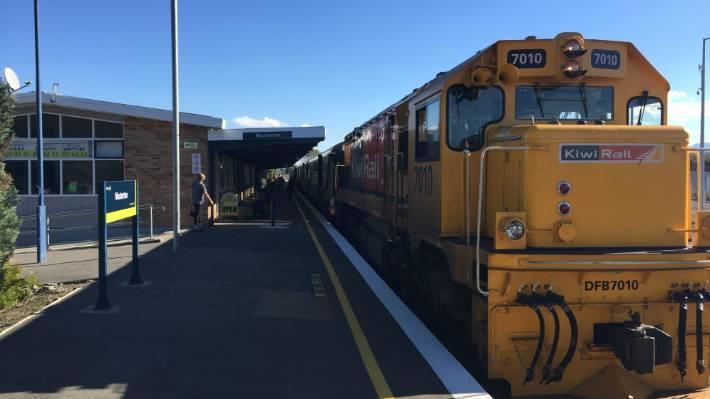
Scenario building - Rail
Level/
Description
GW share of cost
Total cost
label
(2021-30)
(2021-30)
R1
Diesel-electric multiple unit (DEMU) trains on
$118M
$240M
Wairarapa and Manawatu lines from 2025
R2
Battery-electric multiple unit (BEMU) trains
$270M
$550M
on Wairarapa and Manawatu lines from 2025
•
51% NZTA subsidy assumed to calculate GW share of cost
•
Costs common to both scenarios excluded (e.g. station improvements)
•
Note carbon reductions from full electrification of these lines (EMU trains) are the same as R2
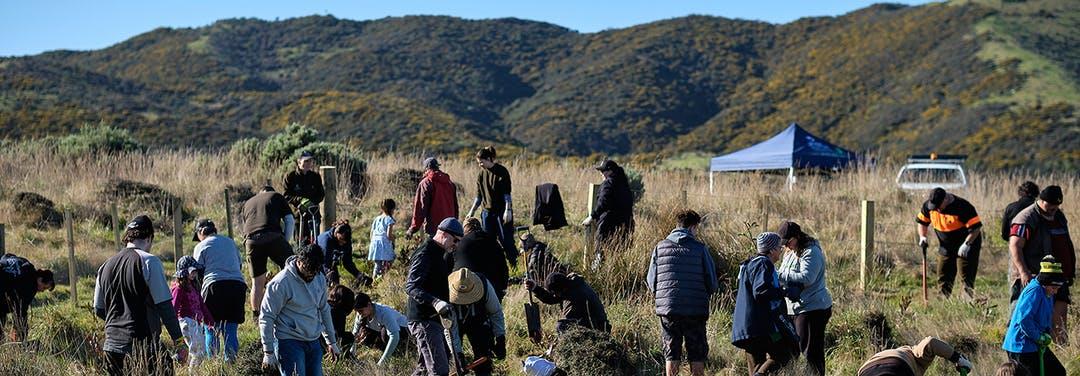
Scenario building - Parks
Level/
Description
Cost estimate (total to 2035)
label
P1
1,115Ha grazing phased out over 15 years,
$23.5M
planted in new native forest
P1.5
1,350Ha grazing phased out over 10 years,
$26.4M
planted in new native forest
P2
1,713Ha grazing phased out over 10 years,
$36.3M
planted in new native forest
•
Cost estimate excludes value of emissions units earned from new forest
•
Excludes any contribution from Low Carbon Acceleration Fund (LCAF)
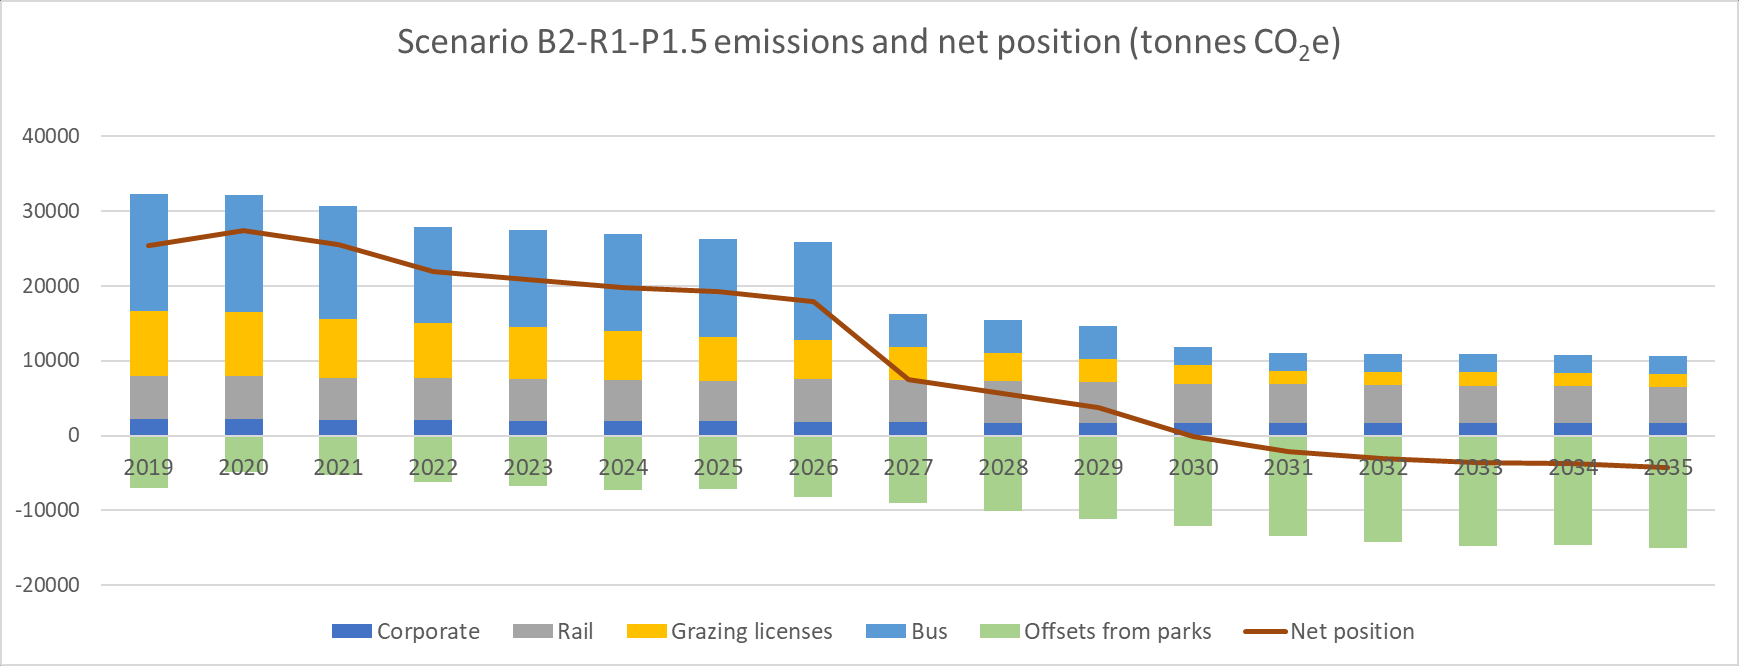 Officer’s preferred scenario - B2-R1-P1.5
• Carbon positive goal achieved
Officer’s preferred scenario - B2-R1-P1.5
tCO2e
Budget
Gross emissions Difference Sequestration Shortfall
2021-25
N/A
140103
0
-32612
-32612
2026-30
38877
85070
46192
-50566
-4374
2031-35
0
55230
55230
-72024
-16794
Total
-53780
Pre-2021 emission unit reserve
-86,129
Net emission unit position
-139,909
Value at $150/tCO2e $ 2
0,986,313
• No external emissions unit purchase needed to maintain carbon
neutral status
• Surplus emissions units available – e.g. for Centreport & CCOs
Why is B2-R1-P1.5 officer’s preferred option?
• This option allows us to meet our carbon positive goals by 2035, while also
optimising costs
• This is a more achievable and affordable option, given we are facing
double digit rates increases for the next five or so years
• Staff have deemed P2 unachievable (more on the next slide)
• R2 seems to be unaffordable, and unnecessary to meet our carbon
positive goals
Why is P2 not achievable? (P1.5 versus P2)
•
Large scale restoration needs to be well-planned, and should align with our master
planning process, which will also identify recreational areas within parks
•
Requires large scale plant procurement, this option will put pressure on existing
suppliers, no time for new suppliers to get into business
•
We can only plant at certain times of the year, which means we would be at risk of not
delivering
•
We need to engage with mana whenua on design, implementation and sites of
significance, this takes time and is reliant on their capacity and capability
•
This option would put staff and contractors under extreme pressure, which is
unnecessary given we can achieve our carbon positive goals with P1.5
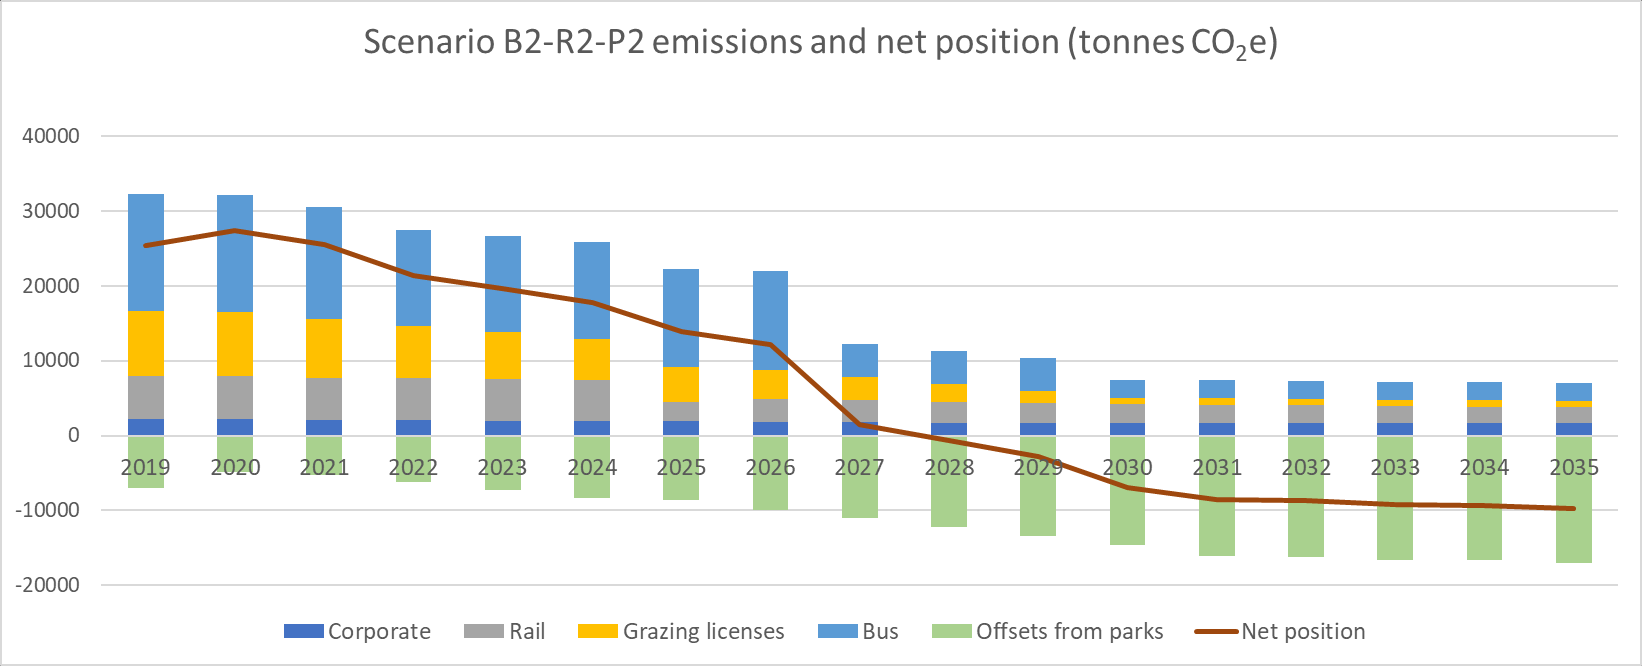 Other scenario - B2-R2-P2
• Carbon positive goal achieved
Other scenario - B2-R2-P2
tCO2e
Budget
Gross emissions Difference Sequestration Shortfall
2021-25
N/A
133870
0
-35777
-35777
2026-30
38877
64339
25462
-61083
-35621
2031-35
0
36913
36913
-82469
-45556
Total
-116954
Pre-2021 emission unit reserve
-86,129
Net emission unit position
-203,083
Value at $150/tCO2e $ 3
0,462,514
• No external emissions unit purchase needed to maintain carbon neutral status, surplus
emissions units
• After further consideration we do not think this scenario is achievable for parks, or
affordable for rail
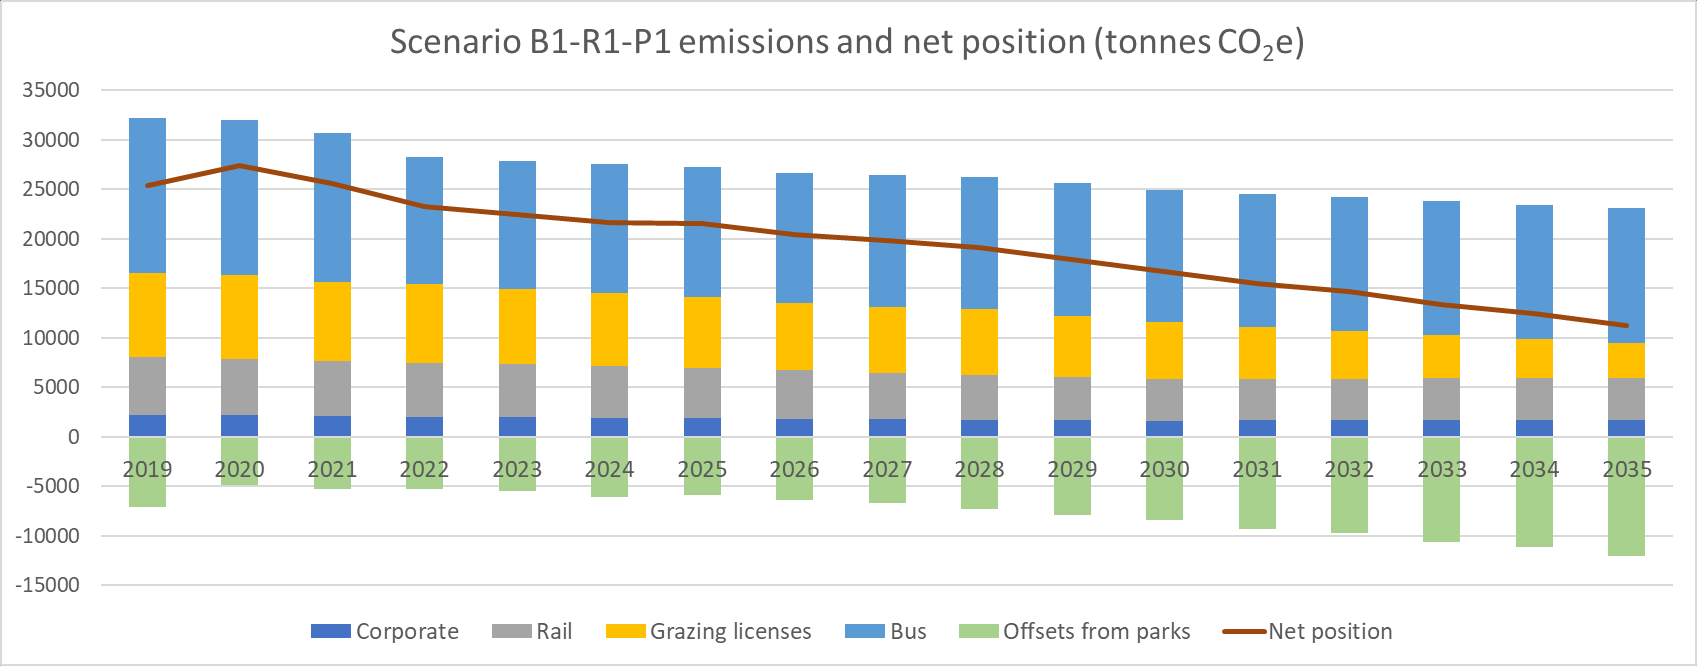 Other scenario - B1-R1-P1
• Carbon positive goal not achieved
Other scenario - B1-R1-P1
tCO2e
Budget
Gross emissions Difference Sequestration Shortfall
2021-25
N/A
142485
0
-27988
-27988
2026-30
38877
130761
91884
-36736
55147
2031-35
0
120026
120026
-52865
67161
Total
94320
Pre-2021 emission unit reserve
-86,129
Net emission unit position
8,191
Value at $150/tCO2 -$ 1
,228,677
• No surplus emissions units
• External emissions unit purchase needed to maintain carbon neutral status
• ~$2.2M/year expense from 2035
• But suggest we include this as a low option in the LTP consultation
 Comparison table
Scenario
Carbon positive Spare
Combined cost estimate Total combined cost
goal reached?
emissions units (GW share)
estimate
Comparison table
Scenario
Carbon positive Spare
Combined cost estimate Total combined cost
goal reached?
emissions units (GW share)
estimate
B1-R1-P1
No
-8,200
$204M
$391M
B2-R1-P1.5
Yes
140,000
$227M
$435M
B2-R2-P2
Yes
203,000
$389M
$755M
Note:
Impact of any potential
LCAF funding not shown
(~$7M left in the fund )
Rates % increase – comparison against LTP budget
18.0%
16.0%
14.0%
12.0%
10.0%
8.0%
6.0%
4.0%
2.0%
0.0%
2021/22
2022/23
2023/24
2024/25
2025/26
2026/27
2027/28
2028/29
2029/30
2030/31
-2.0%
-4.0%
P1.5 B2 R1 Current package
P1 B1 R1
R2 B2 P2
Impact on rates over 10 years
50
s noilliM 45
40
35
30
25
20
15
10
5
-
2021/22
2022/23
2023/24
2024/25
2025/26
2026/27
2027/28
2028/29
2029/30
2030/31
P1.5 B2 R1 Current package
P1 B1 R1
R2 B2 P2
Summary
• B2-R1-P1.5 is an achievable option which optimises cost and achieves our
carbon positive goal
• B2-R2-P2 maximises carbon reduction, but is unachievable for parks and
unaffordable for rail
• B1-R1-P1 minimises costs but is inconsistent with the carbon positive goal,
and creates an ongoing liability for procuring carbon offsets after 2034 to
maintain carbon neutral status
• All three are valid options for the LTP consultation document, officers’
recommend the option currently budgeted, B2-R1-P1.5
 Questions?