 WELLINGTON
REGIONAL RAIL
STRATEGIC DIRECTION 2020
WELLINGTON
REGIONAL RAIL
STRATEGIC DIRECTION 2020
 Where we’ve
come from
Where we’ve
come from
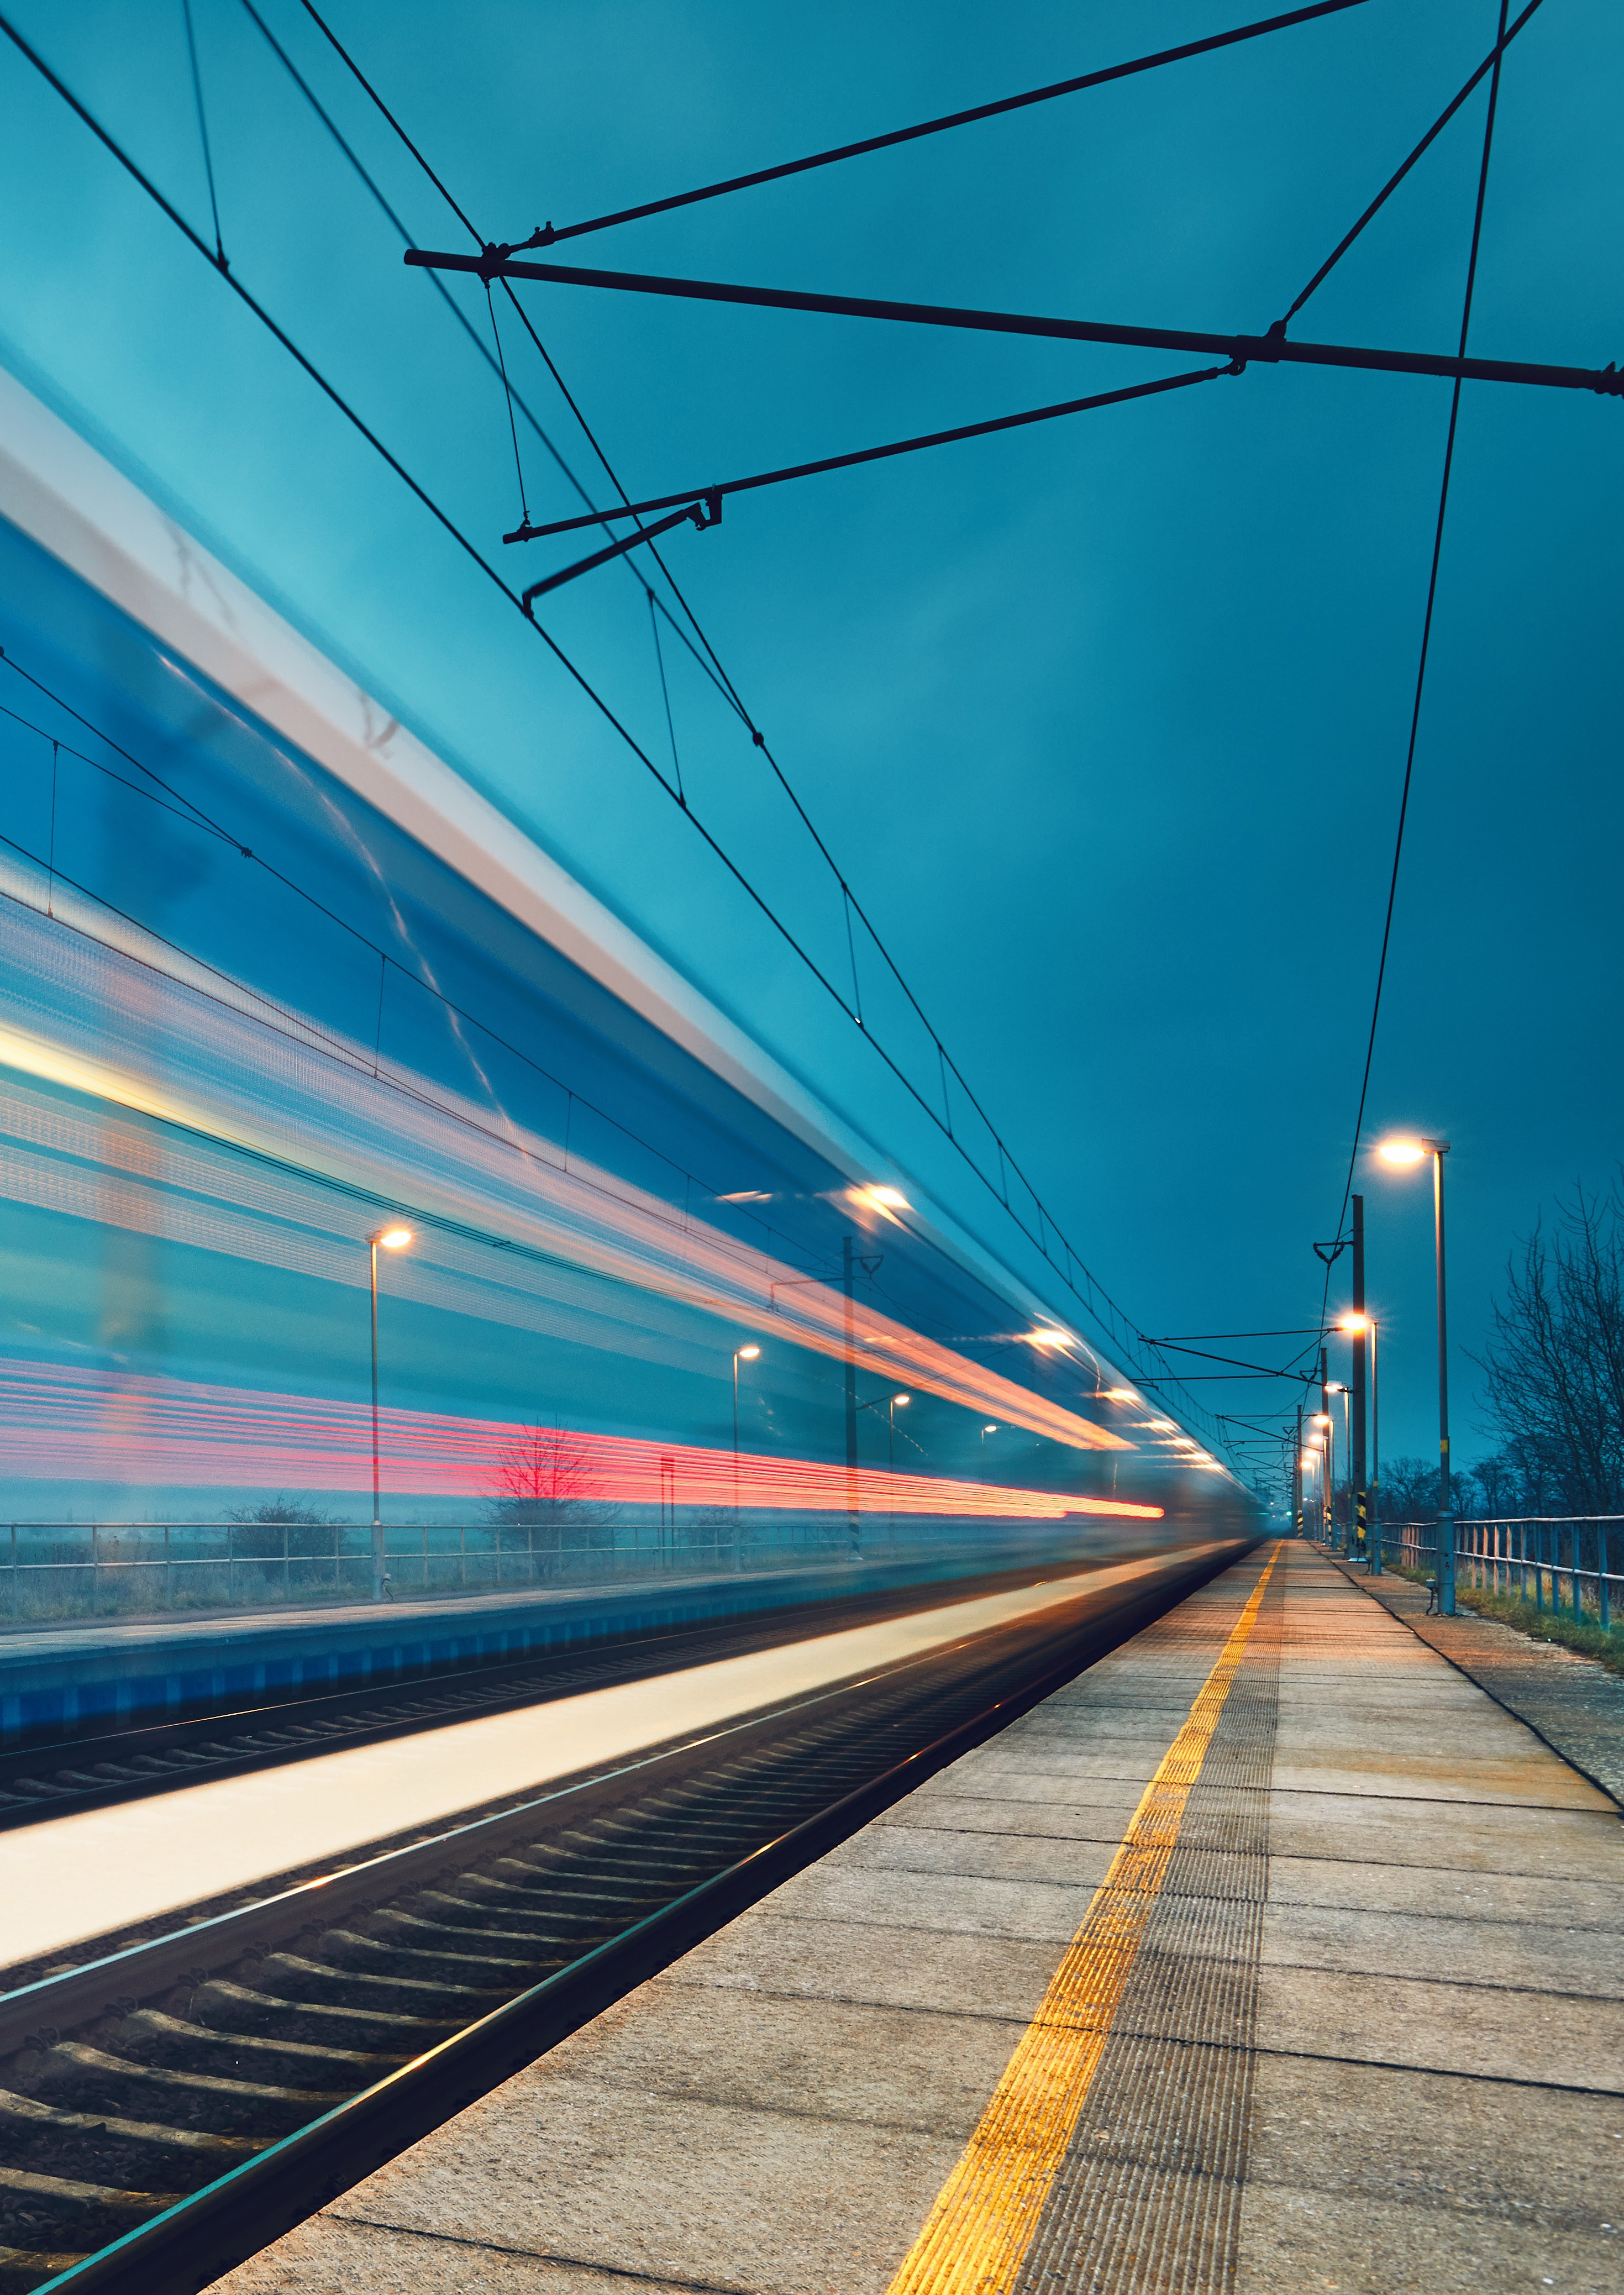
Rail has been a key component of the Wellington Region’s transport network for more than 150 years.
The first rail line was built in the 1870s between Wellington and Wairarapa. What is now known as the
North Island Main Trunk followed in the 1880s, providing a more direct route to Manawatū and the north.
Two branch lines were later added.
The region has grown around the rail network, as villages have turned into towns and cities. Much
of it was actively built around rail as transit-oriented development. Rail has become an increasingly
important way for people to move about, particularly to Wellington’s CBD, and services and
infrastructure have been continuously expanded and improved to serve an ever-growing population. The
region is a leader in per capita use of public transport.
Wellington Region Rail Timeline
1874
1927
1954
1982
2010
2021
First section of railway between
Hutt line deviation opened as a branch
Hutt line deviation to Manor
EM class electric
FP ‘Matangi’ class
Expected
Wellington and Petone
between Petone and Waterloo
Park, creating Melling line
multiple units
electric multiple
completion
1876
1955
introduced
units introduced
of Hutt line
1935
Hutt line to Upper Hutt
Hutt line duplication to Trentham
duplication,
Kāpiti line deviation to Tawa, creating
1983
1880
and electrification to Upper Hutt
Trentham to
Johnsonville line
Kāpiti line
2011
1
Wairarapa line to Masterton
Upper Hutt
1
Rimutaka Tunnel and deviation
electrification
Kāpiti line
2
1886
1938
replace steep Wairarapa line
8
9
extended from
duplication and
0
Kāpiti and Manawatū
Johnsonville line electrified and DM
over the Remutaka Range
Paekākāriki to
eletricification
7
line to Palmerston North
class electric multiple units introduced
5
1961
Paraparaumu
from Paraparaumu
2
0
1897
to Waikanae
1940
Kāpiti line mostly duplicated
0
0
Wairarapa line
to Paekākāriki (excluding
extended to Woodville
Kāpiti line electrified to Paekākāriki
section south of Paekākāriki)
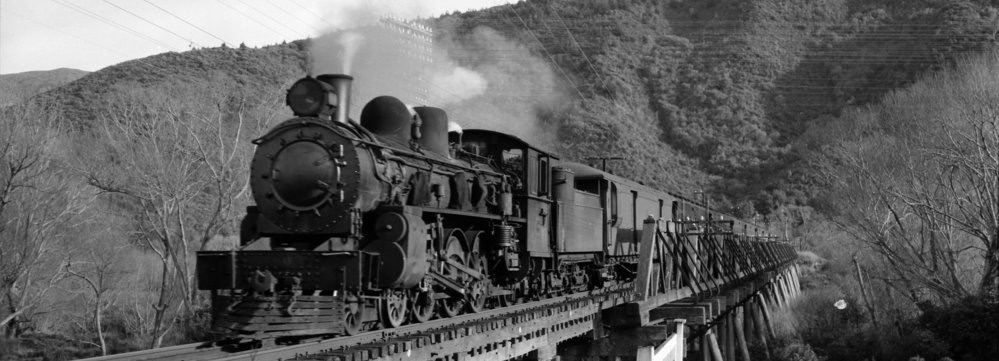
Old Silverstream bridge 1953
Photo: Derek Cross - Upper Hutt City Library Heritage Collections
2 / WELLINGTON REGIONAL RAIL STRATEGIC DIRECTION 2020
WELLINGTON REGIONAL RAIL STRATEGIC DIRECTION 2020 / 3
Wellington Region Rail Map
to Auckland
to Hawkes Bay
Where we are now
Palmerston North
MUL
The Wellington Region Rail map (previous page) shows the main elements of today’s network, which
includes the Wairarapa and Hutt lines, the Manawatū and Kāpiti lines as part of the North Island Main
Trunk, and branches to Johnsonville and Melling. This network is electrified south of Upper Hutt and
Shannon
Waikanae, providing a low carbon transport option.
Levin
Wellington Region Rail Annual Patronage
About 75 percent of Wellington Region’s
Otaki
Masterton
16,000,000
population lives north of the Wellington
Renall Street
14,000,000
CBD. The rail network forms the backbone
Waikanae
Solway
Carterton
of their public transport network and a
12,000,000
Matarawa
key link to Wellington’s CBD.
425,000
Woodside
10,000,000
Featherston
residents of this area are served by 2,250
Metlink commuter trains in a typical
8,000,000
Paraparaumu
WRL
week. They make about
42,000 trips
Maymorn
6,000,000
per weekday (at peak) and more than
Upper Hutt
Paekakariki
14.3 million passengers per year. Rail
4,000,000
Wallaceville
currently accounts for
41 percent of peak 2,000,000
Manawatu Line/North
trips from the north (18 percent of all
Trentham
MUL
KPL
Island Main Trunk
0
peak trips) to the Wellington CBD where
Heretaunga
1995
2000
2005
2010
2015
2020
40 percent of jobs are located.
Silverstream
KPL Kapiti Line
Pukerua Bay
More than 100 KiwiRail freight trains and 16 inter-regional passenger trains also use the rail network in a
Manor Park
HVL
WRL Wairarapa Line
typical week, connecting Wellington with points to the north, the port, and the South Island via interisland
Plimmerton
ferry connections.
Mana
Wairarapa Line
Pomare
WRL (freight only)
This regional rail system is critical to the regional and national transport systems providing:
Taita
Paremata
Wingate
• A primary means of access for many people
MEL
Naenae
HVL Hutt Valley Line
• Significant transport system capacity
Porirua
Epuni
Melling
• Transport system resilience
Keneperu
Waterloo
MEL Melling Line
• Freight connections that are vital to the national rail system
Linden
Western Hutt
Woburn
Tawa
Ava
JVL Johnsonville Line
Rail’s importance has been demonstrated by several low frequency, high consequence events over the last decade,
Redwood
where temporary closure of rail lines had significant and widespread transport system and economic impacts.
Takapu Road
Petone
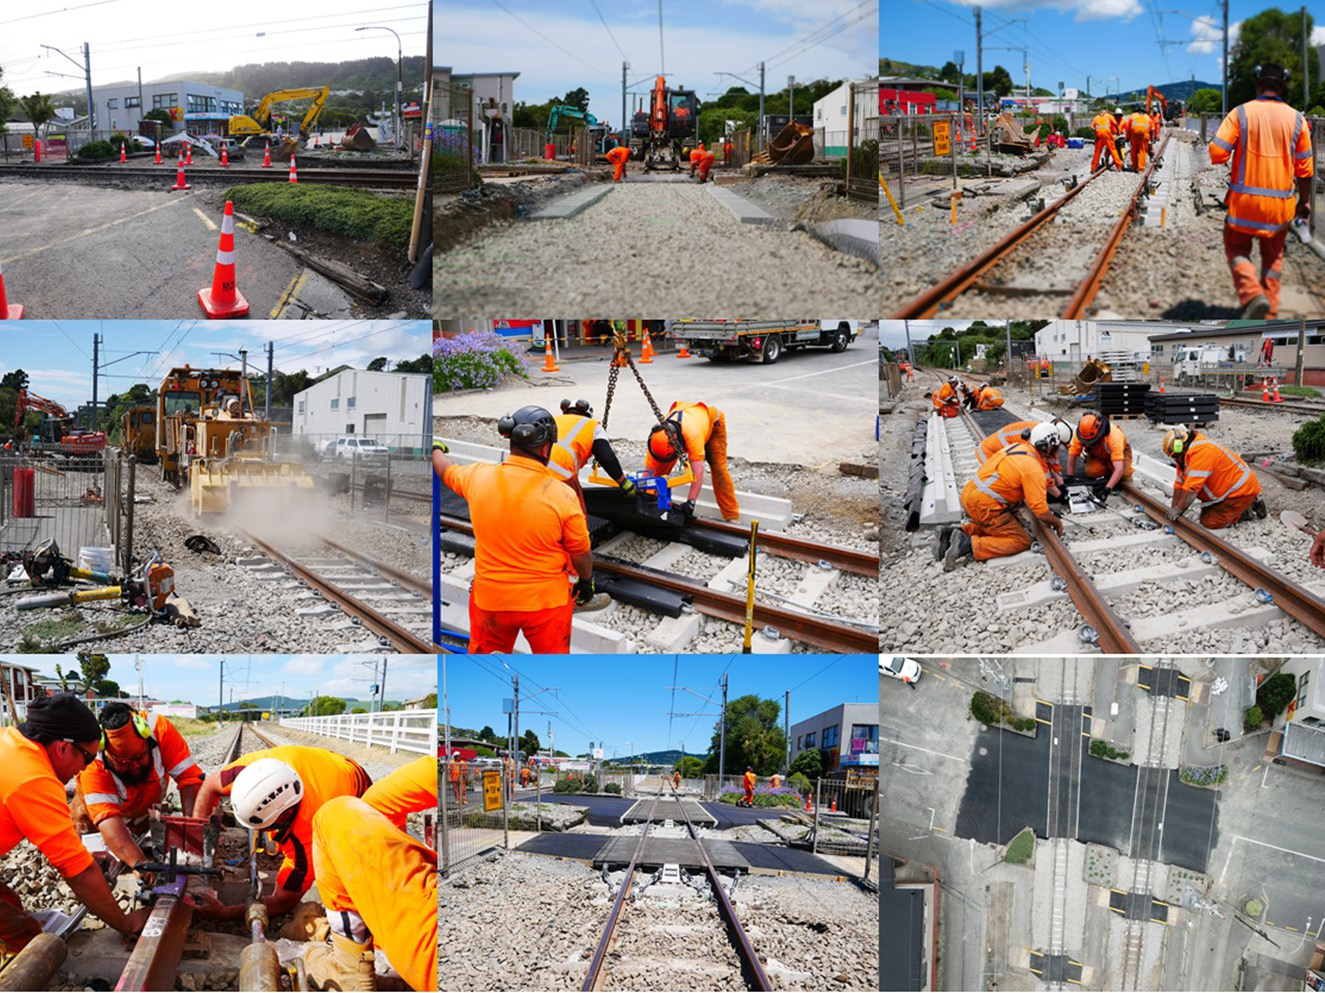
The regional rail system has been the subject of significant investment in the last decade, primarily to
Other Rail Lines
Ngauranga
address underinvestment in the previous 20 years, including:
• Replacement passenger rolling stock (electric multiple units and locomotive-hauled carriages)
• Double tracking and electrification to Waikanae
Johnsonville
Interisland Connection
• Track and signal upgrades
• Station upgrades
Khandallah
Wellington Region
• Improved Smarter Connections - particularly increased park & ride, and cycle storage facilities and capacity
Raroa
Simla Crescent
to Picton/Christchurch
Boundary
Wellington
Box Hill
This investment has resulted in
substantial patronage growth – more than
20 percent over the last
Ngaio
decade (twice the rate of population growth) and nearly
6 percent in the 2018-19 year alone.
Awarua Street
JVL
Crofton Downs
Investment continues, including further replacement of life-expired assets, capacity/ resilience upgrades,
further double tracking, and other infrastructure improvements to enable peak frequency improvements and
optimise fleet utilisation. However, much more needs to be done to allow rail to support regional growth.
4 / WELLINGTON REGIONAL RAIL STRATEGIC DIRECTION 2020
WELLINGTON REGIONAL RAIL STRATEGIC DIRECTION 2020 / 5
Rail capacity and service levels will need to increase to respond
to the RLTP targets. To do this, the MSP anticipates that current
initiatives will need to be completed, including proposed
9.7
improvements to signalling and longer distance services to
Masterton and Palmerston North. The MSP supports detailed
Million
planning of further rail network improvements.
2019 - annual
peak journeys
The RLTP targets equate to 13.6 million peak passengers by 2030
(compared to 9.7 million in mid-2019). This is considered a stretch
target due to COVID-19 impacts and long lead times for infrastructure
and rolling stock. However, the Let’s Get Wellington Moving (LGWM)
initiative, which focuses on the area south of Wellington Station,
40%
includes plans to increase system-wide demand for public transport.
Modelling undertaken by LGWM assumes peak rail patronage will
increase in mode
rise to 14.2 million by 2035. This target is achievable if the planning
shift to active and
process starts soon.
public transport
mode
Where we're headed
30%
The new Wellington Regional Growth
Waka Kotahi NZ Transport Agency recently
reduction in
transport generated
Framework (RGF) spatial plan developed by
completed a draft Regional Mode Shift Plan (MSP),
carbon emission
territorial authorities in the region, Horowhenua
which has been endorsed by the Regional Transport
District Council, central government and iwi
Committee. The MSP seeks to increase the combined
shows a population growth scenario of 200,000
active and public transport mode share of journey
over the next 30 years.
to work trips by 40 percent (from 31 percent
to 45 percent) by 2030, which reflects the draft
The RGF indicates that over 75 percent of this
Regional Land Transport Plan (RLTP) 2021 targets.
14.20
increase is likely to occur along the eastern
This includes a 30 percent reduction in transport-
and western growth corridors north of the
Million
generated carbon emissions over that period. Rail
Wellington CBD, which extend to Masterton and
currently accounts for 30 percent of all active mode
2035 peak annual
Levin (in the Manawatū-Whanganui region),
and public transport journey to work trips.
patronage
respectively.
Investment logic mapping for the new Regional Rail Plan (RRP) identified
The growth corridors reflect the primary rail
Rail Catchment Population
the following issues that must be addressed to support these objectives:
corridors, as shown in the table on the right.
Rail Line
Journey
2018
2051
Duration
Actual
Forecast
Growth
Rail, as a rapid transit service, is identified
1
2
3
Manawatū and
as a key enabler of regional growth, through
Kāpiti
30 plus*
154,200
222,200
44%
intensification around railway stations and
Porirua and
Inconsistent customer
improved connections to stations.
Tawa
under 30
67,600
85,000
26%
Current infrastructure
journey experience and
The condition and
is not capable of safely
limited rail system capacity,
Wairarapa and
The RGF recognises that rail capacity
configuration of the rail
Upper Hutt
30 plus
109,100
130,500
20%
which constrains the rail
upgrades will be necessary to enable and
accommodating
network makes it
system’s ability to meet
additional trains, which
vulnerable to service
meet the resulting demand and identifies
regional mode share
Lower Hutt
under 30
85,000
99,600
17%
restricts the options
targets and, consequently,
disruptions, which has a
access improvements at Wellington
available to accommodate
the associated regional
flow on impact into the wider
Station, elimination of the single track
Johnsonville
under 30
38,800
45,200
16%
future demand.
growth and environmental
transport system.
section between Pukerua Bay and
obligations.
Paekākāriki and service improvements
Total
454,700
582,500
28%
north of Waikanae as being key.
*in minutes
6 / WELLINGTON REGIONAL RAIL STRATEGIC DIRECTION 2020
WELLINGTON REGIONAL RAIL STRATEGIC DIRECTION 2020 / 7
 What we need
to address
What we need
to address
To make this a reality, the following improvements, and steps to get there are required to provide the
needed capacity and make rail the preferred choice of travel:
Improvements
Steps to Improvements
Improvements to peak and off-peak frequency
Renew behind-the-scenes rail network
to make rail more convenient and accessible
infrastructure to enable more frequent services
Improvements to rail capacity
Buy more trains to operate at higher
to make rail more comfortable
frequencies and bigger trains at peak times
Improvements to rail reliability
Reduce the probability of
to make it more dependable
disruptions and cancellations
Improvements to overall access and station facilities to
Station improvements that include easier access by a
make the end to end experience more enjoyable
range of modes, such as better access for those less able
and expanded shelter during poor weather
Addressing these issues will enable us to achieve our vision of a rail system that
provides safe, customer focused and efficient rail passenger and freight services, and
supporting infrastructure, to drive the region’s economic development and social
To support this, we propose the following investment pathway
wellbeing in an environmentally and socially sustainable and resilient manner.
for the new RRP:
• Aid mode shift, through capacity improvements and increased service frequency by:
The ultimate goal is to make rail the main way for people to move between
communities north of and into the Wellington CBD by providing:
—
Completing planned network capacity and frequency improvements in 2023, to
provide short term capacity increases
Highly connected stations in communities
Accommodating stations that make any
—
Replacing aging trains and refining service levels on long distance Masterton and
where people work, live, play and learn
wait both pleasant and productive
Palmerston North services by 2027, to meet customer demand and service
expectations (fleet decarbonisation will also be a consideration)
Payment options that make for
Frequent services that are faster
• Improve network safety by upgrading the signalling system to meet modern safety
a seamless travel experience
and more convenient than by car
standards and enable future frequency by 2028
• Minimise transport conflicts and safety risks by undertaking a level crossing
programme from 2021 – 2030
Reliable services that recover
Links that facilitate convenient connections
quickly from disruption
for national freight customers
• Upgrade customer experience to aid mode shift through station facility and access
improvement programme from 2021 – 2030
Infrastructure and safety systems that
An overall package that exceeds customer
• Provide value for money operational and asset management and planning
enable transport without undue conflict
expectations, providing high satisfaction
through continuous improvement of systems, processes and capability.
WELLINGTON REGIONAL RAIL STRATEGIC DIRECTION 2020 / 9
8 / WELLINGTON REGIONAL RAIL STRATEGIC DIRECTION 2020
• Complete the following investigations by 2024, to ensure that improvements can be delivered within
the required timeframes:
ation
ation
ation
tig
— Capacity improvements to meet and encourage anticipated mode shift - will
es
Inv
Potential Implement
Implement
t
require changes in capacity and frequency in 2030 and 2040. Key areas of focus are
Y S
likely to be:
VEMENT
Traction power supply to facilitate and enable future peak train demand
and EMU flee
Y IMPRO
xp
THIRD DECADE
CIT
Remaining sections of single track to unlock passenger and freight capacity on
A
y:
e & e
Kāpiti line to Waikanae and between Pukerua Bay and Paekākāriki
Ke
& CAP
(10 year lead time, earliest 2030)
2040
2040
2040 - 46: PEAK FREQUENC
Replac
Track capacity and flexibility at Wellington Station and the freight terminal
junction at Kaiwharawhara (10-year lead time, earliest 2030)
2040
The electric multiple unit fleet needed to aid capacity and frequency by 2030
and 2040 as part of the existing Matangi fleet replacement
S
Future freight frequency and capacity needs
VEMENT
OND DECADE
— Operational reliability and resilience requirements to meet customer expectations
Y IMPRO
SEC
— Lifeline resilience requirements to support risk management
S
2030
FREQUENC
— Service level needs outside peak periods for increase in mode shift and
VEMENT ANCE
2030
2030
2030
2030: PEAK & OFF PEAK 2030
T
transport system decarbonisation
s
ability
ONG DIS
— Network access opportunities through additional stations and/or station
VICE IMPRO
2028
s
ap
SER
traint
optimisation, including the Melling Line
2027: L
ades
ons
t
VICE
S
ovement
— Opportunities to assist with regional urban development as identified in the RGF by supporting
er upgr
ork c
esses and c
2026
w
oc
transit orientated development
tw
s
e impr
VEMENT
s
e ne
• Deliver preferred solutions identified through the investigation and business case processes
tion po
and EMU flee
IMPRO
tems, pr
ST DECADE
outlined above.
2023: PEAK SER
ovement
Resilienc
Trac
Reduc
Exp
es
FIR
ovement
tiv
e
ety impr
cess impr
2024
2024
2024
ovement of sys
tur
o enable
and long
ades
2023
truc
e t
xp t
as
tur
ey initia
ossing saf
acility & ac
truc ains
e & e e flee
S1’ Infr
as w tr
tanc
ay - K
‘R
Infr ne
Replac dis
Signalling upgr
Level cr
Station f
Continuous impr
e
ent es
ove
es
er
er
long
athw
timise
vic
tanc vic
curr
Deliv mode shift
Deliv quality
Op
ser
Impr
dis ser
T
TIMELINE
tment p
W
VATE
es
TIMISE
GRO
OP
Inv
CONNEC
INNO
10 / WELLINGTON REGIONAL RAIL STRATEGIC DIRECTION 2020
WELLINGTON REGIONAL RAIL STRATEGIC DIRECTION 2020 / 11


The investment pathway will meet the 2035 LGWM rail patronage target despite the expected
short-medium term impact of COVID-19.
Investment Pathway Projected Peak Patronage
Hist
Hisor
t ic Pe
oric P a
e k
ak
Lo
L ng Te
ong T rm Tr
erm Ten
r d
end
Base Po
Base P pulat
opulaion
tion
Driving Gro
Driving Gr wth
owth
Investme
Inves nt Pa
tment P th
a wa
thw y
ay
LG
L WM Mo
GWM A de Shi
ssumpft Ta
tion rget
20,000,000
18,000,000
16,000,000
14,000,000
12,000,000
10,000,000
8,000,000
6,000,000
COVID-19 Impact
4,000,000
2,000,000
0
1995 2000 2005 2010 2015 2020 2025 2030 2035 2040 2045 2050
These investments have long lead times between 6-10 years, so planning needs to start now if they are
The RRP and its outcomes are summarised below:
to be available when needed to support regional (and national) growth, decarbonisation and mode
shift objectives.
PROBLEM
INITIATIVE
Inconsistent customer journey experience
A station access and facility
Affordability for key funding stakeholders is likely to be an issue. The proposed investment pathway has
and limited rail system capacity
improvement programme
been staged to provide service improvements when required, and infrastructure improvements only
Current infrastructure is not capable
Improving the power supply
when needed to support service improvements.
of safely accommodating
to the trains
Replacing the signalling system
additional trains
Additional train capacity
The condition & configuration
Further work is underway to determine the detail of the investment programme, including costs.
Improving level crossings
of the rail network makes
Continuing double tracking
it vulnerable to service
Improving track layouts
This investment pathway supports the strategic
disruptions
Improving rail network
direction laid out in the:
condition
Improved
Government Policy Statement of Land
systems &
BENEFIT
OUTCOME
Transport 2021-31
capability
Mode shift
Makes accessing the rail
National Land Transport Plan 2018-21
Improved access
network easier
(currently being updated)
A sustainable future
Improves the waiting
Draft New Zealand Rail Plan 2019
Improved safety for all
experience
Wellington Regional Land Transport Plan 2018
Rail is adaptable to disruptions
Reduces our carbon footprint
(currently being updated)
Rail is attractive and easy to use
Allows bigger trains
Wellington Regional Public Transport Plan
An effiecient and resilient
Allows more frequent trains
2014 (currently being updated)
transport system
Improves safety of the network
Draft Wellington Regional Growth
Capacity to support growth and
Fewer rail closures and improved
Framework 2020
development
ability to recover when closures occur
Wellington Regional Mode Shift Plan 2020
Previous Wellington Regional Rail Plans
12 / WELLINGTON REGIONAL RAIL STRATEGIC DIRECTION 2020
WELLINGTON REGIONAL RAIL STRATEGIC DIRECTION 2020 / 13
 14 / WELLINGTON REGIONAL RAIL STRATEGIC DIRECTION 2020