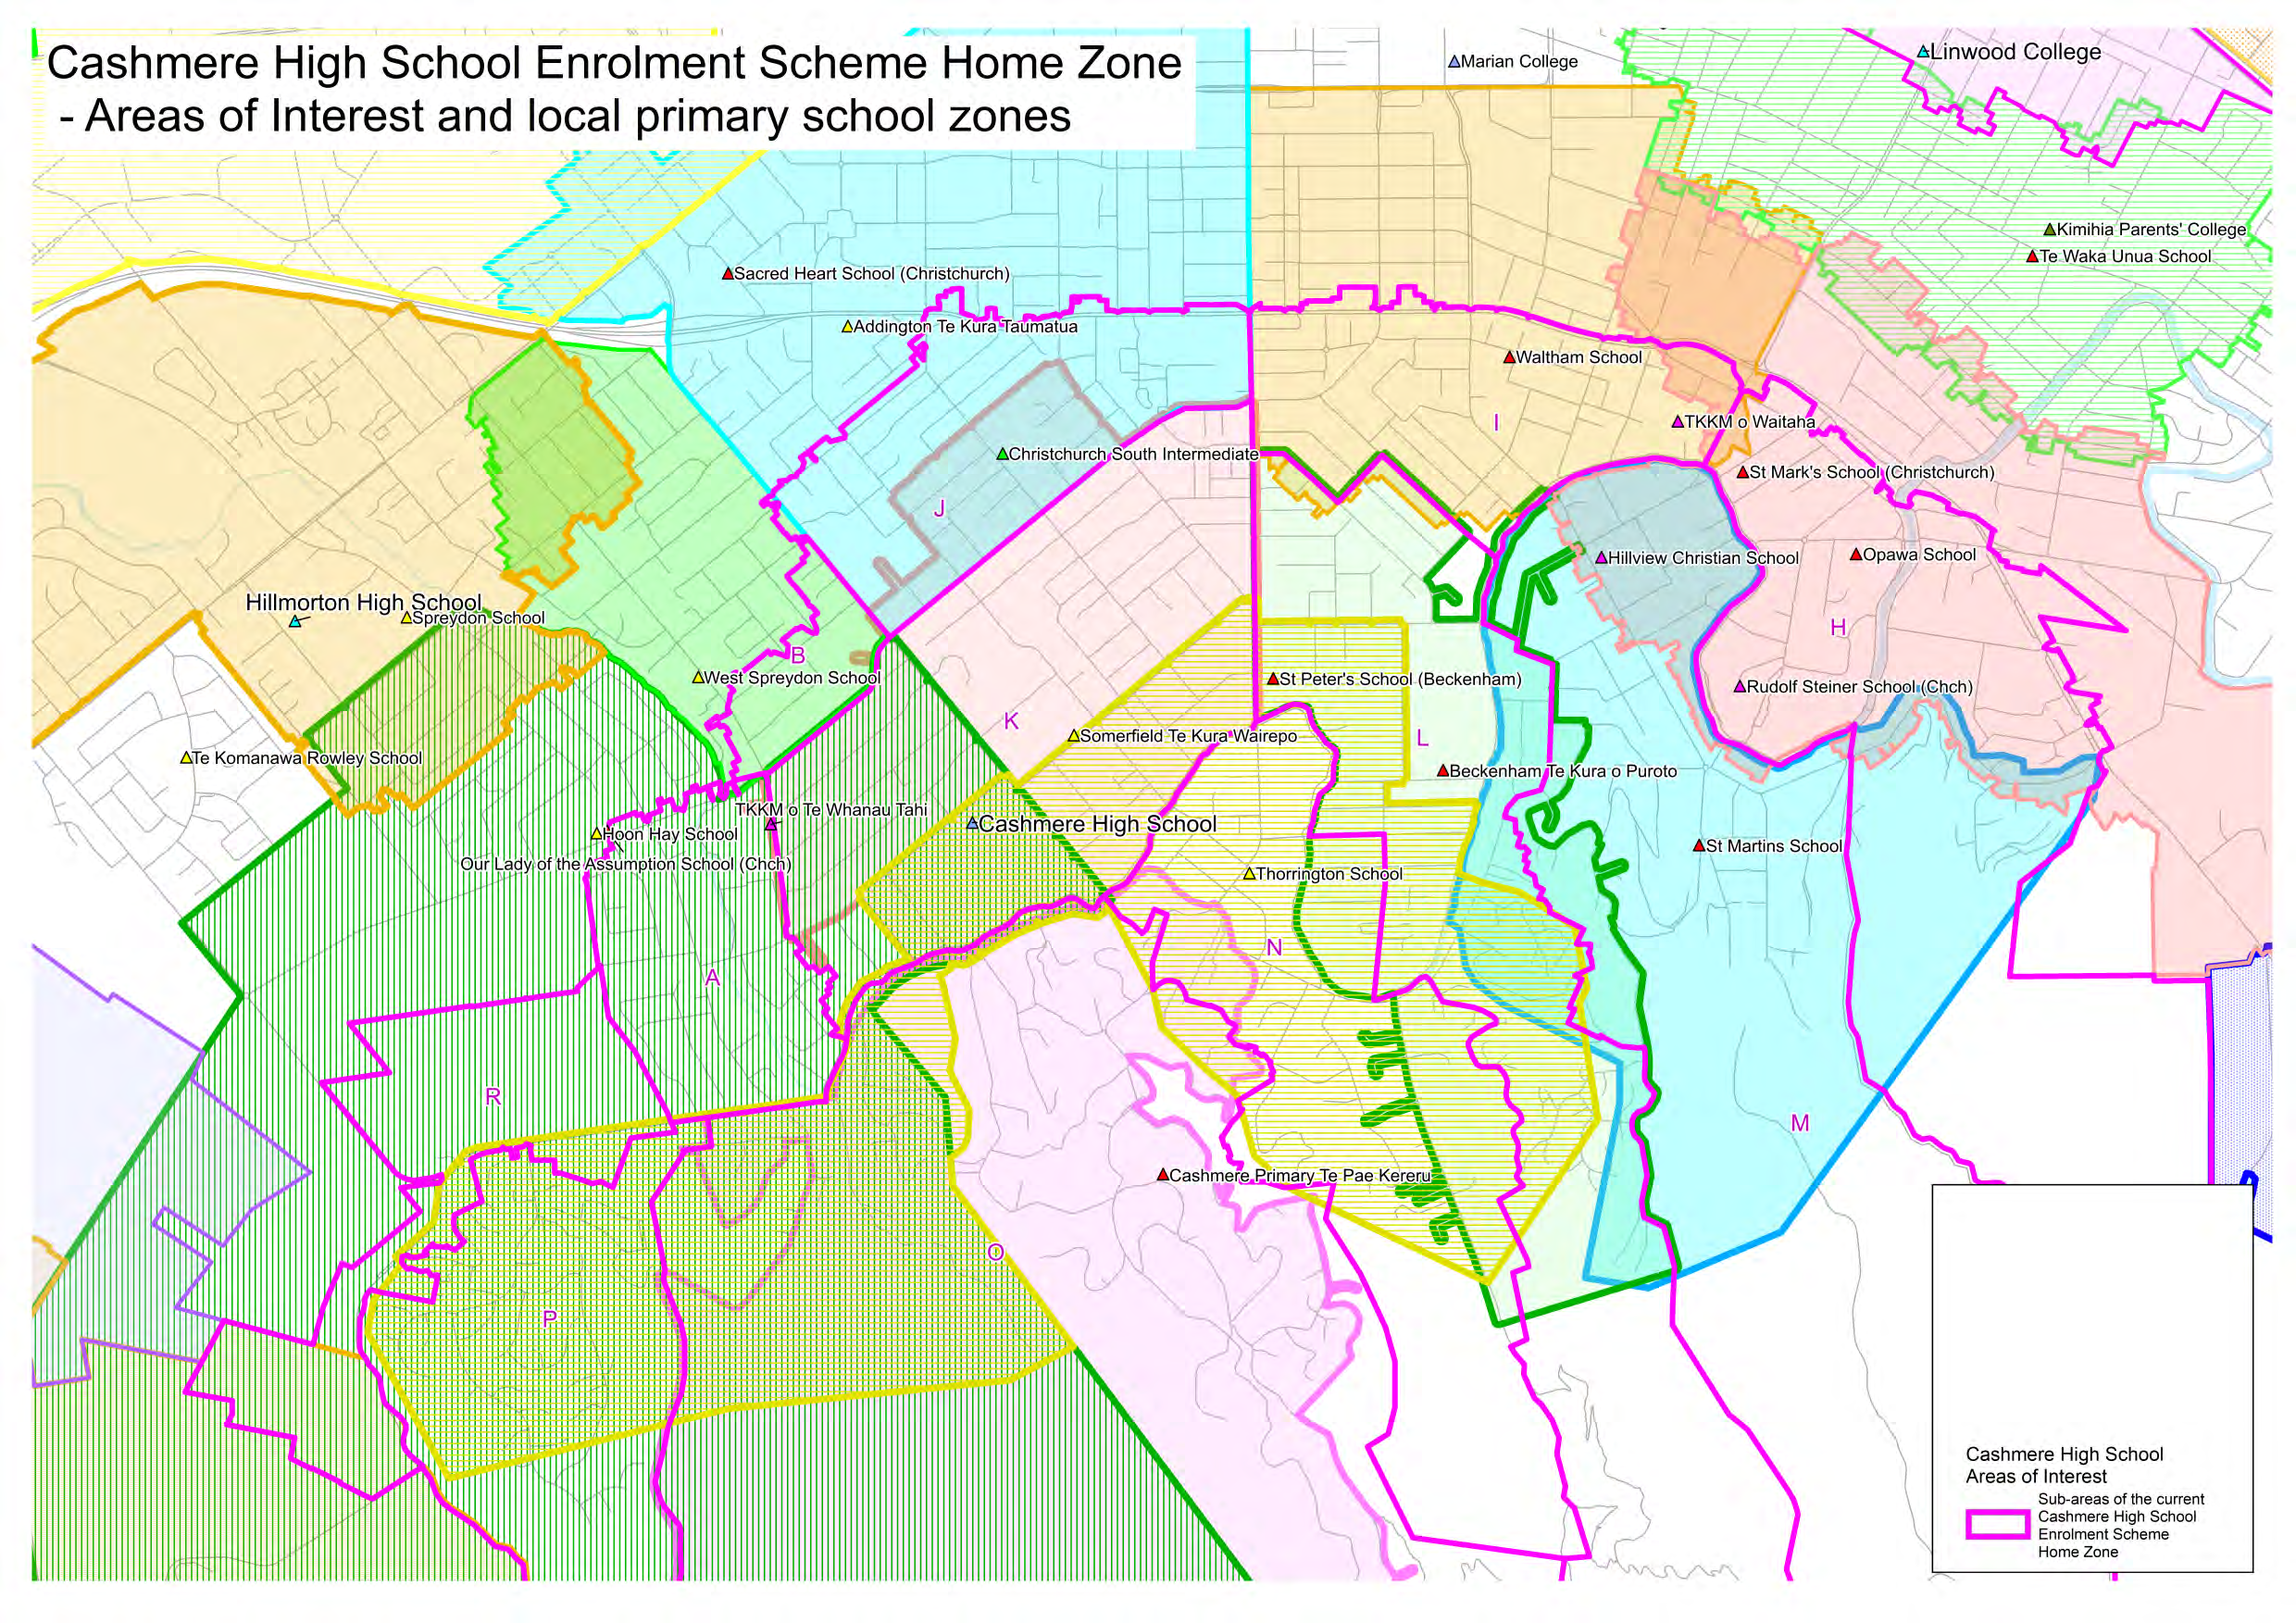
Count of State School Students within the
Cashmere High School Enrolment Scheme Home Zone at March 2019
(data prepared September 2019)
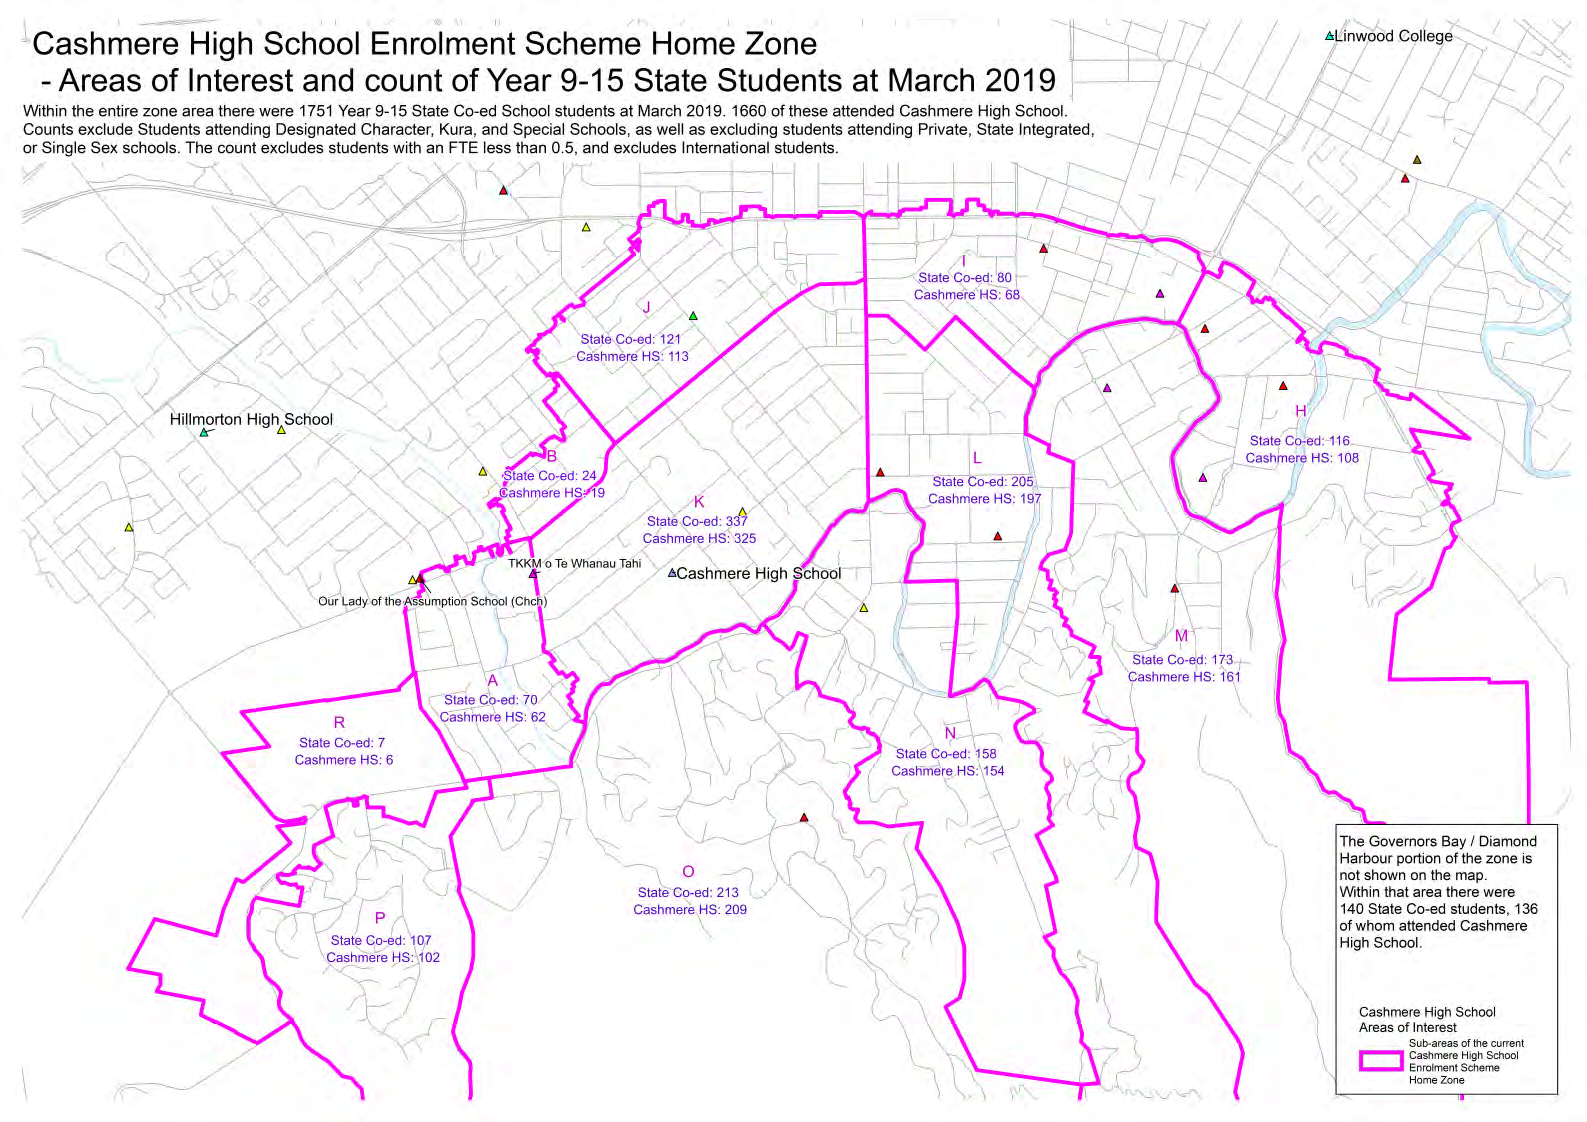
Within the entire Cashmere High School enrolment scheme home zone area there were
1748 Year 9-15 State Co-ed School students at March 2019. Of these, 1660 (95%)
attended Cashmere High School.
1982
Students attending Designated Character, Kura, and Special Schools, as well as students
attending Single Sex schools are identified separately in the attached table.
Act
Note that Schools with a high market share (such as Cashmere High School) also carry a
large number of "in-zone" students who have moved out of the zone but continue to attend
the school. This can result in 15% of a schools in-zone enrolments residing outside the
zone.
For this reason, the Cashmere High School zone should be designed to contain no more
than 1550 Year 9-15 state co-ed students. This will allow the roll to return to within the
Build Capacity over time.
Information
“Grand-parenting” provisions are expected to be included for siblings of current students in
any zone reduction, but will delay the return of the roll to within capacity.
Previous work has projected the local secondary age population to increase over the short
term, as a large cohort of children progress through primary year levels and into Years 9+.
This will increase the number of in-zone enrolments at Cashmere in future years.
Official
There are some areas of residential development within the core part of the Cashmere High
School zone. While areas of new residential development have generated a large number of
the
primary age children in most areas of recent residential development, the development
areas in the core Cashmere area may be more likely to be occupied by secondary age
children.
The table on the following page shows the count of state students within each portion of
under
the zone. Of most interest are the columns “State Co-ed only” and “Cashmere High
School”.
It is expected /assumed that the same proportion of students will attend Single Sex,
Designated Character, Kura, and Special schools in the future, as these schools offer a
distinctly different type of education, and these can be discounted from estimates of local
demand for Cashmere High School.
Released
1
Count of State School students by Area, March 2019
Areas defined are based on those used in previous analyses
1982
All State
State Students Excluding Designated
Cashmere High
Area
Students
Character, Kura, Special Schools
State Co-ed only
School
Comment
A
93
72
70
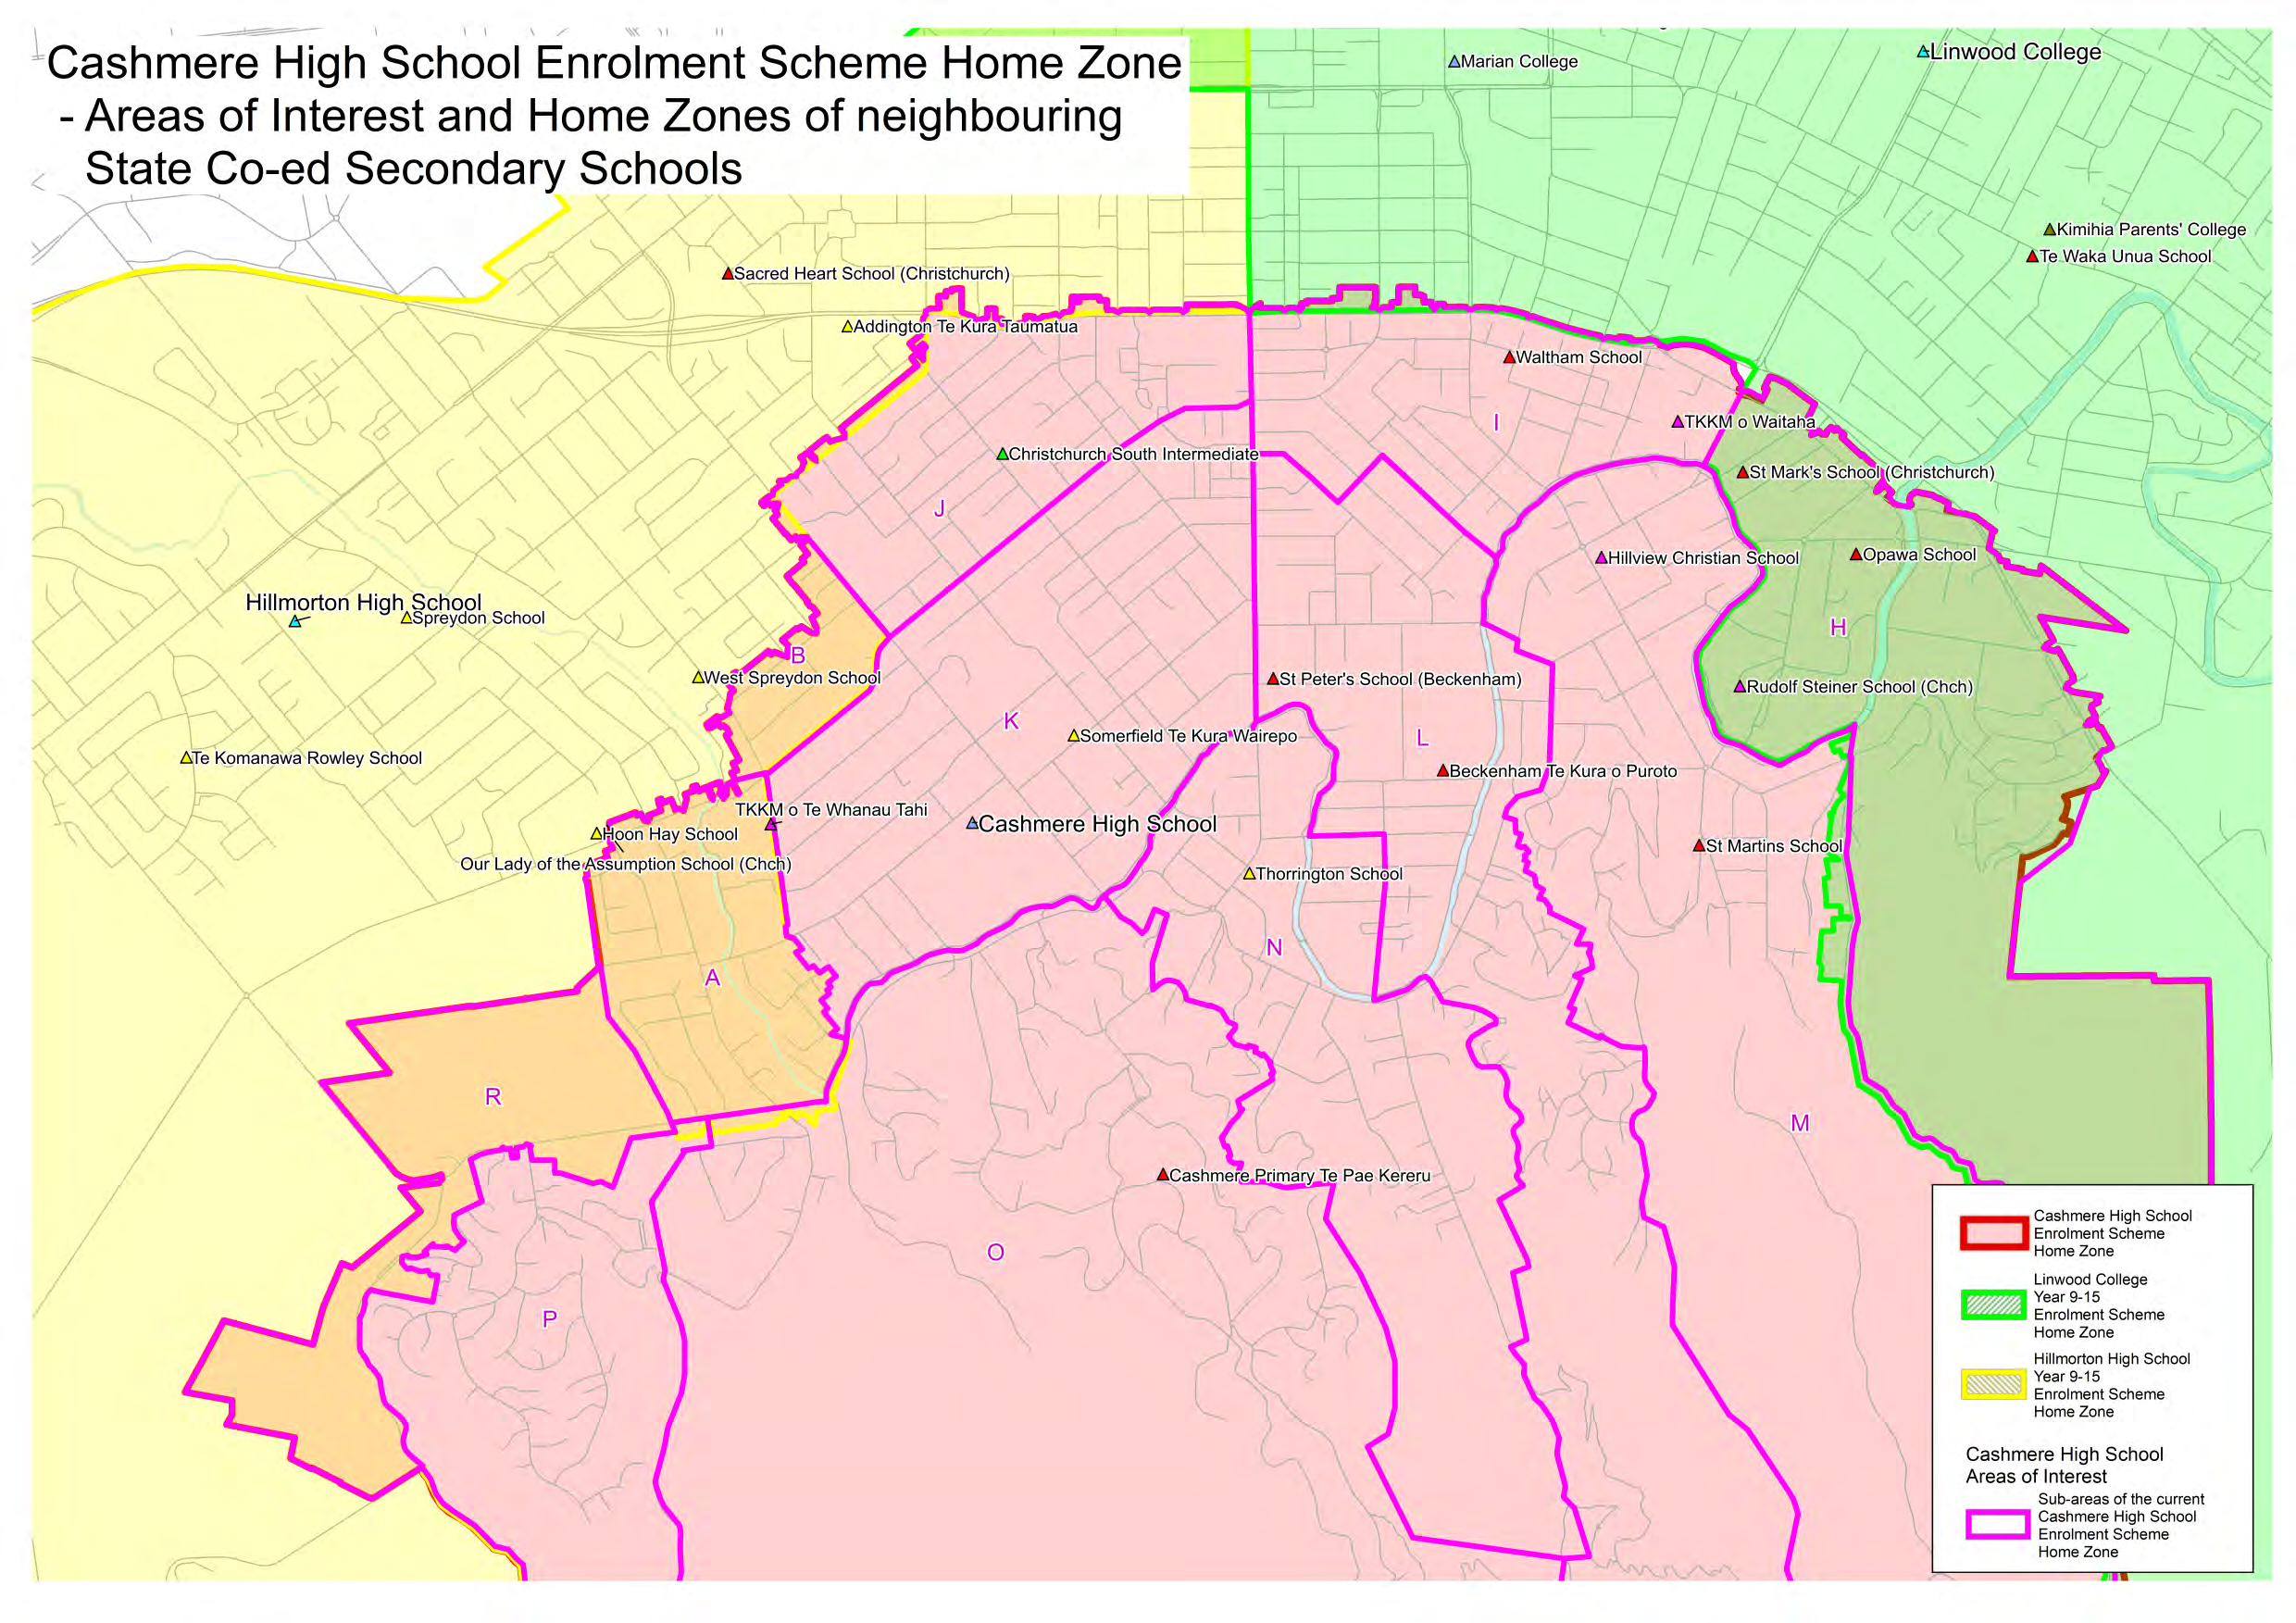
62 Overlap with Hillmorton High Zone
Act
B
36
26
24
19 Overlap with Hillmorton High Zone
H
149
124
116
108 Overlap with Linwood College Zone
I
112
85
80
68
J
162
133
120
113
K
419
352
336
325
L
269
219
204
197
M
232
181
173
161
N
206
171
158
154
O
263
235
213
209 Residential development underway
Information
P
125
119
107
102
Q
175
149
140
136
R
9
8
7
6 Overlap with Hillmorton High Zone
Grand Total
2250
1874
1748
1660
All State school
State Co-ed and Single Sex school
Cashmere High
Includes
State Co-ed school students
students
students
School Students
Official
Private School
Private and Integrated, DC,
Excludes
Private and Integrated, Designated
All other schools’
and Integrated
Kura, Special School and
Character, Kura, Special School students
students
School students
Single Sex school students
Note: All counts exclude students attending Private or State Integrated Schools.
the
All counts exclude students with an FTE less than 0.5, and exclude International students.
Note: correction made from previous data pack to remove 3 students from the State Co-ed count who do not attend a Co-ed School
under
2
Released
Local demand by year level and area of interest (March 2019)
1982
The school has requested further data relating to local demand by year level.
Current local population by Funding Year Level and area of interest (March 2019):
Act
Including
All School Authorities and Types, but excluding International students and those with an FTE<0.5.
Area
1
2
3
4
5
6
7
8
9
10
11
12
13 Grand Total
A
20
21
23
20
28
20
31
21
18
23
21
15
20
281
B
10
7
8
8
8
6
11
6
7
9
8
6
2
96
H
17
23
40
35
33
32
50
46
46
43
40
38
37
480
I
28
44
45
38
32
44
43
29
36
22
25
28
26
440
J
21
37
31
44
34
23
46
49
42
34
26
29
35
451
K
52
77
89
98
85
84 121
89
86 107
90
87
72
1137
L
50
65
67
54
77
62
69
75
52
51
64
65
65
816
Information
M
45
60
62
47
61
65
60
64
68
60
57
50
46
745
N
27
48
44
40
54
45
56
48
44
48
51
40
40
585
O
33
60
60
52
64
77
66
65
68
82
66
57
87
837
P
14
27
17
26
35
34
32
32
33
30
36
27
24
367
Q
15
25
34
32
42
39
49
43
42
39
49
35
36
480
Official
R
2
4
2
5
3
4
2
5
2
2
2
33
Grand Total
332 496 520 498 555 536 637 571 544 553 535 479 492
6748
Note that due to the way in which Funding Year Level is allocated, the Year 7 cohort is always higher than the Year 6 cohort the previous year and the Year 8
the
cohort the next year. This is due to the retention of Year 7 students at contributing (Year 1-6) primary schools. These students are re-assigned Funding Year
Level 7 when they enrol at a Year 7+ provider.
Year 1 rolls are at their lowest point in March, and will increase during the year. Therefore, a low year 1 count at March does not indicate a decline in
demand.
under
The above table shows that the largest cohorts are in Years 5-10 (excluding Y7 as discussed above), with an average of around
550 students per cohort. This has contributed to large Year 9 cohorts at CHS in 2018 and 2019.
This increased demand at Year 9 is expected to be sustained for several years, based purely on the number of currently resident
students (without factoring in anticipated household growth rates).
3
Released
The following table shows the count of state co-ed school students only.
1982
Current local Co-ed population by Funding Year Level and area of interest (March 2019):
Including
Co-ed schools only, also excluding International students and those with an FTE<0.5.
Area
1
2
3
4
5
6
7
8
9
10
11
12
13 Grand Total
Act
A
19
15
19
14
21
16
26
17
13
16
15
10
16
217
B
9
7
6
7
8
5
11
5
6
8
5
4
1
82
H
13
16
23
26
23
23
30
34
29
25
21
20
21
304
I
22
33
37
29
23
37
34
24
26
15
11
16
12
319
J
15
29
25
31
26
21
40
43
35
27
19
17
22
350
K
44
66
80
89
73
73 111
77
69
81
73
62
51
949
L
42
55
59
41
66
47
56
62
40
33
50
48
33
632
M
37
51
55
37
53
54
46
48
45
41
36
28
23
554
Information
N
25
46
38
36
49
44
46
40
28
40
41
28
21
482
O
29
49
52
45
57
64
51
48
46
51
36
33
47
608
P
10
22
15
21
29
23
25
24
25
19
30
16
17
276
Q
13
25
32
27
34
34
39
34
34
28
39
22
17
378
R
1
3
2
4
1
3
1
3
1
1
1
21
Grand Total
278 415 441 406 464 445 516 459 397 387 377 305 282
5172
Official
Note that due to the way in which Funding Year Level is allocated, the Year 7 cohort is always higher than the Year 6 cohort the previous year and the Year 8
cohort the next year. This is due to the retention of Year 7 students at contributing (Year 1-6) primary schools. These students are re-assigned Funding Year
the
Level 7 when they enrol at a Year 7+ provider.
under
4
Released
The following table shows the break-down of CHS students by area and Funding Year Level, and the CHS Co-ed market share for
each.
1982
CHS students by area and Funding Year Level at March 2019, and the CHS Co-ed market share for each area.
CHS Count by Funding Year level
CHS Market share of Co-ed count
Act
Area
9
10
11
12
13 Grand Total
Area
9
10
11
12
13 Grand Total
A
11
13
13
10
15
62 A
85%
81%
87% 100%
94%
89%
B
4
7
4
3
1
19 B
67%
88%
80%
75% 100%
79%
H
25
25
20
20
18
108 H
86%
100%
95% 100%
86%
93%
I
22
13
9
16
8
68 I
85%
87%
82% 100%
67%
85%
J
33
25
19
17
19
113 J
94%
93% 100% 100%
86%
94%
K
68
79
70
61
47
325 K
99%
98%
96%
98%
92%
97%
L
36
32
49
48
32
197 L
90%
97%
98% 100%
97%
97%
Information
M
39
39
33
27
23
161 M
87%
95%
92%
96% 100%
93%
N
27
40
39
27
21
154 N
96%
100%
95%
96% 100%
97%
O
45
49
35
33
47
209 O
98%
96%
97% 100% 100%
98%
P
24
18
30
13
17
102 P
96%
95% 100%
81% 100%
95%
Q
33
28
38
22
15
136 Q
97%
100%
97% 100%
88%
97%
R
1
3
1
1
6 R
100%
100% 100%
0% 100%
86%
Official
Grand Total
368 371 360 297 264
1660 Grand Total
93%
96%
95%
97%
94%
95%
The CHS Market share is lowest in areas B (79%), I (85%), R (86% - note small sample size), A (89%), with H and M at 93%.
the
Note that at March 2019, 54% of Year 7 state school students in Area A attended Hillmorton High School. It is unknown if these
students will wish to change schools at Year 9. At March 2019, only 18% of Year 8 students in area A attended Hillmorton. This
indicates a growing support for Hillmorton High from this area.
under
5
Released
Future population growth
Projecting the scale and timing of population growth is challenging. However, data currently available
indicates that there is likely to be an increased local demand for secondary education in the short term.
Projection series currently available are population projections from Statistics NZ and household projections
from the Christchurch City Council. Each series has its own characteristics, strengths and weaknesses.
CCC Household Projections
Projections of total household numbers
1982
No break-down by household type
o Significantly different student per household ratios across different areas / different housing
type.
Act
Household type may change as intensification / development occurs
Latest edition provided early 2019
Available at Meshblock level – can be aggregated to approximate each Area of Interest
StatsNZ projections;
Projections by age (equating to school year levels)
High, Medium, and Low variants
Latest issue late 2017
Incorporate 2013 census data and administrative data after that point
Available at the Census Area Unit level
Information
o Large areas, do not match Areas of Interest
CCC Household Projections
Household projections by area of interest
Official
Household count estimate
Percentage change from 2019 level
2019-
2019-
2019-
2019-
Area
2019
2024
2028
2038
2048
2024
2028
2038
2048
the
A
809
824
830
841
845
2%
3%
4%
4%
B
378
438
477
525
545
16%
26%
39%
44%
H
1161
1259
1330
1408
1440
8%
15%
21%
24%
I
1876
1996
2079
2291
2415
6%
11%
22%
29%
under
J
1379
1522
1620
1807
1905
10%
17%
31%
38%
K
3116
3300
3427
3595
3675
6%
10%
15%
18%
L
2313
2402
2457
2585
2657
4%
6%
12%
15%
M
1768
1828
1868
1920
1944
3%
6%
9%
10%
N
1346
1445
1511
1589
1625
7%
12%
18%
21%
O
1784
1876
1933
2012
2063
5%
8%
13%
16%
P
618
631
640
653
664
2%
4%
6%
7%
Q
1511
1636
1708
1837
1935
8%
13%
22%
28%
Released
R
162
209
248
313
363
29%
53%
93%
124%
Grand
Total
18221
19366
20128
21376
22076
6%
10%
17%
21%
6
Every area is projected to experience household growth. The total CHS zone area is
projected to experience 6% growth in households by 2024, and 10% growth from the 2019
level by 2028.
State co-ed Year 9-15 students in each area, student per household estimates, and projections assuming a
constant s/hh ratio at the 2019 s/hh ratio
for each area.
Area
Co-ed 2019
co-ed s/hh
2024
2028
2038
2048
A
70
0.09
71
72
73
73
B
24
0.06
28
30
33
35
1982
H
116
0.10
126
133
141
144
I
80
0.04
85
89
98
103
J
120
0.09
132
141
157
166
Act
K
336
0.11
356
370
388
396
L
204
0.09
212
217
228
234
M
173
0.10
179
183
188
190
N
158
0.12
170
177
187
191
O
213
0.12
224
231
240
246
P
107
0.17
109
111
113
115
Q
140
0.09
152
158
170
179
R
7
0.04
9
11
14
16
Information
Total
1748
0.10
1853
1923
2030
2088
The student per household ratio varies significantly between areas. Area P (Westmorland)
has the highest s/hh ratio of 0.17 students per household, while areas I and R have the
lowest at 0.04 s/hh. Note the small sample size for area R. Area R is an area of future
development.
Official
Overall, there is a s/hh ratio of 0.10 for the entire CHS zone.
the
Some of the areas with a low s/hh ratio will experience an increase in future years. Areas
with higher s/hh ratios may experience a decline in s/hh ratios as large cohorts move on to
further education or training, replaced by smaller cohorts.
under
Released
7
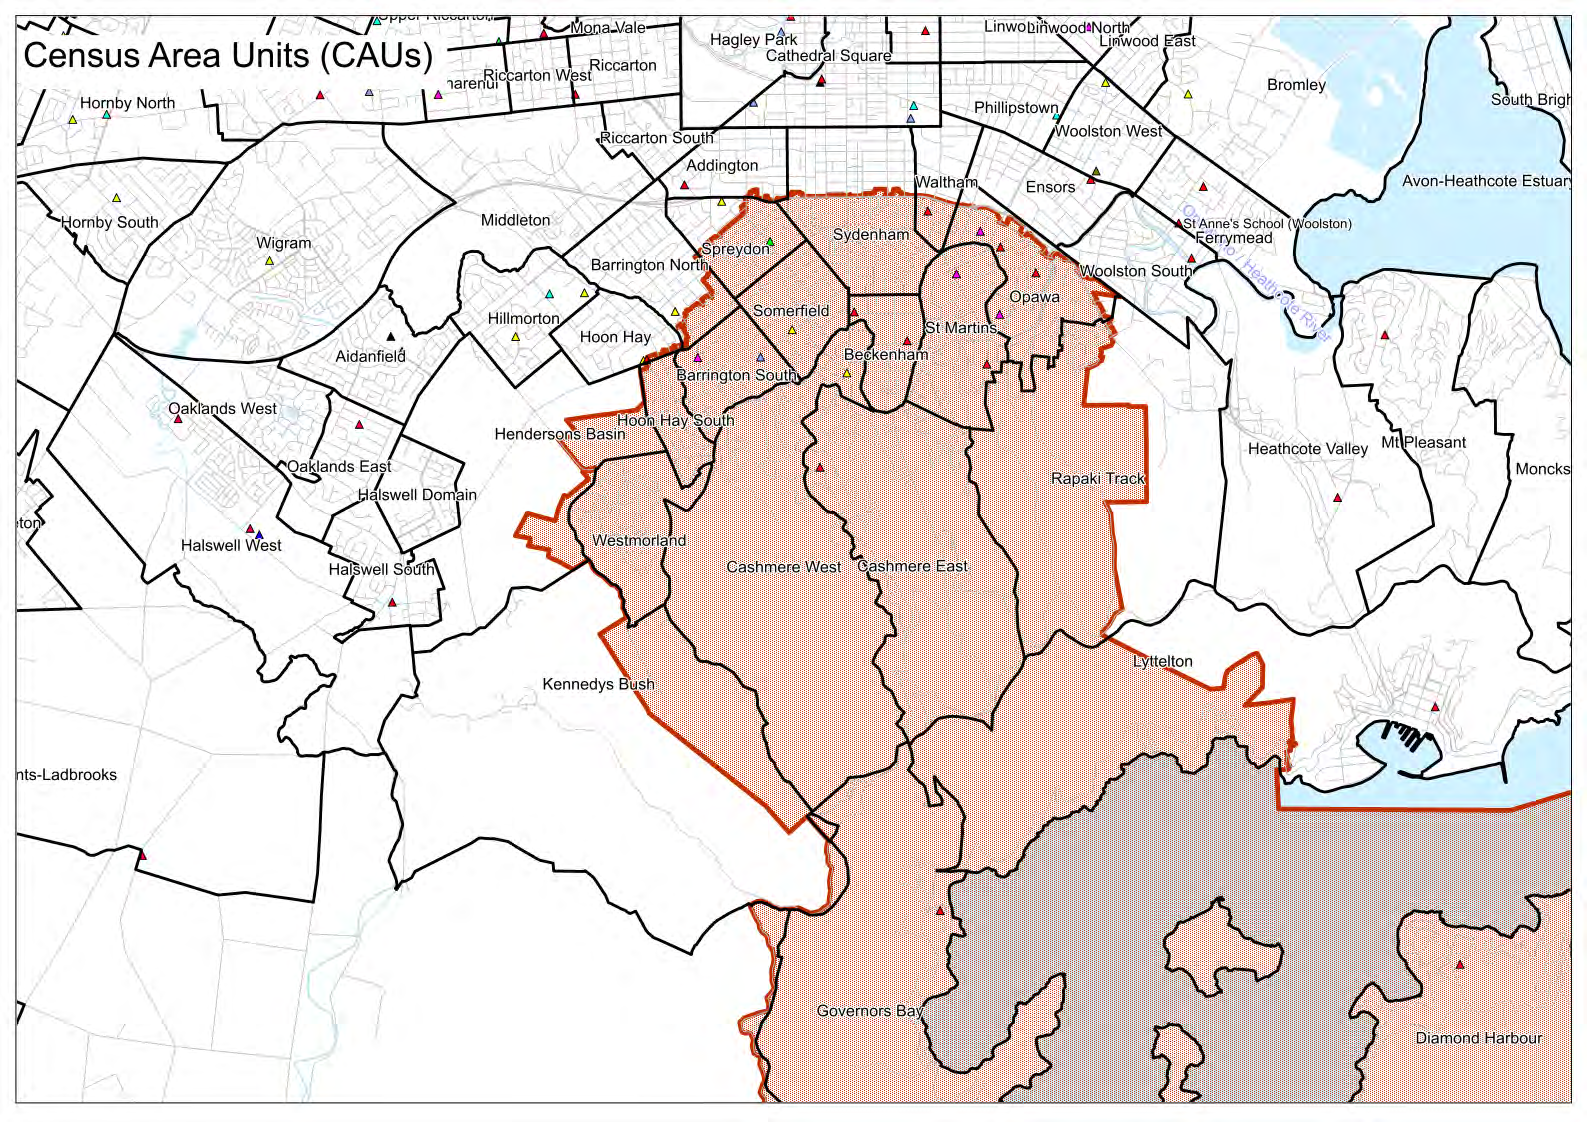
StatsNZ projections;
Age 13-17 (Year 9-13) population projections for Census Area Units (CAUs) that are entirely
or mostly within the CHS zone (High and Medium Variants);
High Variant
Medium Variant
CAU
H2019
H2024
H2028
H2038
M2019
M2024
M2028
M2038
Westmorland
155
180
145
145
150
160
140
135
Cashmere West
230
255
225
250
230
245
205
225
Cashmere East
250
255
230
240
245
250
210
205
1982
Rapaki Track
110
95
95
100
110
95
80
75
Opawa
200
195
165
175
195
185
155
150
Act
St Martins
250
275
270
305
240
260
255
260
Sydenham
220
285
335
390
205
280
300
315
Barrington South
215
260
235
225
215
250
215
200
Spreydon
170
255
240
250
170
250
225
200
Hoon Hay South
110
145
175
200
110
145
165
175
Somerfield
275
280
270
275
275
265
245
225
Beckenham
190
195
150
150
185
195
135
125
Diamond Harbour
85
85
75
100
85
85
70
75
Governors Bay
65
55
50
60
65
55
45
50
Information
Age 13-17 (Year 9-13) Percentage change from the 2019 level by CAU
High Variant
Medium Variant
CAU
H2019
H2024
H2028
H2038
M2019
M2024
M2028
M2038
Westmorland
16%
-6%
-6%
7%
-7%
-10%
Cashmere West
11%
-2%
9%
7%
-11%
-2%
Official
Cashmere East
2%
-8%
-4%
2%
-14%
-16%
Rapaki Track
-14%
-14%
-9%
-14%
-27%
-32%
the
Opawa
-3%
-18%
-13%
-5%
-21%
-23%
St Martins
10%
8%
22%
8%
6%
8%
Sydenham
30%
52%
77%
37%
46%
54%
Barrington South
21%
9%
5%
16%
0%
-7%
Spreydon
50%
41%
47%
47%
32%
18%
under
Hoon Hay South
32%
59%
82%
32%
50%
59%
Somerfield
2%
-2%
0%
-4%
-11%
-18%
Beckenham
3%
-21%
-21%
5%
-27%
-32%
Diamond Harbour
0%
-12%
18%
0%
-18%
-12%
Governors Bay
-15%
-23%
-8%
-15%
-31%
-23%
Total
11%
5%
13%
10%
-1%
-3%
Under the Medium projection variant, the age 13-17 population within the CHS zone is
Released
expected to increase by 10% between 2019 and 2024, returning to the 2019 level by 2028,
due to the movement of a large population bubble through school age year levels.
Trends vary widely between different CAUs (map of CAUs below).
8
1982
Act
Information
Official
the
under
9
Released
1982
Act
Information
Official
the
under
Released
10
1982
Act
Information
Official
the
under
Released
11
1982
Act
Information
Official
the
under
Released
12
1982
Act
Information
Official
the
under
Released
13