AT Local (Devonport On-Demand Rideshare) Performance Report
The purposes of this paper are to:
review the performance of the AT Local on-demand rideshare operation in Devonport;
document the key learnings gained from the trial that could be applied to any future
on-demand operation; and
determine whether the existing Devonport AT Local trial should continue and if so,
whether changes are required.
1)
Background
Auckland Transport, like many public transport organisations globally, is being challenged to
deliver new, innovative and sustainable customer solutions to meet the demands of an ever-
increasing, multi-cultural and aging population in the digital age.
Public transport organisations face similar challenges through:
The requirement to serve an array of customer markets, ranging from high density
urban routes through to sparsely populated rural areas
Variable cost recovery across routes, with main corridors having higher service
frequency and quicker journey times (high cost recovery), whereas routes covering
outer suburbs attract fewer passengers (lower cost recovery)
Higher subsidies through reduced cost recovery, which can result in public and
media scrutiny of organisational priorities and demand for greater efficiencies.
The first and final leg of any journey can be the most difficult journey stage. Historically, it has
been difficult for public transport to provide effective services to bridge this gap and it remains
an on-going customer pain point. To fill this gap, commercial ride sharing and ride hailing
services have launched both globally and in New Zealand, where Uber, DriverHer, Ola and
Zoomy are now available. These services are focused on optimising (reducing) waiting and
travel times but only at an individual customer level.
Public transport organisations are now considering whether on-demand technologies could
be used to complement, supplement or substitute conventional public transport services and
assess whether these can deliver more customer-focused, flexible and cost-effective
outcomes. The focus is on optimising the journey for groups of customers (rather than
individuals) travelling to or from a public transport hub for a subsidised price.
Auckland Transport has partnered with Via Mobility, an international provider of innovative
rideshare solutions to create “AT Local”, a 12-month “test and learn” rideshare trial. It is a
publicly-subsidised, on-demand transport solution, designed to carry multiple (non-related)
passengers simultaneously from one location to another within a designated rideshare zone
i.e. customers share the vehicle with other passengers, not just the driver. The service is also
the first in the world to use an all-electric vehicle fleet.
Page
1 of
13


The rideshare trial has six key objectives:
1. Encourage modal shift away from the single occupant vehicle
2. Reduce congestion in the Lower Devonport Peninsula area, particularly on Lake Road
3. Deliver a new innovative way to meet customers ‘first’ and ‘final’ leg travel needs
4. Social responsibility including improved sustainability through use of electric vehicles
5. Measure customers adoption and perception of the rideshare concept
6. Take learnings and applicability of the service for other parts of Auckland
AT Local provides customers with an innovative, more
personalised public transport option, designed to better
meet their transport needs, allowing them to travel at their
time and location of choice, anywhere within the designated
rideshare zone. It is a flexible, cost-effective travel solution,
being responsive to the customer’s travel requirements,
thereby differing from conventional public transport, which
operates to a scheduled timetable along a designated
route. It offers an alternative option for the Lower
Devonport Peninsula community, in addition to providing
AT with valuable insights as to whether on-demand
rideshare is a viable first-and-last-leg option to address
future regional transport demand.
Customers download the AT Local app and following
registration, can immediately book and pay for rides, in addition to providing realtime feedback.
Customers can travel anywhere within the rideshare zone for a fixed fare per person, with
rides to or from the three local ferry terminals (transport hubs) being offered at a 50% discount
to assist in reducing congestion in streets up to one kilometre from the ferry terminals,
particularly during peak hours.
AT Local operates in a rideshare zone covering
the lower Devonport Peninsula, which has three
natural sea borders and one land boundary.
This significantly reduces the likelihood of “zone
creep” where customers living outside boundary
request the zone be expanded to include their
area.
Operating in the lower Devonport Peninsula
also provides an opportunity to reduce peak
hour congestion around the three local ferry
terminals, particularly Devonport. Customers
now have an alternative to leaving early,
spending time driving around searching for a car
park, then walking extended distances to (or
from) the ferry terminal - they can use the AT
Local and be dropped off at the ferry terminal in
good time to catch their ferry.
Page
2 of
13

 2)
AT Local Performance
2)
AT Local Performance
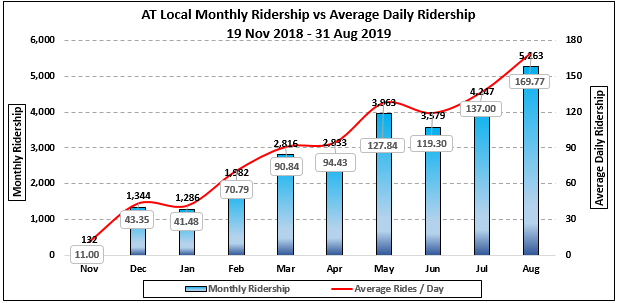
The trial commenced on 19 November 2018. The extended summer holiday period curtailed
customer acquisition and ridership growth but since February, there have been significant
month-on-month increases both. Between February and August 2019, customers increased
from 1,300 to 2,950 (+127%), whilst monthly ridership increased from 1,582 to 5,263 (+233%).
Selected Performance Metrics to 31 August 2019
i.
Customer Base: 2,950 (20.7% of target market)
ii.
Ridership to Date: 27,481
iii.
Regular Users: 890 (30.2% of customer base)
iv.
Modal Shift: 43% move from private motor vehicle
v.
39% of customers have taken three or more rides
vi.
49% rides aggregated during peak 07:00 - 08:00 (sharing vehicle with others)
vii.
Average Customer Rating: 4.88 out of 5.00
viii.
25.9% of customers now use AT Local more than once per day
ix.
23% of customers reported increased use of local ferries because AT Local has made
accessing these services easier.
x.
2% of customers have started using ferries because of AT Local
Both performance metrics and customer feedback indicate that AT Local is delivering modal
shift, with 43% of customers moving away from the private motor vehicle. This is supported
by unsolicited feedback, with customers proactively advising they now use AT Local, rather
than driving to the ferry terminals. Average daily ridership (including weekends) increased to
170 rides per day in August, whilst weekday-only ridership rose to 213 rides per day.
A)
Ridership Growth
AT Local has been operating for nine months. As AT Local has established itself as a viable
alternative for first and last leg travel with its target market. Growth is underpinned by in-
market promotions and more importantly, word of mouth referrals from satisfied customers,
resulting in both total rider numbers and regular riders increasing, as they use the service
more often.
Page
3 of
13


Monthly ridership has increased from 132 (Nov 2018) to 5,263 (Aug 2019), with average rides
per customer rising from 1.31 (Nov 2018) to 5.91 (Aug 2019).
B)
Impact on Local Bus Services
The implementation of New Network – North resulted in five bus routes servicing the lower
Devonport Peninsula. The new services are shown below:
There were initial concerns that the new AT
Local service could potentially cannibalise
the local bus routes by taking passengers
away. However, a recent customer survey
indicates there has been a limited impact
to date, with just 13% of AT Local
customers advising they had previously
used bus services. This is supported by a
more detailed analysis covering the period
1 February 2019 – 30 June 2019, shown
below:
Local Bus Services: Average Daily Passengers
AT Local
Time Period
801
802
806
807
814
01/02/19
–
487
341
49
63
1,552
86
30/04/10
01/05/19
–
488
355
46
60
1,475
124
30/06/19
Change
+1
+14
-3
-3
-77
+36
There is some anecdotal evidence suggesting that customers switch between the local 806
and 807 bus services (covering the Devonport Ferry Terminal) and AT Local but this depends
largely on whether a bus service is available when they want to travel. It is also possible that
some bus customers switch to AT Local services during bad weather conditions
It is worth noting that currently, the extent of switching between bus services and AT Local
may be restricted by the current App-only rideshare booking and payment operation. If any
subsequent service offered the traditional ride booking and payment options, this would
increase the rate of substitution between bus services and rideshare. Additionally, SuperGold
customers travel free of charge on public transport (subject to the SuperGold conditions of
travel), whereas all AT Local customers pay a fixed fare per rider.
C)
Cost (Subsidy) per Passenger
Other performance metrics have also improved significantly during the period since launch.
From a cost perspective, one-off set up costs totalled $103,400, so monthly operating
expenses have been adjusted to reflect this.
Page
4 of
13
The two largest monthly expenses (Go Bus contract fee and Via Mobility monthly service
charges) are fixed. Therefore, as ridership increases, revenue rises and passenger
operational performance metrics improve, thereby reducing the subsidy per ride and cost per
passenger kilometre. Should monthly ridership continue to rise, both the subsidy per ride and
cost per passenger kilometre will decrease correspondingly.
i.
Cost (Subsidy) per Passenger: $11.72 (Aug 2019)
This compares to overall PT performance for August of $2.97. In August, AT Local had a better
subsidy/passenger than 57 bus routes. The subsidy per passenger on contracted ferry
services is $11.18/pax
i.
Cost (Subsidy) per Passenger Kilometre: $4.82 (Aug 2019)
D) Farebox Recovery
Since 98.4% of monthly operating costs are fixed costs, are ridership and revenue increase,
farebox recovery also rises, reducing the net subsidy per rider.
i.
Farebox Recovery: 15.1% (Aug 2019)
E)
AT Local Performance Benchmarked Against Comparable Services
When comparing AT Local against eight other comparable services operated by Via Mobility,
it ranks highest for completion rate suggesting it is optimally resourced, whilst the third place
ranking for daily rides suggests improvements are possible. However, AT Local ranks second
for the second for peak hour rides, suggesting strong demand as a commuter service.
F)
Service Scalability
Implementation of the initial Devonport trial included one-off development and testing costs to
set up the App and Via Operating Console (VOC) framework, so new rideshare schemes can
leverage this to reduce the total expenditure associated with set-up.
However, it must be noted that when AT implemented AT Local, it did so using the existing
Via eco-system, which included operational, financial and reporting systems. This is a stand-
alone eco-system that operates outside of AT’s systems, so currently, all integration with AT
is manual. This includes (but is not limited to) customer feedback management, customer
communications, financial analysis, reporting and performance analytics.
In order to successfully implement additional rideshare schemes, consideration should be
given to integrating the Via / AT Local eco-system into the AT infrastructure.
3)
Performance Against the Six Key Objectives
A.
A Encourage modal shift away from private motor vehicle
Devonport, with a population of 23,000, has 30,000 car trips per day on Lake Road, with 50%
of trips being within the peninsula itself. Approximately 39% of customers use private motor
Page
5 of
13
vehicles, either as a driver or passenger, when travelling to or from the three local Devonport
Peninsula ferry terminals (public transport hubs).
Although local connector bus services are available, only 13% of ferry customers use them.
Five bus routes, covering all three ferry terminals, serve the Lower Devonport Peninsula but
there is a relatively low uptake of these options for a variety of reasons, including frequency,
reliability and the customer’s own proximity to the route(s).
Most ferry users live within three kilometres of the local ferry terminals and this, coupled with
the relatively flat geography, encourages both walkers and cyclists (combined 48%).
However, during wet weather, 13% of walkers and cyclists revert to the car, further
exacerbating local congestion.
AT Local provides customers with a reliable, low-cost alternative to the private motor vehicle,
effectively “mirroring” the journeys they take on an individual commuter basis e.g. from home
to the ferry terminal. However, importantly, because AT Local uses a smart algorithm to
maximise vehicle efficiency by aggregating rides, it reduces the total number of daily journeys
to and from the ferry terminals peak periods, whilst still transporting the same overall number
of customers.
AT Local Customer Survey: Main
Modal shift away from the private motor vehicle has been a
Mode of Travel to Ferry Terminal
significant contributory factor to AT Local’s on-going ridership
Pre-AT Local
increases. A recent in-market customer survey1 highlighted
Cycling
8%
that the AT Local customer profile broadly mirrors the travel
modes from the pre-AT Local survey. The survey showed 43%
Walking
31%
of car users had switched over to AT Local: 30% as car drivers
Bus
13%
and 13% as car passengers. This compares to 39%
identifying as car travel ers prior to AT Local’s introduction, so
Car passenger
13%
the service is delivering on this key objective. It should also
Car Driver
30%
be noted that only 13% of customers have switched from local
Other
5%
connector buses to AT Local, alleviating concerns that the new
service would “cannibalise” these routes
Translating this into monthly performance, in August, AT Local replaced a total 2,057 car
journeys and an average of 83 car journeys per weekday.
B.
Reduce congestion in the local Lower Devonport Peninsula area
The Devonport Peninsula is connected to the North Shore and beyond by Lake Road, the
main north – south arterial route, which can become extremely congested in both directions
during peak hours as ferry customers travel to and from the local ferry terminals, particularly
Devonport.
i.
Ride Aggregation1 by Week (12 Weeks from 27 May – 18 August)
1 Ride aggregation is where customer with individual bookings share one vehicle with other riders i.e. they have
each made individual bookings. This is distinct from where customers book for additional riders and also different
from other “rideshare” services, where individual customers “share” the ride with the driver, rather than with other
passengers.
Page
6 of
13


In the 12 weeks ended 01 September, ride aggregation averaged 31%. This rose to over 36%
during the four most recent weeks as ridership has increased to over 200 rides per week day,
showing that customers have embraced the concept of sharing the vehicles with others.
ii.
Ride Aggregation by Hour (12 Weeks from 27 May – 18 August)
A more granular analysis of operating hours provides greater insight into intra-day
aggregation, which rises to 49% between 07:00 – 08:00, corresponding to peak demand.
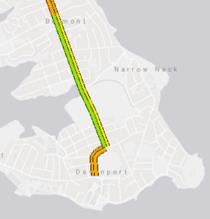
iii.
Congestion on Lake Road
Comparing peak inbound morning congestion between March 2019 and July 2019, there is
an improvement in the Albert Road / Victoria Road areas of Devonport. AT Local ridership
has increased by 151% between March 2019 (2,816) and July 2019 (4,247).
Inbound Lake Road Morning Peak Congestion
March 2019 July 2019
Page
7 of
13
C.
Social responsibility including improved sustainability through use of electric
vehicles
1)
Improve sustainability through the use of electric vehicles
AT Local delivered a world first in utilising an all-electric vehicle fleet for a rideshare scheme.
For period to 31 August, AT Local has delivered:
i.
27,481 rides
ii.
Average ride: 2.2km
iii.
10,652 motor vehicle trips replaced
iv.
65,538 passenger kilometres travelled
v.
8,651kg CO2 emissions saved (from active trips)
2)
Improve Travel Options for Accessible Customers
AT Local provides a safe, reliable, responsive and cost-effective transport option for
accessible customers, who can be more self-reliant when travelling locally. All three vans are
wheelchair accessible and customers can indicate they are an accessible customer using a
feature in the app. This ensures that an accessible vehicle will be automatically be assigned
to that ride request.
3)
Alignment with Vision Zero
AT Local uses professional drivers and offers customers safe and secure direct transport to
and from ferry terminals. It also reduces the incidence of distracted drivers travelling along
narrow side streets searching for parking spaces, assisting in creating a safer environment for
cyclists, pedestrians and other road users. Customers have a safer alternative if considering
driving when out socialising, with 21% of all rides on Fridays, compared to Mondays (15%).
D.
Deliver new innovative ways to meet customers ‘first’ and ‘final’ leg travel needs
Obtaining, analysing and translating customer feedback into prioritised actionable insights has
been crucial to delivering customer-focused improvements during the trial assisting in both
retaining existing customers and acquiring new ones throughout the trial.
Customers provide feedback using the “Rate My Ride” in-app feature at the conclusion of each
ride, or use the “Contact AT Local” in-app feature at any time. To date, 295 pieces of customer
feedback have been received, ranging from simple “one-liners”, to ride-specific issues,
through to detailed and constructive suggestions for improving the service.
Over 3,100 customers (13% of all bookings) have rated rides, with the average rating being
4.88 out of 5. The introduction of ‘friend-get-friend’ in-App referral offer during June has seen
over 100 customers acquired via this channel.
E.
Measure customers adoption and perception of the rideshare concept
Customer perception is measured by reliability, cost (fares) and ease of use (booking and
payment). Additional factors include driver attitude, other customers and ride comfort.
Customer adoption of AT Local demonstrates a strong demand, as performance to 31 August
shows:
i.
+2,950 customers have registered (20.7% of the target market)
Page
8 of
13


ii.
891 regular users (30.2% of customer base).
iii.
38% rides aggregated during peak hours (customers share the vehicle with others)
iv.
62% have taken at least one ride
v.
39% have taken three or more rides
vi.
4.88/5.00: Average customer rating
F.
Take learnings and applicability of the service for other parts of Auckland
The current AT Local trial has provided a considerable volume of transferrable knowledge and
insights that can be applied to any future rideshare operations. However, it is important to
note that in addition to these more generic aspects, each new rideshare area will include some
unique factors that must be taken into account in order that the operation is successful.
Below are some factors that should be considered when investigating new rideshare zones
and implementing new services. As each new rideshare operation is implemented, additional
learnings will result and these must be captured and considered as part of creating a living
framework for future schemes.
1)
Alternative Channels for Ride Requests:
i.
Provide alternative ride request options for customers, including:
a)
Telephone (e.g. via Contact Centre / Service Operator)
b)
Web-browser – online booking
c)
SMS services.
ii.
Extending channel options wil extend AT Local’s reach into both the senior citizen
community and also those market segments that are not digitally enabled.
Feedback from senior citizens and advocacy groups is that they would use AT
Local but they either do not have, or cannot use, smart phone technology.
2)
Alternative Payment Options:
i.
Provide alternative payment options, including:
a)
AT HOP cards,
b)
Cash on-board
Page
9 of
13
c)
Pre-paid voucher system.
ii.
Alternative payment options would allow other communities to use the service,
particularly senior citizens and those who do not have ready access to pay cards.
3)
Locations for New Services:
Should be supported by a detailed analysis of the local travel patterns, including both
current public transport and all other active and passive modes. These should include
(but not be limited to):
i.
Current public transport travel patterns by time of day and day of week
ii.
Current travel patterns using other modes by time of day and day of week e.g.
private motor vehicle, active modes etc.
iii. Analysis of local employers, numbers of employees, including shift patterns etc.
iv. Analysis of local amenities / facilities e.g. hospitals, schools, leisure activities
4)
Customer Segments:
Detailed analysis of the various customer segments within the target area is necessary
to ensure the service will meet their needs e.g. senior citizens require alternative ride
booking and payment options, rather than a solely App-based service.
5)
Promoting New Service Areas:
i.
Determine the channels preferred by the target market segments – these should
be the primary focus of customer promotional material
ii.
Encourage support from local businesses
iii. Commence the promotional campaign between two and four weeks prior to the
service launch to generate customer interest
iv. Promotional material must be clear in terms of the service offering:
a)
Whether the service is a rideshare service or a taxi
b)
How to book and pay for rides i.e. channel availability
c)
App Store Links to the Rideshare App (N.B.: It’s not an AT product)
d)
Links to support channels e.g. web page
e)
Rideshare zone and boundaries
f)
Fares – per person, not per trip
g)
Discounts e.g. Senior Citizens, Children
h)
Days and hours of operation
i)
Numbers and types of vehicles e.g. cars, minivans
j)
Security features: e.g. Paycard security, on-board CCTV
k)
If cash is not accepted, specify this as it also increases driver safety
v. Offer time-based incentives for pre-launch customer sign-ups to translate this into
early ridership e.g. Promotional Codes with expiry dates
vi. Pre-launch beta-testing with local residents to test the service and create
advocates who will promote the service in the post-go
Page
10 of
13

6)
Other Factors For Consideration:
i.
Geography and Proximity of Customers to Public Transport Hubs
Most customers using the local ferries live within three kilometres of the respective
terminals and since the current trial area is mainly flat, it is relatively easy for
people to walk or cycle to the ferry terminals. (39% of ferry users walk or cycle to
the ferry terminals).
Whilst there are some steeper sections within the rideshare zone that can present
challenges to customers with mobility impairment, overall, the relatively flat terrain
means easy walking and cycling routes. Consequently, many of these customers
switch to AT Local during adverse weather conditions, although the positive aspect
is that they do not revert to the private motor vehicle.
ii.
Weather Conditions
Auckland experienced an extended period of warm, dry weather from January
2019, with autumn and winter being the warmest and driest on record. These
factors have impacted demand for AT Local, which has shown a degree of
correlation with the prevailing weather conditions. AT Local ridership has risen
sharply on days with adverse weather conditions during the morning and afternoon
peaks.
The sharp contrast between July (4,247 rides) and August (5,263 rides) illustrated
the effect of rain. July’s rainfall was only 83% of the average, whereas August
experienced the highest number of days with rain on record (as opposed to total
rainfall, which was 89% of the average).
4)
Recommendations for Current AT Local Trial
A)
Continue the Current AT Local Service But with Service Changes
It is recommended that the current AT Local rideshare trial operating on the Lower
Devonport Peninsula should continue as a permanent first and last leg option for
customers. However, it is further recommended that the following changes are made to
improve the service offering and broaden its appeal to wider constituency groups.
1)
Change Operating Hours
i.
Mon – Fri Commuter Service Only)
Current weekend ridership is significantly below that of weekdays and there is a high
fixed cost component associated with providing weekend services. Therefore, it is
proposed that the current trial revert to a 5–day a week commuter-based service.
Page
11 of
13
Day
Current
Proposed
Annual Riders:
Annual Operating
Operating
Operating
+Increase / -
Cost Savings / (Extra
Hours
Hours
Decrease
Costs)
Mon - Thu
05:40am –
06:00am –
-750
21:20pm
21:00pm
Fri:
05:40am –
06:00am –
+500
21:20pm
22:00pm
Sat:
08:25am –
No Service
-2,324
18:50pm
Sun / Public
08:25am –
No Service
-2,063
Holiday:
18:20pm
Total
-4,637 Riders
Whilst there is a reduction in total annual ridership (4,637 riders), the associated revenue
loss is more than offset by the annualised cost savings.
2)
Provide Alternative Channels for Ride Requests
(Subject to additional trials commencing to defray the development and implementations
costs)
i.
Provide alternative ride request options for customers, including:
a)
Telephone (e.g. via Contact Centre / Service Operator)
b)
Web-browser – online booking
c)
SMS services.
ii.
Extending channel options wil extend AT Local’s reach into both the senior citizen
community and also those market segments that are not digitally enabled.
Feedback from senior citizens and advocacy groups is that they would use AT
Local but they either do not have, or cannot use, smart phone technology.
3)
Provide Alternative Payment Options
(Subject to additional trials starting to defray development and implementations costs).
i.
Provide alternative payment options, including:
a) AT HOP cards
b) EFTPOS on board
c) Cash on board
d) Pre-paid voucher system.
ii.
Providing alternative payment options would allow other communities to use the
service, particularly senior citizens and those who do not have ready access to
payment cards.
Page
12 of
13

 4)
Expand Rideshare Zone
4)
Expand Rideshare Zone
i.
Off-Peak Hours
a) Expand the current rideshare zone boundary north to Hauraki Corner (shaded
in Yellow), using the
natural
boundary
line
created by Jutland Road
and Hauraki Road (runs
NE – SW).
b) Includes approx. 2,000
extra households
c) Determine impact on off-
peak
ridership
to
determine
if
genuine
demand
exists
and
vehicle optimisation.
ii.
Peak Hours
a) If
the
extension
of
services during off-peak
hours
is
successful,
consideration should be
given to running the same trial during peak hours.
Page
13 of
13