

 Appendix
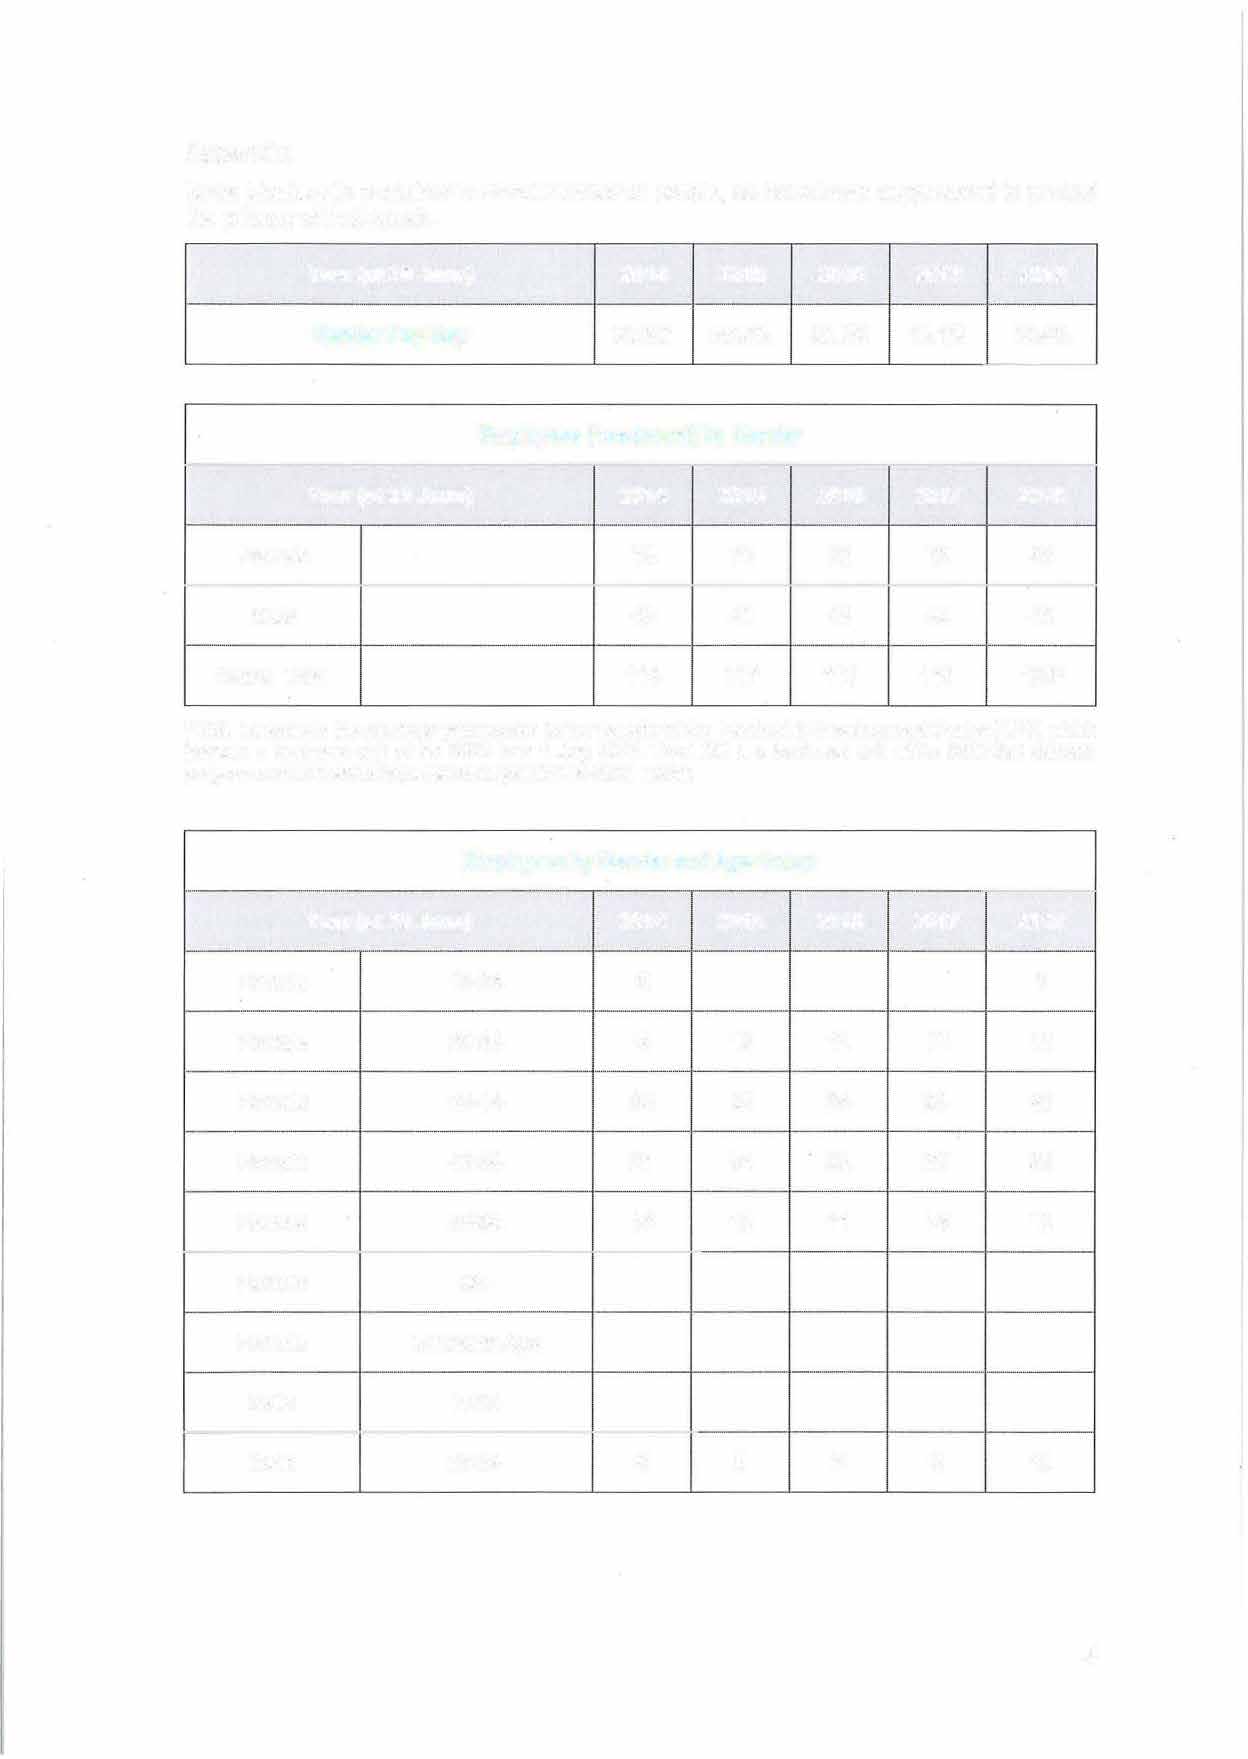
Note: blank cells contained a small number of people, so have been suppressed to protect
the privacy of individuals
Year (at 30 June)
2014
2015
2016
2017
2018
Gender Pay Gap
20.8%
26.9%
22.0%
18.1%
13.4%
Employees (headcount) by Gender
Year (at 30 June)
2014
2015
2016
2017
2018
Female
74
76
73
73
89
Male
40
41
42
45
44
Grand Total
114
117
115
118
133*
* This increase in the previous year relates to the transfer of the Leadership Development Centre (LDC) which
became a business unit of the SSC from 1 July 2017. The LDC delivers programmes and workshops for
managers in the State sector.
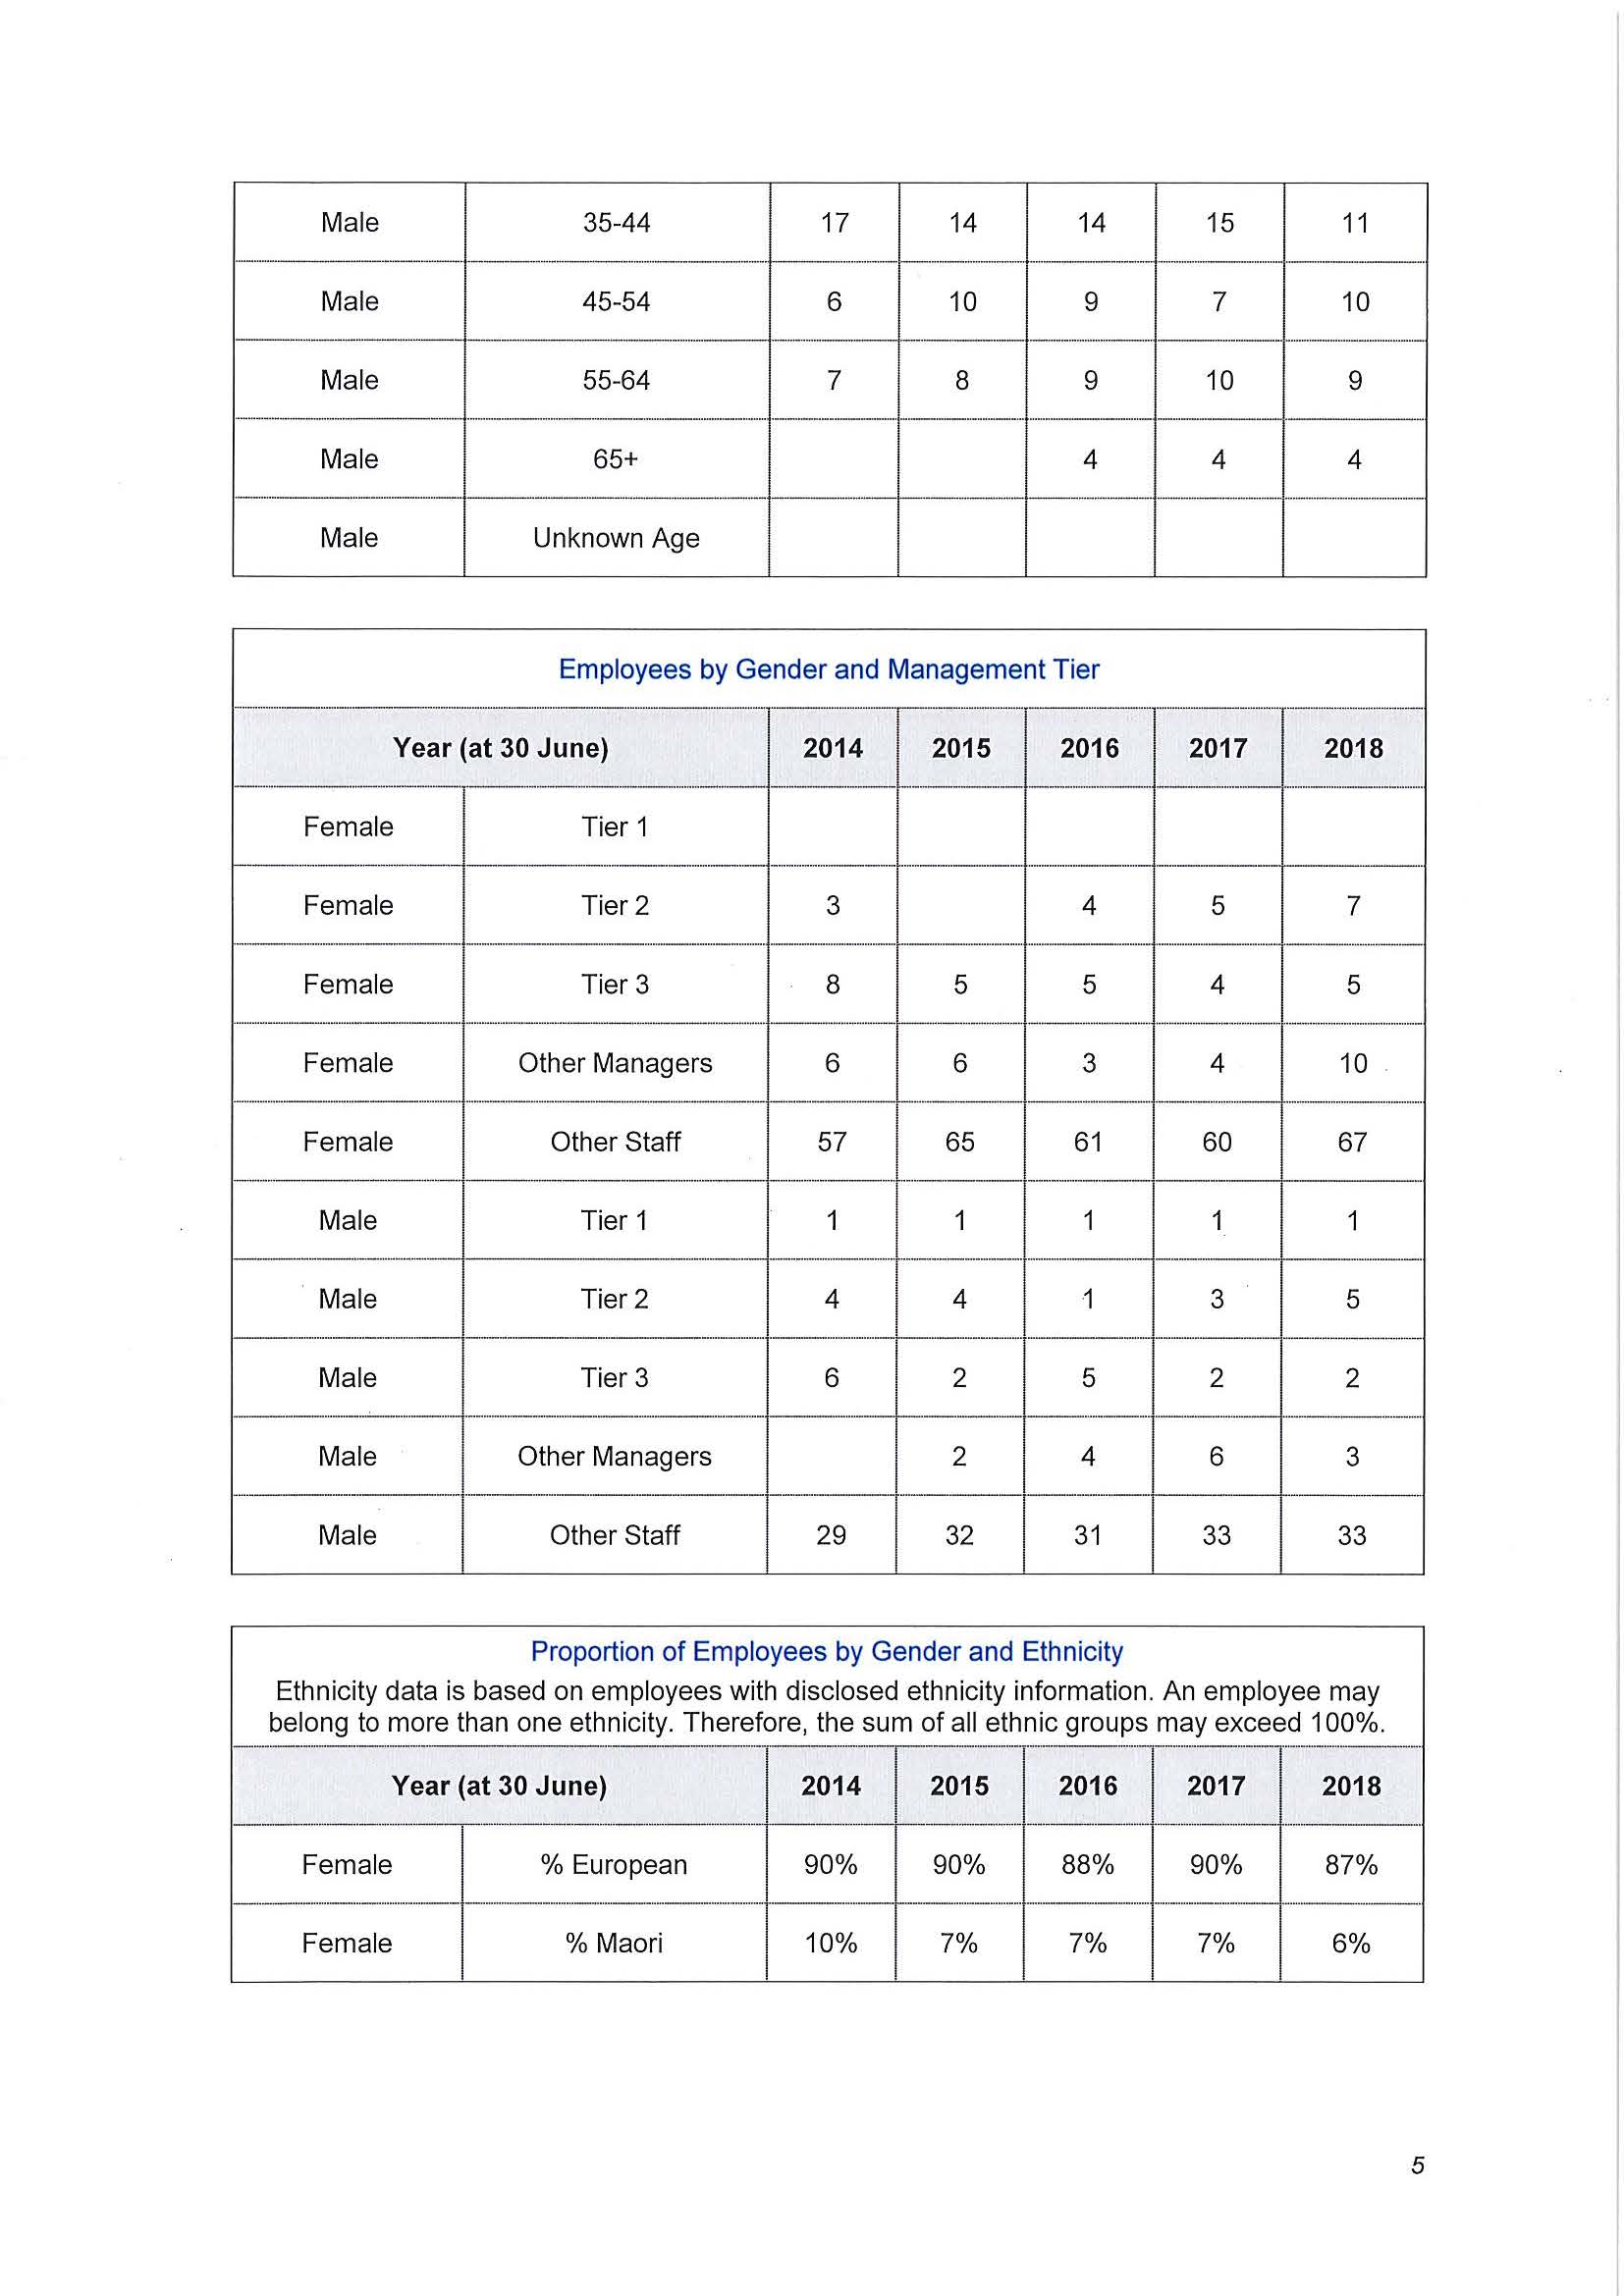
Employees by Gender and Age Group
Year (at 30 June)
2014
2015
2016
2017
2018
Female
15-24
6
5
Female
25-34
9
12
12
10
15
Female
35-44
20
20
24
24
22
Female
45-54
21
24
22
20
22
Female
55-64
15
13
11
13
18
Female
65+
Female
Unknown Age
Male
15-24
Male
25-34
6
6
6
9
10
4