
PO Box 3696, Shortland Street, Auckland 1010
T: +64 9 377 5590
Level 4, 12 O’Connell Street, Auckland 1010
F: +64 9 377 5591
E:
[email address]
m
www.mrcagney.com
MRCagney Pty Ltd
Company Number:
1317981
Technical Note
Subject: Capacity Calculations
Project: City Centre Bus Reference Case
Our file: NZ 1982
Date: 25 November 2015
Prepared
Status: Draft
RLG
by:
1. Methodology: Stochastic Queueing Theory
The methodology for calculating the required bus stop capacity for a given volume of bus service
was developed on the basis of a steady but irregular stream of buses being bunched into groups
by traffic lights. This allowed the use of stochastic queueing theory (Rouphail, Tarko & Li, n.d.;
Troutbeck & Brilon, n.d.; Transit Cooperative Research Program, 1996) to determine the number
of buses we expect to be queued at a traffic signal when the light turns green, and therefore how
many buses we can expect to arrive together at the next bus stop downstream from the traffic
light.
The inputs required for calculating the probability that a given number of buses join the queue
during one signal cycle are:
1.
The number of buses per hour in the corridor, i.e., arrival rate or frequency,
q;
2.
The number of buses queueing during one signal cycle,
n; and
3.
The signal cycle time,
t.
The probability that
n buses join the queue during a signal cycle is given by the following
equation:
(𝑞𝑞𝑡𝑡)𝑛𝑛𝑒𝑒−𝑞𝑞𝑞𝑞
𝑃𝑃𝑛𝑛(𝑡𝑡) =
𝑛𝑛!
This calculation assumes that:
The arrival of buses at a signalised intersection is randomly distributed, i.e., it can be
represented by a Poisson or negative exponential distribution;
Buses travel in dedicated bus lanes, and are therefore not delayed by or intermingled with
general traffic queues;
All buses at the traffic signal will use the same stop downstream;
There is no limit to the number of buses that can queue while the signal is red;
All buses are cleared from the queue while the signal is green; and
The queueing discipline is FIFO (first in, first out), i.e., buses depart from the queue in the
same order that they arrive.
We also calculated the cumulative probability that no more than
n buses will join the queue during
one signal cycle by summing probabilities from 0 to
n.
link to page 3

2. Calculating Capacities: Inputs and Assumptions
The methodology outlined above was used to ascertain bus infrastructure requirements for city
streets at peak bus volumes. In order to determine the number of loading areas required to handle
a given frequency of bus service, the following assumptions were made:
The signal cycle time,
t, is two minutes;
All buses will exit the stop within two minutes, i.e., before the next platoon of buses arrives;
and
The bus stop must be able to handle the expected number of buses arriving 90% of the time.
By calculating cumulative probabilities using a range of values for bus frequency (
q) and number
of buses in the queue (
n), we generated a table showing the probability that no more than
n buses would arrive in the same two-minute period for each value of
q. This table can be used to
determine the maximum number of buses that we need to provide stopping space for in order to
accommodate a given bus frequency 90% of the time. In other words, the table allows us to
answer the question “how many loading areas do we need for the peak frequency to be
accommodated 90% of the time (while accepting some congestion 10% of the time)?”
For example, if 16 buses per hour use a corridor, the probability of zero buses arriving at a
signalised intersection during a two-minute period is 59%, while the probability of one bus arriving
is 31%, so there is a 90% probability that no more than one bus will arrive at the intersection per
two-minute signal cycle. Put another way, if a bus stop contains a single loading area, there is a
10% probability that more than one bus will arrive to use the stop from one two-minute signal
cycle if 16 buses per hour are using the corridor.
Note that this methodology assumes all buses arriving at a stop have come from the same
corridor upstream. However, buses may arrive from two (or more) separate approaches, e.g.,
westbound buses on Wellesley Street may come from either Symonds Street or Grafton Road.
When this occurs, bus volumes from the two approaches must be treated independently, i.e., bus
stop capacities must be calculated as though buses from each approach will use separate stop
groups in the downstream corridor. While this strategy arises from the simplifying assumptions in
the methodology used, it is also preferred from a customer service perspective because it
improves legibility of the network.
2.1. Signal Cycle Time
Signal cycle time is one of the key inputs to this calculation, and we assumed a cycle time of
2 minutes, or 120 seconds. If we use a shorter cycle time, the number of loading areas required to
handle each group of buses would be reduced, but there would be less time available for buses to
drop off and pick up passengers before the next group of buses arrive. Conversely, if we assume
a longer cycle time, larger bus stops would be required. Note that some signal cycles in the city
centre are currently as long as 3 minutes due to pedestrian priority, but shorter signal times could
be used to limit the number of buses queueing and arriving at a stop at once.
Table 1 shows the number of loading areas required at a stop to handle buses released from an
intersection with signal cycle times of 90 seconds, 120 seconds and 180 seconds. For any given
bus stop capacity, increasing signal cycle time from 90 seconds to 120 seconds reduces the bus
volumes that can be handled by a stop by ~25%. Likewise, for a given bus volume, longer signal
cycle times result in a longer queue of buses forming, thus necessitating an increased number of
loading areas per stop. For example, a corridor with 60 buses per hour would require a triple stop
Page 2
link to page 4

with a 90-second signal cycle, a quadruple stop with a 120-second signal cycle, and a quintuple
stop with a 180-second signal cycle.
Table 1: Impact of signal cycle time on bus stop capacity.
Number of
Maximum corridor volume
loading
(Buses per hour per direction)
areas per stop
per direction
90 seconds
120 seconds
180 seconds
1
21
16
10
2
45
33
22
3
71
53
35
4
98
74
49
5
127
95
63
6
157
118
78
7
188
141
94
8
219
164
109
9
251
188
125
10
283
212
141
It is important to note that our calculations of required bus stop capacity assume bus dwell time at
the stop is always less than the signal cycle time. The TCQSM developed by the Transit
Cooperative Research Program (2013) provides a default dwell time of 60 seconds for downtown
stops, indicating a maximum dwell time of 90 seconds or longer is sufficient. We assume that
buses will travel in dedicated bus lanes in city centre corridors, so there will be no delay due to re-
entering general traffic flow.
2.2. Bus Stop Failure Rate
Our calculation of required bus stop capacity assumes that the number of loading areas provided
will be able to handle the corridor bus frequency 90% of the time. This corresponds to a 10%
failure rate, i.e., 10% of the time a bus will arrive at a stop to find that all the loading areas are
already full. Bus stop failure typically occurs when the number of buses using a stop is
approaching the stop capacity. A high bus stop failure rate causes operational problems, but it is
also associated with a more efficient use of bus stop capacity because a new bus is available to
move into the stop as soon as the current bus departs. Therefore, the TCQSM recommends high
failure rate between 7.5% and 15% in downtown areas in order to balance the negative impacts
on bus reliability and speed with the increased throughput required for busy bus corridors (Transit
Cooperative Research Program, 2013). The 10% failure rate used for city centre corridors in our
calculations is in line with this recommendation.
AT requested that a 5% failure rate also be considered. Decreasing the failure rate to 5% would
reduce the incidence of congestion and increase reliability, but it would also increase the bus
infrastructure requirements.
Table 2 compares the corridor bus volumes that can be handled up to
85%, 90% or 95% of the time by a given number of loading areas (i.e., a failure rate of 15%, 10%
or 5%, respectively).
Page 3

Table 2: Impact of bus stop failure rate on bus stop capacity.
Number of
Maximum corridor volume
loading
(Buses per hour per direction)
areas per stop
per
15% failure
10% failure
5% failure
direction
rate
rate
rate
1
20
16
11
2
40
33
25
3
61
53
42
4
84
74
60
5
107
95
80
6
131
118
100
7
155
141
121
8
180
164
143
9
205
188
165
10
230
212
188
11
256
237
211
Prescribing a lower failure rate means a smaller volume of buses can be handled by a stop of a
given size. Consequently, if failure rates were decreased from 10% to 5%, larger bus stops would
be required to service a corridor carrying a given volume of buses. For example, a corridor with 61
buses per hour in one direction requires a quadruple stop using a 10% failure rate; the required
number of loading areas increases to five with a 5% failure rate, and decreases to three with a
15% failure rate.
2.3. Spatial Requirements
2.3.1.
Bus Stop Dimensions
This appendix has so far dealt with the
number of loading areas required to handle a given
corridor volume, but not the
space required for the stop. The spatial requirement of bus stops is
the key determinant as to how many buses a given corridor can accommodate.
The Transit Cooperative Research Program (1996) provides the following guidelines for bus stop
dimensions:
A 15 m loading area per standard 12 m bus (with no additional separation specified between
loading areas);
A 15 m no-parking zone for lead-in and lead-out, giving a minimum total length for inline stops
of
27 m for far-side stops,
30 m for near-side stops, and
45 m for mid-block stops; and
A generous 50 m lead-in and lead-out for indented stops, with an additional 55–75 m for
acceleration and deceleration.
Similarly, the NSW State Transit Bus Infrastructure Guide recommends a minimum total length of
30 metres for a 12.5 m standard bus, including an 11.5-metre lead-in and 6-metre lead-out. The
same lead-in and lead-out dimensions are recommended for individual loading areas within a
stop, except where buses are not required to move independently, in which case a minimum
Page 4
link to page 3

separation of 6 metres between buses is required (State Transit Authority of New South Wales,
2011).
However, a survey of 48 transit agencies across the United States found that typical stop
dimensions tend to be much smaller than the guidelines. The length of a standard bus stop was
usually 18–24 metres, although it should be noted that most agencies surveyed did not base stop
lengths on the number of buses using the stop (Transit Cooperative Research Program, 2015).
The Bus Reference Case assumes a nominal 12-metre bus length. Two scenarios are considered
with regard to bus stop dimensions:
1.
Minimise Spatial Requirements.
This scenario aims to minimise the cost of bus stops by minimising spatial requirements. The
values assumed for bus stop spacing are:
3 m separation between buses;
3 m buffer at the end of inline stops;
12 m lead-in buffer for indented stops;
6 m lead-out buffer for indented stops; and
6 m separation between stops.
Note that these dimensions have been increased from those presented in earlier versions of
the Bus Reference Case report. The lead-in and lead-out dimensions are informed by NSW
State Transit’s guidelines (State Transit Authority of New South Wales, 2011), while the
separation is based on field observations, as discussed below. The following are key
attributes of this scenario:
Reduced spatial dimensions result in reduced land costs.
Smaller bus stop dimensions are likely to be preferable from an urban design perspective.
Walking distances would be reduced for passengers moving from their waiting position to
board a bus further along the stop.
Bus stops are assumed to not have spillover/blocking at least 90% of the time during the
peak, as described in Secti
on 2.2; however, we note that allowing bus stop failure to
occur up to 10% of the time is not desirable from an operations perspective.
2.
Prioritise Bus Operations.
This is Auckland Transport’s preferred scenario, which aims to minimise delays at bus stops
as a result of buses spilling over or extending into adjacent bus lanes or general traffic lanes.
Auckland Transport’s Bus Services group uses the following dimensions as guidelines for
bus stop design:
15 m long loading areas;
15 m lead-in to indented bus stops;
9 m lead-out of indented bus stops; and
9 m separation between buses within double, triple or longer stops.
Key attributes of the scenario are:
Higher spatial requirements;
A likely increase in the distance passengers will have to walk within the length of a stop
and from one stop to another; and
Reduced likelihood of bus stop failure by effectively increasing the number of buses that
can utilise the stop above the design capacity; however, if the desired 9-metre bus
Page 5
link to page 6 link to page 7

separation is maintained in practice then the improvement in bus stop failure rate would
be negligible.
Table 3 presents the total bus stop dimensions for the two scenarios for stops containing up to
three loading areas. Additional space is required for indented stops in both scenarios to allow
buses to enter and exit the stop. The larger stop dimensions in the Prioritise Bus Operations
scenario substantially increase the size of the stops compared to the Minimise Spatial
Requirements scenario.
Table 3: Bus stop dimensions for two scenarios, Minimise Spatial Requirements and Prioritise
Bus Operations.
Number of
Stop length (m)
Stop
loading
Minimise
type
areas
Prioritise Bus
Spatial
per stop
Operations
Requirements
Inline
1
15
15
2
30
39
3
45
63
Indente 1
30
39
d
2
45
63
3
60
87
Requiring a 9-metre separation between buses—as in the Prioritise Bus Operations scenario—
enables buses to enter and exit bus stop loading areas independently. However, one of the key
assumptions underlying this analysis is that buses form platoons at signalised intersections and
thus arrive at and depart from bus stops in groups. Thus, this assumption mitigates the
requirement for a large separation between loading areas and enables the use of a smaller 3-
metre gap between buses, as in the Minimise Spatial Requirements scenario.
Observations on key bus corridors in the city centre also support the suitability of a 3-metre
separation between buses. For example, at a busy stop on Symonds Street during the morning
peak (between Mount Street and St Paul Street), buses can be seen pulling into the stop with a
gap of approximately 2.5–3 metres between buses, as shown i
n Figure 2-1. Buses often departed
the stop in platoons, but they also had sufficient space to pull out into the bus lane independently
of the bus in front; despite the sharp angle of the turn causing buses to swing out into the adjacent
lane, no interference with general traffic was observed. Similar behaviour was also observed on
Fanshawe Street along Victoria Park during the evening peak.
Page 6

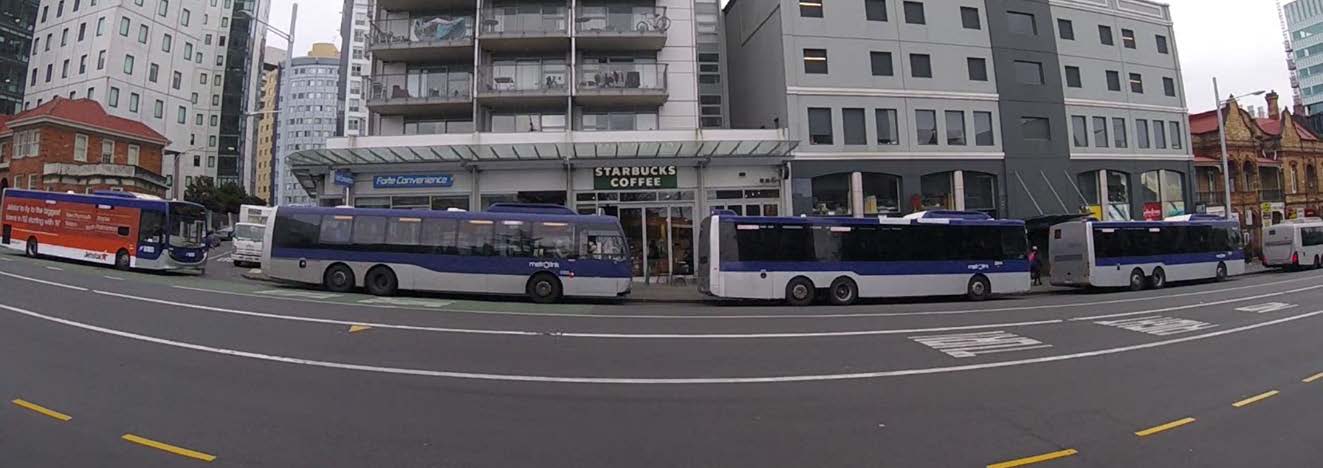
Figure 2-1: Buses pulled into a stop on Symonds Street during the morning peak.
It is worth noting that the exact stop dimensions at a specific location will vary depending on the
situation and will be determined as part of a detailed design or business case. The Transit
Cooperative Research Program (2015) observed that the recommended stop length cannot
always be obtained at the preferred location for a bus stop; in this situation, transit agencies will
commonly look for an alternative site nearby or make do with a shorter stop. In Auckland, it is
likely that the actual design dimensions will fall on a spectrum between the two scenarios
presented above, depending on factors such as funding and spatial constraints. For example, the
Prioritise Bus Operations scenario recommends a length of 87 metres for an indented triple stop,
but a stop of this length may simply not fit on many of the blocks in Auckland’s city centre.
2.3.2.
Preferred Bus Stop Length
Double or triple stops are preferred from an operational perspective. The assumption that all
buses in one platoon exit the stop before the next platoon of buses arrives holds best when stops
are divided into groups of two or three loading areas, so that buses are less likely to be held up by
the movements of other buses and are more able to enter and exit a stop within the specified time
period. In addition, in situations where bus arrivals and departures do not consistently occur in
platoons, quadruple or quintuple stops cannot be utilised as efficiently as two separate double or
triple stops (Transit Cooperative Research Program, 2013).
Stops with no more than three loading areas are also considered more desirable from a user
perspective. At a quadruple stop, for example, passengers waiting at the front of the stop may
have to run 50 metres or more to reach their bus if it pulls into the final loading area while the first
three loading areas are occupied. Furthermore, at this distance passengers may not be able to
read the bus headsign to determine whether it is their bus that has arrived. Therefore, quadruple
or quintuple stops provide a lower level of customer service than double or triple stops.
References
Rouphail, N., Tarko, A. & Li, J. (n.d.). Traffic Flow at Signalized Intersections. In N. Gartner, C. J.
Messer & A. K. Rathi (Eds.),
Revised Monograph on Traffic Flow Theory. Retrieved from
https://www.fhwa.dot.gov/publications/research/operations/tft/ on 17 November 2015.
State Transit Authority of New South Wales (2011).
Bus Infrastructure Guide. Retrieved from
http://www.statetransit.info/publications/ on 19 November 2015.
Troutbeck, R. J. & Brilon, W. (n.d.). Unsignalized Intersection Theory. In N. Gartner, C. J. Messer
& A. K. Rathi (Eds.),
Revised Monograph on Traffic Flow Theory. Retrieved from
https://www.fhwa.dot.gov/publications/research/operations/tft/ on 17 November 2015.
Page 7

Transit Cooperative Research Program (2015).
TCRP Synthesis 117: Better On-Street Bus Stops
– A Synthesis of Transit Practice. Washington, DC: Transportation Research Board. Retrieved
from
http://www.trb.org/Main/Blurbs/172376.aspx on 19 November 2015.
Transit Cooperative Research Program (2013). Bus Transit Capacity. In
TCRP Report 165:
Transit Capacity and Quality of Service Manual (3rd ed.). Washington, DC: Transportation
Research Board. Retrieved from
http://www.trb.org/Main/Blurbs/169437.aspx on 22 January
2015.
Transit Cooperative Research Program (1996). Street-Side Factors. In
TCRP Report 19:
Guidelines for the Location and Design of Bus Stops. Washington, DC: National Academy Press.
Retrieved from
http://www.trb.org/Main/Blurbs/153827.aspx on 17 November 2015.
Page 8
Document Outline