


Whangarei to Auckland – Connecting Northland
Jim Sephton
August 2017
Programme Business Case
Whangarei to Auckland – Connecting Northland
Copyright information
This publication is copyright © NZ Transport Agency. Material in it may be reproduced for personal
or in-house use without formal permission or charge, provided suitable acknowledgement is made to
this publication and the NZ Transport Agency as the source. Requests and enquiries about the
reproduction of material in this publication for any other purpose should be made to:
Manager, Information
NZ Transport Agency
Private Bag 6995
Wellington 6141
The permission to reproduce material in this publication does not extend to any material for which
the copyright is identified as being held by a third party. Authorisation to reproduce material
belonging to a third party must be obtained from the copyright holder(s) concerned.
Disclaimer
The NZ Transport Agency has endeavoured to ensure material in this document is technically
accurate and reflects legal requirements. However, the document does not override governing
legislation. The NZ Transport Agency does not accept liability for any consequences arising from the
use of this document. If the user of this document is unsure whether the material is correct, they
should refer directly to the relevant legislation and contact the NZ Transport Agency.
More information
NZ Transport Agency
May 2015
If you have further queries, call our contact centre on 0800 699 000 or write to us:
NZ Transport Agency
Private Bag 6995
Wellington 6141
This document is available on the NZ Transport Agency’s website at
www.nzta.govt.nz
NZ TRANSPORT AGENCY
August 2017
2
Whangarei to Auckland – Connecting Northland
APPROVAL
PREPARED BY:
REVIEWED BY:
ENDORSED BY:
APPROVED BY:
Tony Innes
Derek McCoy
[JOB TITLE]
[JOB TITLE]
STAKEHOLDER PROJECT
DELEGATED AUTHORITY -
SPONSORS
STAKEHOLDERS
DATE:
DATE:
DATE:
DATE:
REVISION STATUS*
REVISION NUMBER:
IMPLEMENTATION DATE:
SUMMARY OF REVISION
1
April 2016
Part A only
2
June 2016
Part B draft
3
16th June 2016
For NZTA review
4
25 July 2016
Final for NZTA approval
4
23rd August 2017
Final (consistent treatment of DM)
TEMPLATE STATUS
REVISION NUMBER:
IMPLEMENTATION DATE:
SUMMARY OF REVISION
1.0
3 June 2013
1st Edition
1.1
27 April 2015
Update of the 1st edition
NZ TRANSPORT AGENCY
August 2017
3
link to page 1 link to page 3 link to page 3 link to page 3 link to page 7 link to page 7 link to page 8 link to page 12 link to page 15 link to page 16 link to page 16 link to page 16 link to page 16 link to page 17 link to page 17 link to page 17 link to page 18 link to page 20 link to page 22 link to page 22 link to page 22 link to page 22 link to page 23 link to page 23 link to page 23 link to page 23 link to page 25 link to page 25 link to page 25 link to page 26 link to page 27 link to page 27 link to page 27 link to page 29 link to page 29 link to page 32
Whangarei to Auckland – Connecting Northland
TABLE OF CONTENTS
Whangarei to Auckland – Connecting Northland ........................................................................................................... 1
Approval ............................................................................................................................................................... 3
Revision Status* .................................................................................................................................................. 3
Template Status ................................................................................................................................................... 3
Supporting Documents ........................................................................................................................................ 7
Glossary of Terms ............................................................................................................................................... 7
EXECUTIVE SUMMARY ..................................................................................................................................................................... 8
PART A – THE STRATEGIC CASE............................................................................................................................................. 12
2.1
Geographic and Environmental Context ................................................................................................. 15
2.2
Social Context ......................................................................................................................................... 16
2.2.1
Region ............................................................................................................................................. 16
2.2.2
Growth ............................................................................................................................................. 16
2.2.3
Communities .................................................................................................................................... 16
2.3
Transport Context ................................................................................................................................... 17
2.3.1
Economic importance ...................................................................................................................... 17
2.3.2
Multimodal network .......................................................................................................................... 17
2.3.3
Road network .................................................................................................................................. 18
2.4
Environmental Constraints and Opportunities ........................................................................................ 20
3.1
Investment Partners ................................................................................................................................ 22
3.1.1
NZ Transport Agency ...................................................................................................................... 22
3.1.2
KiwiRail ............................................................................................................................................ 22
3.2
Key stakeholders .................................................................................................................................... 22
3.3
Alignment to Existing Strategies / Organisational Goals ........................................................................ 23
3.3.1
One Network Road Classification (ONRC) ...................................................................................... 23
3.3.2
Upper North Island Freight Story ..................................................................................................... 23
3.3.3
Tai Tokerau Economic Action Plan ................................................................................................. 23
3.4
Workshop collaboration .......................................................................................................................... 25
3.5
Customer Insights ................................................................................................................................... 25
3.5.1
Qualitative data ................................................................................................................................ 25
3.5.1
Qualitative data ................................................................................................................................ 26
4.1
Defining the Problem .............................................................................................................................. 27
4.2
The Benefits of Investment ..................................................................................................................... 27
4.3
Identification of uncertainty and Risk ...................................................................................................... 27
4.4
Problem 1: Poor resilience constrains economic growth ........................................................................ 29
4.4.1
The Evidence ................................................................................................................................... 29
4.4.2
Implications of the Evidence ............................................................................................................ 32
NZ TRANSPORT AGENCY
August 2017
4
link to page 33 link to page 33 link to page 36 link to page 37 link to page 37 link to page 38 link to page 38 link to page 38 link to page 39 link to page 39 link to page 39 link to page 40 link to page 42 link to page 43 link to page 47 link to page 47 link to page 48 link to page 50 link to page 51 link to page 51 link to page 53 link to page 53 link to page 54 link to page 54 link to page 55 link to page 56 link to page 59 link to page 62 link to page 62 link to page 63 link to page 64 link to page 64 link to page 64 link to page 65 link to page 65 link to page 66 link to page 66 link to page 66
Whangarei to Auckland – Connecting Northland
4.5
Problem 2: Safety ................................................................................................................................... 33
4.5.1
The Evidence ................................................................................................................................... 33
4.5.2
Implications of the Evidence ............................................................................................................ 36
4.6
Problem 3: Reduced economic investment in Northland ....................................................................... 37
4.6.1
The Evidence ................................................................................................................................... 37
4.6.2
Implications of the Evidence ............................................................................................................ 38
4.7
Investment Objectives ............................................................................................................................ 38
4.7.1
Investment Objective 1: Resilience ................................................................................................. 38
4.7.2
Investment Objective 2: Safety ........................................................................................................ 39
4.7.3
Investment Objective 3: Northland Economic Development ........................................................... 39
4.7.4
Summary ......................................................................................................................................... 39
4.8
THE KEY PERFORMANCE ATTRIBUTES AND MEASURES .............................................................. 40
PART B – DEVELOPING THE PROGRAMME........................................................................................................................ 42
5.1
Alternative and Option Generation ......................................................................................................... 43
5.2
Option Long List ...................................................................................................................................... 47
5.3
Alternative and option assessment ......................................................................................................... 47
5.3.1
Option Analysis ................................................................................................................................ 48
5.3.2
Options which do not address the investment objectives ............................................................... 50
6.1
Programme Development ....................................................................................................................... 51
6.1.1
Initial Programme Development ...................................................................................................... 51
6.1.2
Further Programme Development ................................................................................................... 53
6.2
Do-minimum ............................................................................................................................................ 53
6.3
Programme assessment ......................................................................................................................... 54
6.3.1
Foundation Programme Assessment .............................................................................................. 54
6.3.2
Further Programme Assessment .................................................................................................... 55
6.3.3
Other Considerations ....................................................................................................................... 56
7.1
Programme overview .............................................................................................................................. 59
7.2
Programme implementation strategy and trigger points ......................................................................... 62
7.2.1
Timing and Triggers ......................................................................................................................... 62
7.2.2
Implementation Partners ................................................................................................................. 63
8.1
Programme outcomes ............................................................................................................................ 64
8.1.1
Resilience ........................................................................................................................................ 64
8.1.2
Safety Outcome ............................................................................................................................... 64
8.1.3
Economic Growth (90km/h) Outcome ............................................................................................. 65
8.1.4
Benefits Delivered Spatially ............................................................................................................. 65
8.2
Programme risk....................................................................................................................................... 66
8.2.1
Feasibility ......................................................................................................................................... 66
8.2.2
Affordability ...................................................................................................................................... 66
NZ TRANSPORT AGENCY
August 2017
5
link to page 67 link to page 68 link to page 68 link to page 68 link to page 69 link to page 69 link to page 69 link to page 69 link to page 69 link to page 70 link to page 70 link to page 72 link to page 72 link to page 72 link to page 74 link to page 75 link to page 76 link to page 76 link to page 77 link to page 78 link to page 78 link to page 79 link to page 80 link to page 81 link to page 86 link to page 86 link to page 86 link to page 86 link to page 88 link to page 89 link to page 90 link to page 91 link to page 92 link to page 93
Whangarei to Auckland – Connecting Northland
8.2.3
Stakeholder / Public Considerations ............................................................................................... 67
8.2.4
Cultural Heritage, Environmental and Social Responsibility Considerations .................................. 68
8.2.5
Safety ............................................................................................................................................... 68
8.2.6
Economy .......................................................................................................................................... 68
8.3
Programme Opportunities ....................................................................................................................... 69
8.3.1
Social ............................................................................................................................................... 69
8.3.2
Tourism ............................................................................................................................................ 69
8.3.3
Land Use Integration ....................................................................................................................... 69
8.4
Value for Money ...................................................................................................................................... 69
8.5
Sensitivity analysis .................................................................................................................................. 70
8.5.1
Scenario Outcomes ......................................................................................................................... 70
8.6
Assessment profile ................................................................................................................................. 72
8.6.1
Strategic Fit ..................................................................................................................................... 72
8.6.2
Effectiveness ................................................................................................................................... 72
8.6.3
Efficiency ......................................................................................................................................... 74
9.1
Indicative Cost ........................................................................................................................................ 75
9.2
Funding Arrangements ........................................................................................................................... 76
9.3
Affordability ............................................................................................................................................. 76
PART C – DELIVERING AND MONITORING THE PROGRAMME .............................................................................. 77
10.1 Programme governance and reporting ................................................................................................... 78
10.2 Stakeholder engagement and communications plan ............................................................................. 78
10.3 Programme performance and review ..................................................................................................... 79
Appendix A – Network Plan ............................................................................................................................... 80
Appendix B - Environmental Plans .................................................................................................................... 81
Appendix C –Strategy Documents .................................................................................................................... 86
Government Policy Statement on Land Transport 2015/16 – 2024/25 ......................................................... 86
Regional Land Transport Strategy ................................................................................................................. 86
NZ Transport Agency ..................................................................................................................................... 86
Appendix D –Public Consultation report ............................................................................................................ 88
Appendix E – ILM MAp ...................................................................................................................................... 89
Appendix F –One Network Road Classification ................................................................................................ 90
Appendix G – Option Development and ANalysis ............................................................................................. 91
Appendix H – Programme analysis and Assessments ...................................................................................... 92
Appendix I – Implementation Plan ..................................................................................................................... 93
NZ TRANSPORT AGENCY
August 2017
6
Whangarei to Auckland – Connecting Northland
SUPPORTING DOCUMENTS
30 Year Transport Strategy for Northland, 2010
Brynderwyn North Notice of Requirement for alteration to designation,
Northland Regional Transport Strategy
Rodney – Kaipara Co-ordinating Land Use Study (Dome Brynderwyn sub-region)
Tai Tokerau Northland Economic Action Plan
Tai Tokerau Northland Regional Growth Study
Upper North Island Ports Study, 2012
GLOSSARY OF TERMS
Benefit Cost Ratio
BCR
Coastal Marine Area
CMA
Detailed Business Case
DBC
Indicative Business Case
IBC
Ministry of Business Innovation and Employment
MBIE
Multi-Criteria Assessment
MCA
Net Present Value
NPV
One Network Road Classification
ONRC
Programme Business Case
PBC
Road Controlling Authority
RCA
Road of National Significance
RoNS
Scheme Assessment Report
SAR
State Highway 1
SH1
State Highway 12
SH12
State Highway 14
SH14
State Highway 15
SH15
NZ TRANSPORT AGENCY
August 2017
7
link to page 9

Whangarei to Auckland – Connecting Northland
EXECUTIVE SUMMARY
The Northland economy performs poorly when compared
to other regions of New Zealand. This is particularly
disappointing given its proximity to Auckland. One of the
key enablers for improving the economic performance of
Northland is transport accessibility. This has been
confirmed through the recent all-of-government Tai
Tokerau Northland Economic Action Plan.
State Highway One (SH1) plays a critical transport
accessibility role, connecting Northland with New Zealand.
Improving the northern state highway network will help
Northland contribute to the so-called ‘golden triangle’ of
Auckland, Hamilton and Tauranga. Together these three
centres generate 36% of New Zealand’s Gross Domestic
Product (GDP) with a prediction for this to rise to 47% by
2026. Investment in transport between Auckland and
Whangarei will contribute significantly to this.
At present the corridor between Auckland and Whangarei
is often closed, its alignment is comparatively unsafe by
national standards and the cost of travel is an impediment
to economic growth in Northland. This is not consistent
with the One Network Road Classification (ONRC)
aspirations of a National (High Volume) Strategic Route.
Providing a safer, more resilient and cheaper route
between Auckland and Whangarei not only provides better
accessibility between Auckland and Northland, but also
Northland and the rest of New Zealand, and indeed the
rest of the world through the Ports of Auckland and
Auckland Airport.
A comprehensive and collaborative approach has been
adopted with stakeholders to develop this Programme
Business Case (PBC). This has resulted in alignment on the
problems, benefits and investment objectives for the
corridor as outlined in
Figure 1.
The collaborative PBC approach has involved the
development of options to best address the problems
identified and then the compilation of a suite of
programmes from these options to best deliver the
outcomes sought by the agreed investment objectives.
NZ TRANSPORT AGENCY
August 2017
8
link to page 10 link to page 11


Whangarei to Auckland – Connecting Northland
Figure 1 : Project problems, benefits and investment objectives
Ten programmes were developed and assessed in detail, ranging from lower-cost interventions to
programmes that aimed to fully meet the ONRC aspirations for the corridor.
The recommended programme best balances achieving the desired investment outcomes in an
economically efficient manner. This has been achieved through a combination of operational and
capital interventions. The recommended programme and performance against the investment
objectives is outlined
in Figure 2.
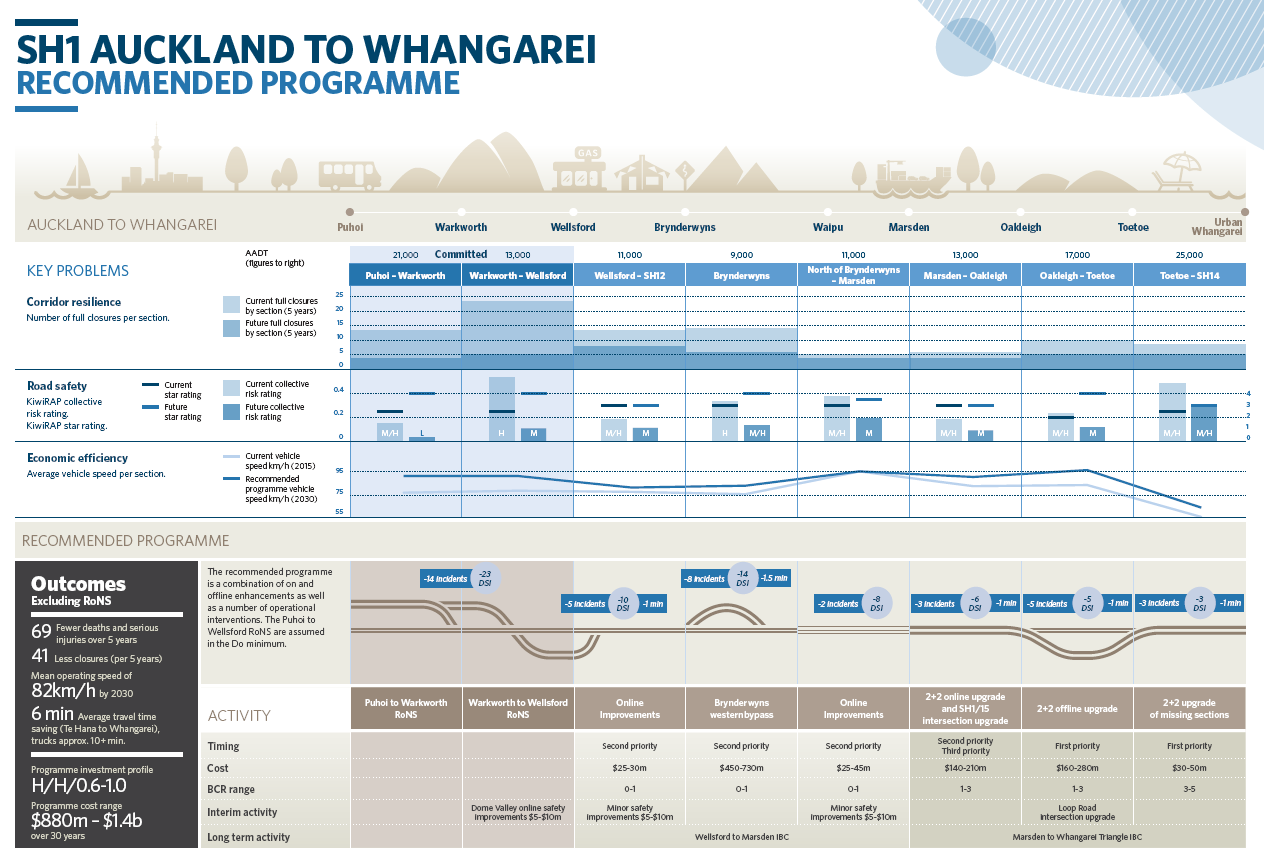
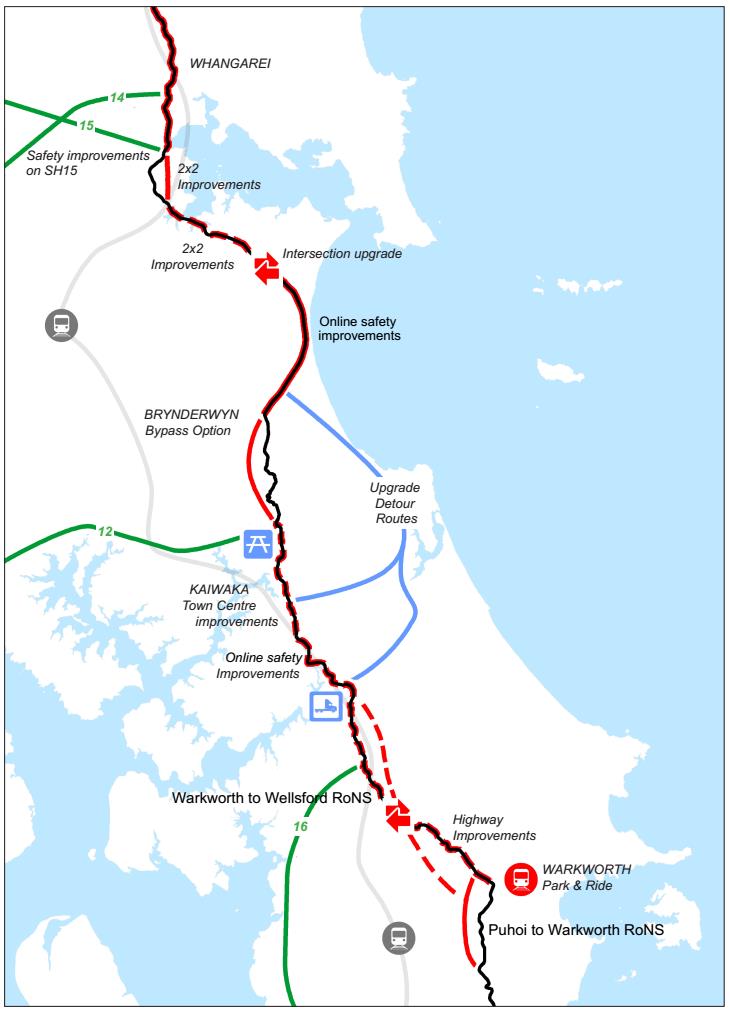
The recommended programme includes a suite of operation interventions including improved
signage, targeted driver behaviour programmes, rest areas, truck stops, park n ride facilities and
detour routes will also be upgraded to be fully HPMV capable. Capital projects are also part of the
recommended programme. The recommended programme is shown
in Figure 3.
The outcomes achieved by the recommended programme include:
PBC Investment Outcomes
•
6 min average travel time saving (Te Hana to
Whangarei), trucks approx. 10+ min
•
Mean operating speed of 82km/h
•
69 fewer deaths and serious injuries every five years
•
$880M - $1.4B cost, over 30 years
NZ TRANSPORT AGENCY
August 2017
9
Whangarei to Auckland – Connecting Northland
Figure 2: Recommended programme summary
The benefit cost ratio (BCR) for the recommended programme is between 0.6 - 1.0 and best matches
the level of investment required to deliver the investment outcomes sought. As well as these
transport outcomes, opportunities exist to deliver further benefits for the local, regional and national
economy, including social, economic and land use benefits.
The recommended programme has an investment profile of H/H/0.6-1.0.
The recommended programme has been assessed to carry manageable implementation risks.
Implementation of the programme is initially focussed on the most immediate safety areas,
improving the form of the connection between Whangarei and SH15 (Port), followed by the
Brynderwyn Hills bypass and then the remaining components of the programme. Due to the economic
efficiency of some projects within the programme, implementation may be subject to delays in order
to obtain funding.
The recommended programme meets the investment outcomes sought for the corridor,
connecting Northland with a safer, more resilient and less costly journey that will enable the
growth of the Northland economy. This is achieved through a wide range of projects along the
corridor length.
NZ TRANSPORT AGENCY
August 2017
10
Whangarei to Auckland – Connecting Northland
Figure 3: Recommended programme
Operational improvements:
➢
Licensing and
education programme
➢
Detour route legibility
with improved signage
➢
Travel times on signs
➢
Enforcement and
operational
improvements
NZ TRANSPORT AGENCY
August 2017
11
Whangarei to Auckland – Connecting Northland
PART A – THE STRATEGIC CASE
NZ TRANSPORT AGENCY
August 2017
12

Whangarei to Auckland – Connecting Northland
1.
INTRODUCTION
This Programme Business Case (PBC) considers the case for investment to address problems on SH1
between Whangarei and Puhoi. Whilst the PBC is focussed on SH1, it also includes consideration of
the role of SH15, including the newly proposed inland freight route link connecting SH1 and SH14 via
Loop Road and Otaika Valley Road and must be considered in the multi-modal context of the rail and
coastal shipping modes that also operate in the corridor.
As shown in Figure 1, this PBC is part of a wider suite of corridor plans examining key journeys and
routes in the Tai Tokerau Northland region.
Figure 4: PBC context
The Tai Tokerau Northland economy is one of New Zealand’s poorest performers and, given its
proximity to the country’s largest and strongest performing centre there is real opportunity to
improve this current situation. The recently completed Ministry of Business, Innovation and
Employment (MBIE) Tai Tokerau Northland Economic Action Plan sets out an All-of-Government plan
to revitalise the Northland economy. Transport connectivity is a key part of this plan, identified both
in its own right and as a key contributor to a range of identified opportunities.
Connecting Northland is an integrated transport approach which recognises the importance of
improving transport access within a multi-modal environment. This section of SH1 has a nationally
important function, linking Northland with the rest of New Zealand and the world (through
international ports and airports). SH1 has been identified in the One Network Road Classification
(ONRC) as a National (high volume) road to Wellsford and a National road between Wellsford and
Whangarei. It has been upgraded to allow the operation of full High Productivity Motor Vehicles
NZ TRANSPORT AGENCY
August 2017
13
Whangarei to Auckland – Connecting Northland
(HPMVs). It currently has a dual role providing for local and inter-regional light and heavy vehicle
(freight) traffic between major centres of population and economic activity. There is a rail corridor
between Auckland and Whangarei, which operates freight services, and a deep water port, NorthPort,
at Marsden Point.
This PBC has been developed with stakeholders and investors to ensure that all parties are directing
change and improvement in the right areas. In particular it:
• Confirms (with minor refinement) the Strategic Case problems and benefits;
• confirms the need to invest and the case for change;
• Develops investment objectives;
• Is informed by customer insights;
• Investigates options and alternatives to address the problems in the corridor; and
• Identifies a preferred programme of works to address the problems in the corridor;
• identifies the key asset and non-asset based projects that will support the programme
outcomes, including proposed priority and timing, and
• seeks the early approval of decision-makers to develop subsequent project-based business
cases.
NZ TRANSPORT AGENCY
August 2017
14
link to page 15


Whangarei to Auckland – Connecting Northland
2.
PROGRAMME CONTEXT
2.1
GEOGRAPHIC AND ENVIRONMENTAL CONTEXT
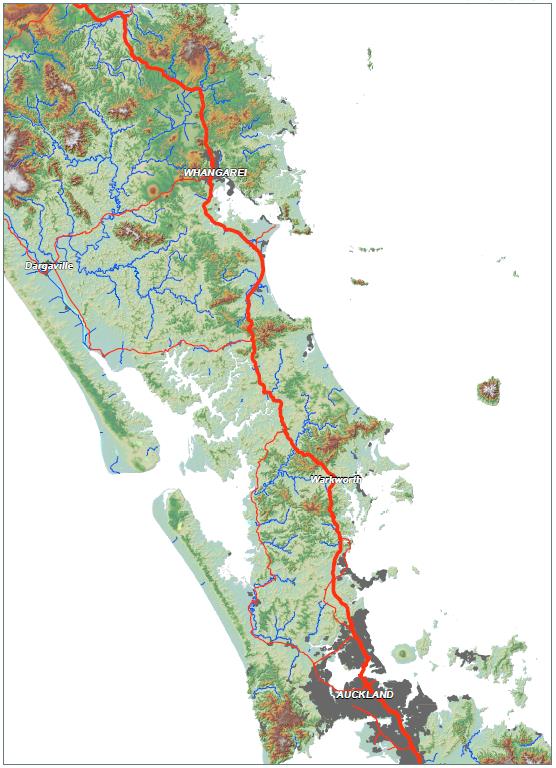
As outlined
in Figure 5, SH1 traverses a broad range of terrain and environments along the 115km
distance between Whangarei and Puhoi. Generally, the terrain is hilly between Puhoi and Waipu, with
three distinct ranges crossed, being Schedewys Hill, Dome Valley and the Brynderwyn Hills. The
ground conditions are challenging with poor soil conditions affecting the current performance and
alignment of SH1. The geographic and geological conditions through these sections create challenges
for road alignment (both vertical and horizontal) with increased cost to build and operate
infrastructure.
The corridor is close to the coastline in a number of locations and therefore traverses a number of
different catchment areas. Over the hillier sections of the route the environment is a combination of
productive forest and native bush. In the less hilly sections, pastoral farming is more prevalent.
There are a number of Department of Conservation (DoC) reserves along the route, generally
protecting native bush areas.
North of the Brynderwyn Hills, the terrain flattens out and the area is predominantly used for farming
at both a lifestyle block and larger scale.
Figure 5: Geographic and environmental context
Brynderwyn Hills
The Dome Valley
Schedewys Hill
NZ TRANSPORT AGENCY
August 2017
15
Whangarei to Auckland – Connecting Northland
2.2
SOCIAL CONTEXT
2.2.1
Region
Northland has one of the most deprived populations in the country. While 20% of New Zealand’s
population is in the lowest quartile of the deprivation index, the equivalent measure for Northland is
35%.
Economically this story has two distinct extremes. Auckland is New Zealand’s largest economy, the
economic engine room of the country. In contrast, Northland is one of the most economically
deprived areas of the country.
Northland is a regional economy that has been underperforming relative to other New Zealand
regions and relative to its resource base for too long. The regional economy was impacted by the
Global Financial Crisis (e.g. a large reduction in tourists from the UK and the USA) and some
significant climatic events, both severe storms and drought conditions. The Far North and Kaipara
districts have similar economic structures, with a strong focus on primary production. Whangarei is
the region’s main urban and servicing centre with a higher concentration of manufacturing and
service industries.
Northland’s economy accounts for 2.5% of New Zealand’s Gross Domestic Product (GDP). Nominal
GDP in the region increased by 2.6% per annum on average over the past five years, compared to the
national average of 4.1%. Northland has an unemployment rate three percentage points above the
national rate and nominal GDP per capita is 32% below the national average. Just over 20% of
Northland’s usually resident population live in areas that have the lowest deprivation score compared
to 10% nationally.
Northland’s relatively low population density and geographic remoteness have contributed to its
economic underperformance despite being in relatively close proximity to the strongly performing
Auckland economy.
2.2.2
Growth
A number of towns and settlements are located along the route. Warkworth is an identified growth
area in the Auckland Unitary Plan and considerable growth in population and employment is forecast
for this area. The Eastern Beachs (Snells Beach, Algies Bay, Sandspit, Omaha and Matakana) are
popular holiday desinations and are forecast for strong growth and an increasing permanent
population.
Further north, other towns along the route such as Wellsford, Te Hana and Kaiwaka have not
experienced growth for a number of years. The Mangawhai area (Kaipara District) has steady growth
forecast with a recent acceleration. Closer to Whangarei, the Ruakaka area is also identified for
considerable growth.
2.2.3
Communities
The SH1 corridor passes through a number of towns and communities between Auckland and
Whangarei. The following communities are situated on SH1 with direct connection to the state
highway:
• Warkworth
• Wellsford
• Te Hana
• Kaiwaka
NZ TRANSPORT AGENCY
August 2017
16
Whangarei to Auckland – Connecting Northland
• Brynderwyn
Townships situated along the corridor experience both positive and negative effects from the State
Highway. Access and pass by trade provide opportunities to these areas, while severance, road safety,
visual, emissions and noise effects reduce the sense of place to these areas.
A number of other towns are situated adjacent to the route with secondary connection to SH1:
• Puhoi
• Eastern Beachs
• Port Albert
• Mangawhai /Te Arai
• Langs Beach
• Ruakaka / Marsden Point
• Mangapai
Connectivity to these communities is seen as a critical factor. Outside of the settlements and towns, a
number of residents and farms enjoy direct access to the State Highway corridor.
2.3
TRANSPORT CONTEXT
2.3.1
Economic importance
Due to its geographic position and isolation from key markets, transport connections for the
Northland region are critical for its economic development. Efficient access to the large market and
economic opportunities of metropolitan Auckland as well as connectivity to the Auckland airport and
seaports at Northport, Auckland and Tauranga will help underpin future growth.
The recent MBIE Tai Tokerau Northland Economic Action Plan has identified the importance of the
transport network as a key enabler for economic growth in Northland and in particular the role of SH1
in providing access to the rest of the country.
Given the economic structure of the region with a high proportion of primary activities relying on
export markets, freight movements within the region and to Northport are of major strategic
importance. It is currently proposed to strengthen the road transport network connecting
Northland’s primary industry, forestry, with Northport through a new state highway (SH15), which will
provide a more resilient inland freight route.
2.3.2
Multimodal network
The current rail line provides very few services a day (and all freight services) and is subject to both
size and weight restrictions. Perhaps the biggest constraining factor to use of the rail line for the
corridor is the constraint of the urban Auckland rail network. Congestion on the Auckland Western
line is a significant constraint for rail from Northland adding cost and time delay to services. As the
Auckland commuter rail task increases, freight will be increasingly difficult to move through the area.
The line requires a significant investment to upgrade bridges, tunnels and operating systems if this
level of service is to be enhanced.
As a result of current constrianst to rail freight, usage of the freight rail service is restricted to
selected industries.
Coastal shipping plays an important role in the transport of freight out of Whangarei. Due to the
nature of shipping, this is restricted to moving large volumes of low value goods such as aggregate,
logs and oil.
NZ TRANSPORT AGENCY
August 2017
17
link to page 19 link to page 19
Whangarei to Auckland – Connecting Northland
2.3.3
Road network
The ONRC is a classification system that identifies the level of service, function and use of road
networks and state highways. The SH1 road corridor is identified as a National (High Volume) route
between Puhoi and Warkworth (the highest classification) and a National route from Wellsford to
Whangarei and SH15A, due to there role providing access between Whangarei and Auckland
(including international airport and port facilities).
SH1 between Auckland and Wellsford is classified by the ONRC as a ‘
High Volume’ route with the SH1
section between Wellsford and Whangarei and SH15A classified as a ‘
Strategic’ route. SH16, SH12 and
SH14 are classified as
‘Primary Collectors’. Appendix A includes a transport network plan, outlining
the critical local and strategic links in the network.
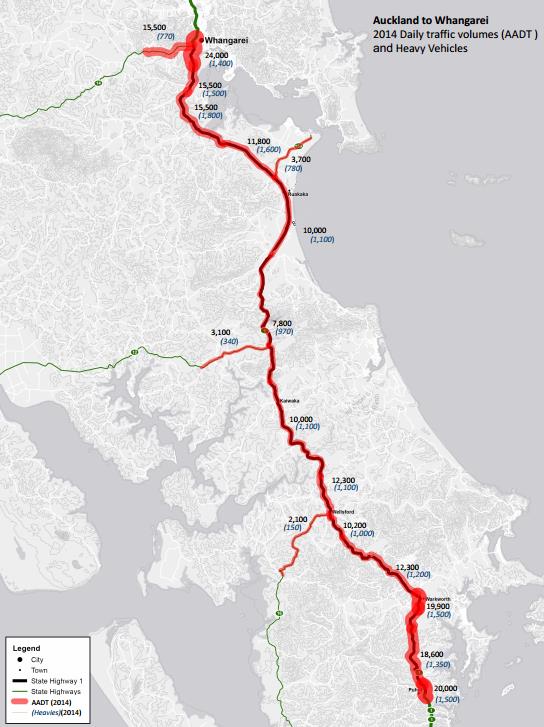
SH1 between Puhoi and Whangarei is over 115km in length and there are many variables to the form
of the road. In general the road is a single lane (in each direction) undivided carriageway.
Figure 6
summarises the current demand and shows that traffic flows range from 8,000 – 24,000 vehicles per
day. It indicates that the heaviest flows are between Whangarei and SH15 and between Wellsford and
Puhoi. Traffic growth has been assumed at a rate of 1.5% over the length of the corridor between
Wellsford and Whangarei.
Figure 6 also shows HCV flows per day, which range between 900 and 1800 and between 8-14% of
the traffic composition. It also shows that HCV growth has been greater than other general traffic
between 2010 and 2014. The greatest heavy vehicle flows are also between Whangarei and SH15 and
Warkworth and Puhoi.
There are a number of passing lanes along the corridor. From Puhoi to Wellsford, the corridor is
identified as a Road of National Significance (RoNS). The Puhoi to Warkworth section has statutory
approval for an offline, four-lane divided, motorway-standard road, which is currently being procured
through a Public Private Partnership (PPP) arrangement (with completion expected in 2021/2022).
Statutory approvals applications are currently being prepared for the Warkworth to Wellsford section.
NZ TRANSPORT AGENCY
August 2017
18
Whangarei to Auckland – Connecting Northland
Figure 6: Existing AADT
NZ TRANSPORT AGENCY
August 2017
19
link to page 21 link to page 21
Whangarei to Auckland – Connecting Northland
2.4
ENVIRONMENTAL CONSTRAINTS AND OPPORTUNITIES
There are a number of environmental and topographical constraints and opportunities along the
corridor that have influenced the development of this PBC.
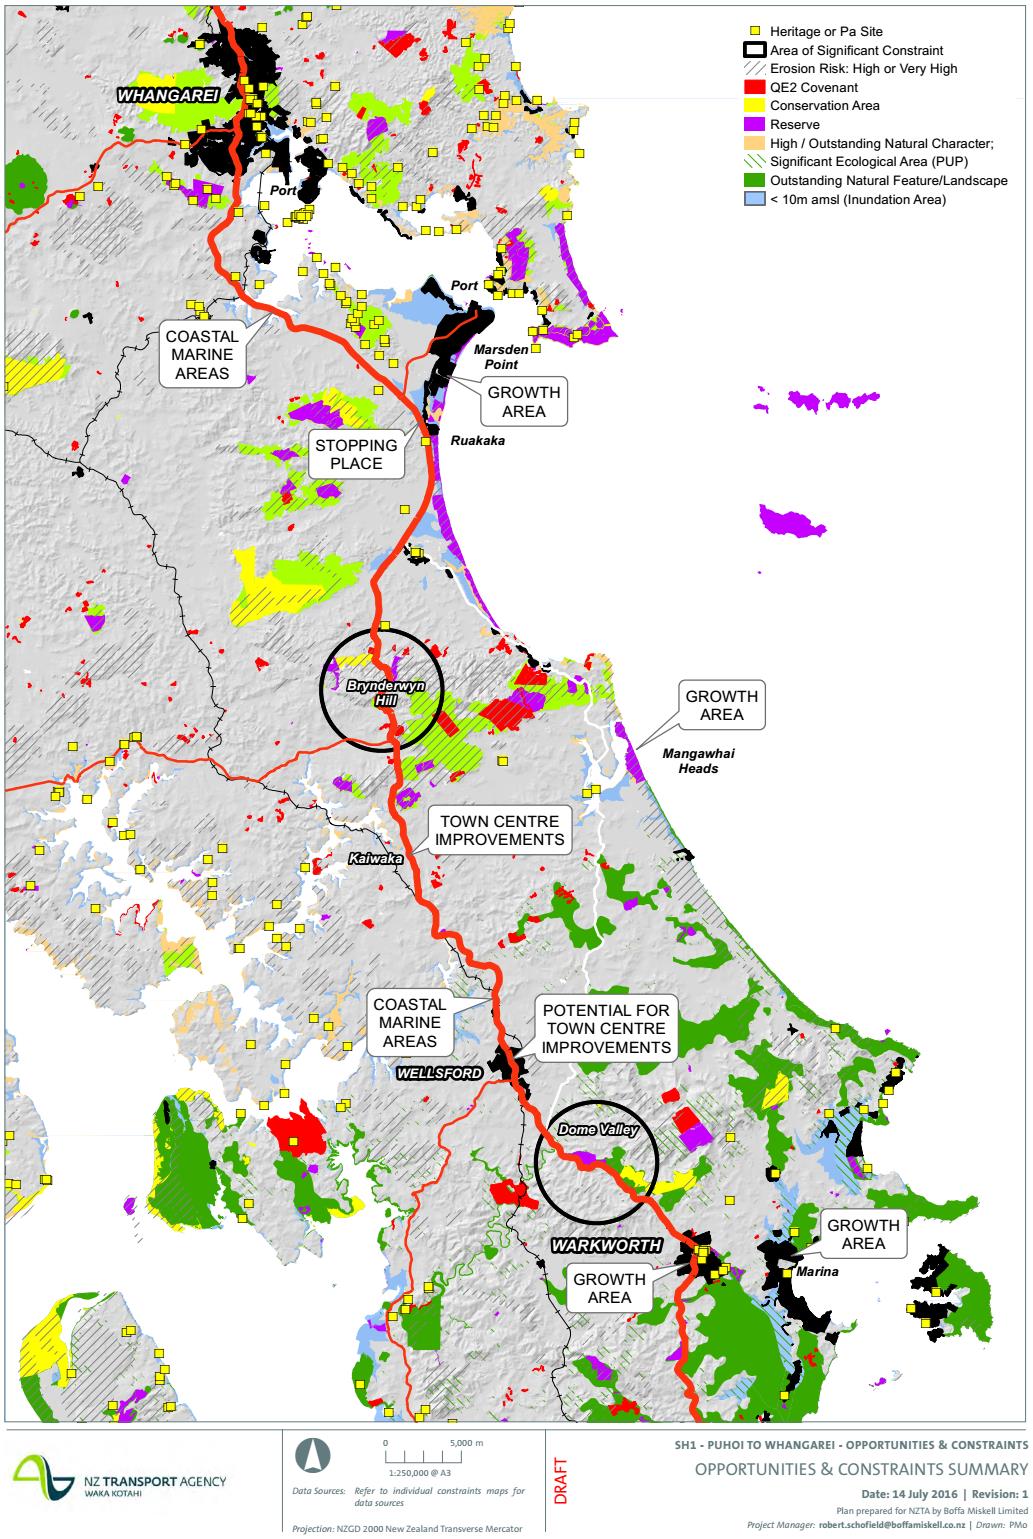
Figure 7 shows the landform and settlements along the route. Of particular note are settlements at
Warkworth, Wellsford, Te Hana and Kaiwaka, which are located immediately on the corridor.
Integration with these townships is a particular area of focus.
Figure 7 also indicates significant landforms through the Dome Valley and Brynderwyn Hills.
Appendix B includes other environmental constraint plans, which show Outstanding Natural
Landscapes and Features immediately adjacent to the route in the Dome Valley and Brynderwyn Hills.
Although it is important to ensure that any new infrastructure sensitively addresses these features,
they also represent an opportunity to attract visitors, potentially through well-designed stopping
places.
Appendix B identifies cultural and heritage features along the route. It highlights a particular
concentration of archaeological and pa sites to the south of Whangarei.
Recreation and tourism opportunities along the corridor are also highlighted, including the walking /
cycling tracks through the Dome Valley and close to the coast at Ruakaka. It also shows a trail
connection to the Brynderwyn Hills. A key consideration for this PBC is how best to maximise these
opportunities.
Environmental and social issues and opportunities were discussed at the stakeholder workshop. A
range of issues and opportunities were identified for the corridor. These issues and opportunities
were key inputs into the development of a social and environmental filter to test options against. The
social and environmental issues and constraints specific to this corridor are as follows:
• Sustainability of towns/centres along the route (Kaiwaka, Wellsford)
• Areas of cultural and heritage significance
• Sensitive ecological areas and receiving environments
• Landscape character, and protected landscapes
• Topography and soil types
• Biosecurity (e.g. Kauri die-back)
• Land use (e.g. productive landscapes)
• The quality of the journey, visual quality, tourism experience and stopping places
• Severance, accessibility, walking, including national pathways
• Cycling and relationship with national cycle network
NZ TRANSPORT AGENCY
August 2017
20
Whangarei to Auckland – Connecting Northland
Figure 7: Landform and Settlements
NZ TRANSPORT AGENCY
August 2017
21
Whangarei to Auckland – Connecting Northland
3.
PARTNERS AND KEY STAKEHOLDERS
The activities and problems relating to this section of SH1 affect a number of different organisations
and customers. The engagement through the PBC built upon engagement undertaken during the
development of the Strategic Case and widened the number of stakeholders to ensure a broader level
of engagement across this long corridor.
As well as these stakeholders, discussion and liaison with Heavy Haulage Association, KiwiRail, and
significant transport users (i.e. Northport) was also undertaken.
3.1
INVESTMENT PARTNERS
3.1.1
NZ Transport Agency
The Transport Agency is responsible for managing, operating, planning and improving state
highways.
As a partner to this business case, the Transport Agency is fundamentally concerned with ensuring
the safety and efficient travel for users on this section of the state highway network. Investment in
the state highway network may therefore be needed to help solve the problems identified in the
Strategic Case, and fully realise the benefits of investing.
3.1.2
KiwiRail
KiwiRail is responsible for the rail infrastructure that services the area. Investment by KiwiRail is
potentially required to fully realise the benefits as identified in the Strategic Case.
3.2
KEY STAKEHOLDERS
Based on engagement with stakeholders, the following key focus areas have been identified.
Generally, there is strong alignment between stakeholders regarding the focus areas for the corridor.
Stakeholders
Focus areas
NZ Transport Agency – Highway
Development of a programme of works that provides for the safe
Networks Operations
and efficient operation of SH1
NZ Transport Agency – Planning and
Development of a programme that has a sound evidence base and
Investment
represents a good investment
Focussed on a programme that is implemented with priority that
Whangarei District Council
links Whangarei more efficiently and safely with the rest of the
country, whilst also supporting growth aspirations
Focused on the interaction with the communities along the current
Kaipara District Council
corridor and understanding any implications and opportunities from
the programme
Development of a fundable programme that increases accessibility
Northland Regional Council
to Northland
Development of a programme quickly that provides for the
Northland Inc
increased economic growth of Northland
Particularly focussed on the Puhoi to Wellsford section and the
Auckland Transport
interface with identified growth areas
NZ TRANSPORT AGENCY
August 2017
22
Whangarei to Auckland – Connecting Northland
Stakeholders
Focus areas
Interface with growth areas and impact of programme on towns
Auckland Council
along the route such as Wellsford
Northport
A clear vision for the corridor to provide investors with certainty
Reducing the cost of travel in Northland and addressing key areas of
Freight Industry
deficiency such as the Bynderwyns and Loop Road
Iwi Partners
Cultural assessment of the corridor and road safety on the corridor
3.3
ALIGNMENT TO EXISTING STRATEGIES / ORGANISATIONAL GOALS
This section describes how the proposed “assessment” outcomes align to relevant national, regional,
sector and organisational strategies. Appendix C provides a detailed assessment of the applicable
strategies. The strategies with the most direct impact on this PBC are outlined below.
3.3.1
One Network Road Classification (ONRC)
The ONRC has been developed by the Road Efficiency Group (which is a collaboration between Road
Controlling Authorities across New Zealand) as a classification system that identifies the level of
service, function and use of road networks and state highways. The SH1 road corridor is identified as
a National (High Volume) route between Puhoi and Warkworth (the highest classification) and a
National route from Wellsford to Whangarei, due to its role providing access between Whangarei and
Auckland (including international airport and port facilities).
3.3.2
Upper North Island Freight Story
The Upper North Island Strategic Alliance undertook work in 2013 to support informed decision
making on key land use, infrastructure and investment, to improve the economic performance of the
Upper North Island and New Zealand. The Freight Story sought to understand the supply and
demand of industrial land, promote a strategic and integrated approach towards land use and
transport planning and identify constraints on the Upper North Island’s strategic rail and road
networks.
The problems and potential outcomes for the SH1 corridor are consistent with a number of the
critical freight issues that the Upper North Island Freight Story seeks to address. The Freight Story
confirmed strategic road and rail network constraints as their top critical issue and in particular,
ranks highly the inter-regional road corridor (Auckland/ Waikato/ Bay of Plenty) in terms of ‘scale of
benefit of collective partner focus’ in reducing the cost to do business.
3.3.3
Tai Tokerau Economic Action Plan
The Tai Tokerau Northland Economic Action Plan (February 2016) brings into focus a group of
projects that together will contribute to transforming Northland’s economy. This an all of
government action plan to improve the economic performance of Northland.
The Action Plan is short to medium term, covering 10 years; one that encourages new projects to be
included as existing projects come to completion. A broad range of organisations will contribute to
the success of the Action Plan, from business and Iwi/Maori through to not-for-profit organisations
and local and central government, inkling the Transport Agency.
The Study highlighted a range of opportunities for Northland. These have been narrowed down in
the development of the Action Plan to coalesce limited resources around the projects that will make
NZ TRANSPORT AGENCY
August 2017
23
Whangarei to Auckland – Connecting Northland
the greatest short to medium term difference. These projects have been organised together into
common work areas that fall under four broad work streams. The objectives for each are:
1. Enablers: To bring Northland’s transport, digital infrastructure, skills and capabilities and
water resources to a standard that creates an enabling environment for economic
development in Northland.
2. Land & Water: To identify and develop opportunities for more productive use of land and
water resources across a range of primary industry sectors.
3. Visitor Industry: To reduce the impact of seasonality, improve product dispersal across the
region and enhance tourism promotion.
4. Specialised Manufacturing & Services: To support the development of new innovation and
specialised manufacturing and service sectors.
The Tai Tokerau Northland Economic Action Plan has identified that the lack of robust transport
accessibility between Northland and the rest of the country is a contributing factor to the area’s poor
economic situation and has identified four ‘game changers’ to underpin business growth. The first of
these game changers is:
Transport: – better connectivity with Auckland, within the region and with export
markets. Northland is a place-based economy. Roading in particular, is critical for
Northland to develop and affects virtually every part of the economy.
A number of sectors, identified in the Tai Tokerau study as potential growth areas, require good links
to markets and suppliers in Auckland and beyond. These activities include:-
• Improving dairy and related production and processing
• Forestry and related wood processing, and especially growing wood processing including a
new saw and pulp mill at Ngawha.
• Aquaculture (although the scale of this is probably more limited)
• Horticulture
Other opportunities that may depend on good links to Auckland would include:
• Marine manufacturing (links to suppliers and markets)
• International education
• Tourism
NZ TRANSPORT AGENCY
August 2017
24
Whangarei to Auckland – Connecting Northland
3.4
WORKSHOP COLLABORATION
The PBC has been developed through a Collaborative process with active involvement from a technical
stakeholder group. The workshops held and attendance is outlined in the figure below:
NZTA
Northland
WDC
WRC
FNDC
KDC
Operations
Inc
Workshop 1: Agree the Problems,
Benefits and Investment
Workshop 2: Confirming the investment
objective, Agree assessment criteria and
development of options
Workshop 3: Evaluation of foundation
programmes, development of
recommended programmes
3.5
CUSTOMER INSIGHTS
Initial communications with the wider public occurred with the launch of the Connecting Northland
website which was promoted to attendees at a Transport for Future Urban Growth (TFUG) public open
day in Warkworth on 30 April 2016. A PDF flyer promoting the online engagement was distributed to
key stakeholders via email and provided to attendees at the TFUG event.
Promotion of the online engagement was through targeted Facebook ‘boosts’ (which were paid
advertising posts aimed at generating visitors to the Connecting Northland website). Each ‘boost’
generated significant site traffic with over 6,000 visits to the website ‘Tell us what you think’ page
during the engagement period.
3.5.1
Qualitative data
Submitters were asked to consider six areas of the state highway network and to identity which three
(if any) they would prioritise for future investment. The six areas were identified as:
-
Dome Valley
-
Kaiwaka to Te Hana
-
Brynderwyn Hill
-
Ruakaka to Waipu
-
Otaika Valley Road (to become SH15)
-
Through Whangarei
Of the 988 submissions received through the Connecting Northland website, 860 prioritised Dome
Valley (87%) as the area needing transport investment due to safety risks, speed restrictions and
resilience (significant detours during unplanned events). Brynderwyn Hills were the second priority
with 693 (70%) and the third priority was Kaiwaka to Te Hana with 433 (44%) responses. The state
highway section identified with the least priority was Ruakaka to Waipu with 102 responses.
NZ TRANSPORT AGENCY
August 2017
25
Whangarei to Auckland – Connecting Northland
3.5.1
Qualitative data
In order to support comments across a broad corridor, only two questions were posed:
1. Provide feedback on the areas you have prioritised
2. Any other comments on the corridor plan
Across the total survey responses, question two elicited the most written responses.Puhoi to
Wellsford (including the Dome Valley) was the strongest theme represented in the comments. Other
recurring themes included:
1. Resilience (SH closures due to unplanned events or weather)
2. Safety
3. Capacity (need to increase)
4. Connecting Northland
5. SH1 Brynderwyn Hill (rationale for northside safety improvements)
6. Otaika Valley/Loop Road
7. Quality of Northland roads
8. Maintenance and operations
9. Rail
Comments were also made on the timeliness of implementing projects, particularly in respect of
projects around Warkworth. A number of submissions were received on Penlink and these responses
have been forwarded on to Auckland Transport. The full Public Consultation Report – Auckland to
Whangarei PBC has been included in Appendix D.
NZ TRANSPORT AGENCY
August 2017
26
link to page 28
Whangarei to Auckland – Connecting Northland
4.
STRATEGIC ASSESSMENTS – OUTLINING THE NEED
FOR INVESTMENT
4.1
DEFINING THE PROBLEM
A facilitated workshop was held on 17th February 2015 with key members of the internal project
team to gain a better understanding of investment drivers and the need to invest in change during
the Strategic Case. Subsequent to this initial session a further facilitated workshop with key
stakeholders was undertaken on 19th March 2015. During the PBC, further evidence was gathered to
confirm the problems of the Strategic Case.
Based on this further evidence and discussion, Problem Statement 1 has been reworded to better
reflect the resilience focus of the problem, rather than the travel time reliability focus of the existing
wording. Problem Statement 3 has also been refined to better reflect the discussion and focus more
on its effect on investment in Northland. The weightings have remained the same. The revised
wording and weights are provided below:
• Problem 1: Poor resilience and costly journeys between Northland and key markets is
constraining economic growth and investor confidence (50%)
• Problem 2: The corridor is substandard for a national strategic route, resulting in a higher
number of crashes involving injury and death (30%)
• Problem 3: The lack of a long-term, integrated investment approach creates suboptimal
outcomes in transport and reduced economic investment in Northland (20%)
The revised Investment Logic Map is attached as Appendix B.
4.2
THE BENEFITS OF INVESTMENT
The benefits of successfully investing to address these problems were identified as part of the ILM
process in 2015. Four benefits were identified for the corridor when the problems were addressed.
These benefits are:
• Benefit 1: Improved safety (25%)
• Benefit 2: Improved corridor reliability (30%)
• Benefit 3: Stronger regional growth and national GDP (30%)
• Benefit 4: Better return on transport investment (15%)
During PBC Workshop 1 there was discussion and engagement in relation to the benefits as part of
preparing to develop investment objectives for the corridor. During this discussion there were no
changes proposed as it was agreed that the benefits and KPI’s developed during the Strategic Case
remain appropriate and relate well to the updated problem statements.
4.3
IDENTIFICATION OF UNCERTAINTY AND RISK
During the development of the investment objectives, stakeholders also gave consideration to the
risk and uncertainty of key assumptions that should be considered during the development of the
PBC.
Table 1 outlines the identified risks and uncertainties. Treatment of each risk and uncertainty
has been done on a case by case basis. Some risks have been used to develop project options, others
have form the backbone of a programme. The majority have been considered and will form the basis
of sensitivity tests carried out on project options or become trigger points within the recommended
programme.
NZ TRANSPORT AGENCY
August 2017
27
Whangarei to Auckland – Connecting Northland
Table 1: Uncertainty Log
Severity /
Risk
Time
Likelihood
Impact on
Comments
corridor
Land use changes
Growth forecasts Whangarei
Reasonably
Medium
As per WDC high
changes. Marsden Point
foreseeable
forecast for Marsden
increases population and
Point
employment
Warkworth growth as per
2020
More than
High
As per latest ART
SubRAP with Future Urban
Likely
modelling
area
Wellsford population
2020 post Hypothetical
Medium
Growth in accordance
increases
RoNS
with Warkworth
Kaipara District Council
2020 post Reasonably
Low
Growth in KDC higher
development
RoNS
foreseeable
than anticipated
following improved
access
Port activity
Bigger containers or bulk
Post
Hypothetical
High
Informed from the UNI
goods import role at
2020
Freight Study scenarios
Northport
and the Auckland Port
Study currently in
progress
Air travel
Whangarei Airport increases
unknown
Hypothetical
Low
Informed by Whangarei
domestic flights
Airport study
Whangarei Airport moves
unknown
Hypothetical
Low
Reduction in
accessibility to
Whangarei
Rail mode share
Investment in rail network,
unknown
Reasonably
Medium
Greater portion of
including Marsden Rail
foreseeable
freight transported by
connection
rail. Reduction in heavy
vehicles on road.
Inability of rail freight to
Risk of rail investment
travel through Auckland
More than
being ineffective due to
economically following
Post CRL
Medium
constraints outside the
increasing Auckland
likely
scope of this corridor.
commuter demand.
Economic development
NZ TRANSPORT AGENCY
August 2017
28
link to page 30 link to page 30 link to page 30 link to page 30
Whangarei to Auckland – Connecting Northland
Severity /
Risk
Time
Likelihood
Impact on
Comments
corridor
Development of key
unknown
Reasonably
Medium
Informed by Tai Tokerau
industries creating additional
foreseeable
Growth Study
jobs
Increased tourism industry
2025
Reasonably
Medium
Tourism in Northland
activity – more visitors
foreseeable
accounts for a large
proportion of industry
and affects traffic
volumes significantly
Transport baseline
Fuel prices
unknown
Reasonably
Medium
Change in fuel price will
foreseeable
affect vehicle travel and
traffic levels on the
corridor
4.4
PROBLEM 1: POOR RESILIENCE CONSTRAINS ECONOMIC GROWTH
“Poor resilience and costly journeys between Northland and key markets is constraining
economic growth and investor confidence.”
4.4.1
The Evidence
SH1 from Whangarei to Puhoi is the main transport connection between Northland and the rest of the
country. The evidence shows that the corridor suffers regularly from unplanned incidents, which
affect its resilience and availability.
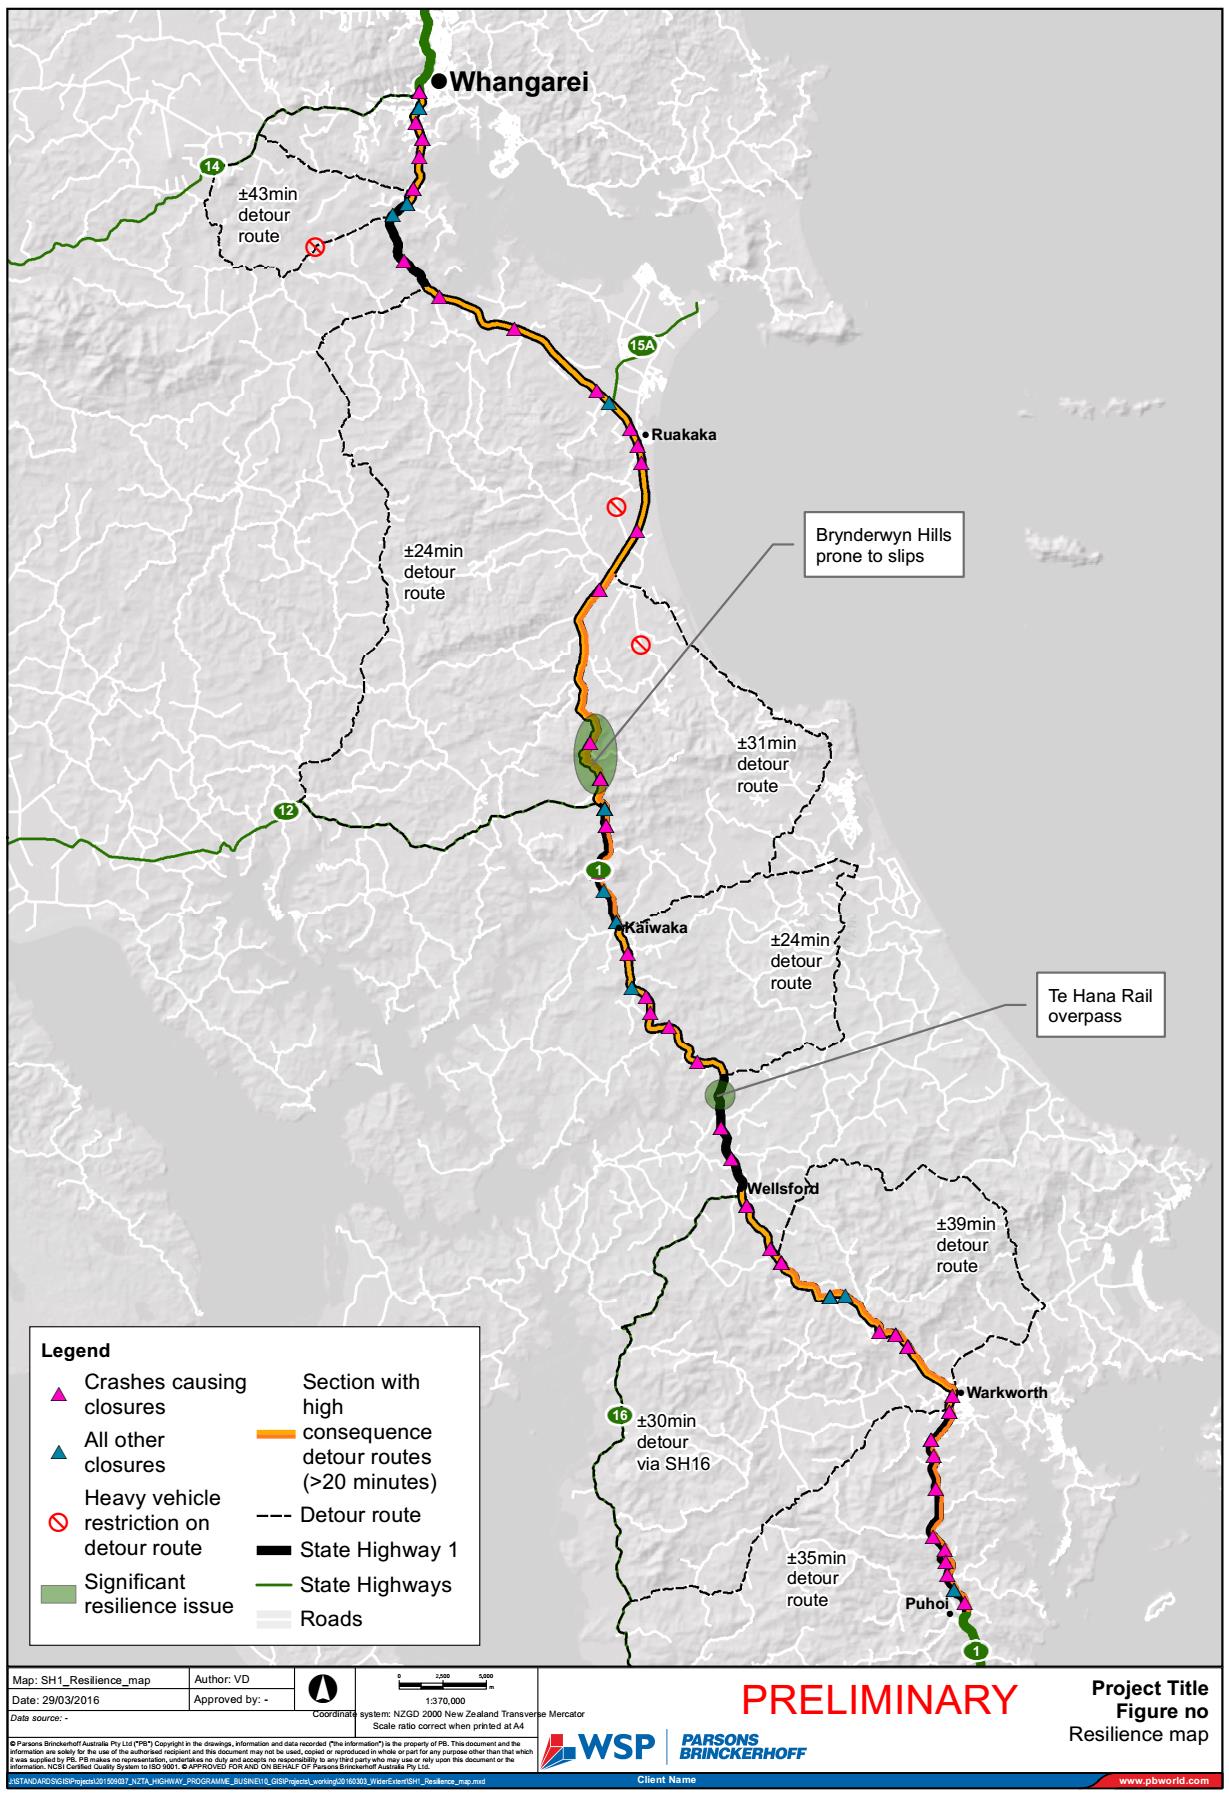
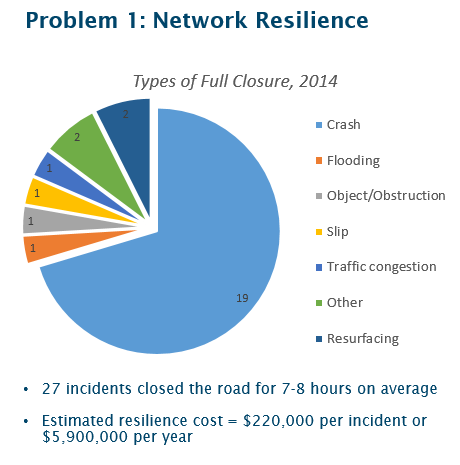
Further analysis of the Strategic Case evidence was undertaken and is summarised
in Figure 8. In
2014, there were 27 full closures along the route, with an average delay of 7-8 hours. This gave a
total of 216 hours of closure, equivalent to an average of nearly 20 hours per month. This data
excludes partial closures, which would further compound the issues. At the end of this study, 2015
closure data was made availiable.
Of these unplanned incidents, 70% resulted from crashes with the remainder a combination of other
predominantly environmental factors. The location of these closures is also shown
in Figure 8,
indicating resilience challenges in the Brynderwyn Hills as a priority. It also shows a high number of
crashes along the section between Whangarei and SH15.
During the 2015 year, 19 incidents occurred on the corridor with a average delay of 2-3 hours. While
significantly less than the 2014 year, the incidents followed similar trends in cause and location.
The detour routes for many of these closures are also challenging, as shown in
Figure 8. These
detour routes are not able to carry full HPMVs. These two factors, the length of the detour routes and
their inability to carry HPMVs, significantly restrict the ability to divert freight traffic away from
incidents.
Significant delay can occur during once a detour route is implemented. Delay time on
Figure 8
represent additional travel time for traffic once a detour is set up. Accounts from the network
operators suggest detour routes themselves are often subject to additional delay as a result of one-
lane briges, priority intersections and crashes on the detour routes themselves.
NZ TRANSPORT AGENCY
August 2017
29
Whangarei to Auckland – Connecting Northland
Figure 8: Unplanned Incidents and Detour Restrictions
HPMV detour
route restrictions
HPMV detour
route restrictions
NZ TRANSPORT AGENCY
August 2017
30
link to page 31 link to page 31 link to page 32
Whangarei to Auckland – Connecting Northland
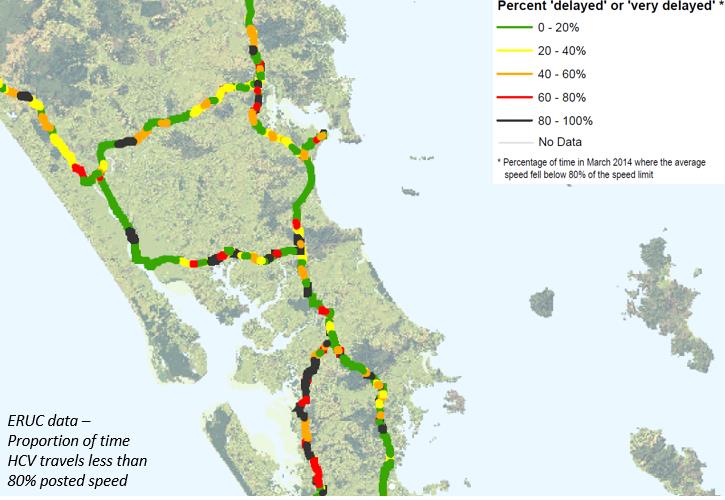
In terms of ‘costly journeys’, new analysis of travel times derived from the information used to collect
Electronic Road User Charges (ERUC) data is shown
in Figure 9. This analysis compares actual travel
times with posted speeds by road section. This shows that heavy vehicles are delayed on the hillier
sections of SH1, particularly through the Brynderwyn Hills, the Dome Valley and the town centres of
Wellsford and Warkworth.
Figure 9 : ERUC Data
Whangarei
SH1 corridor
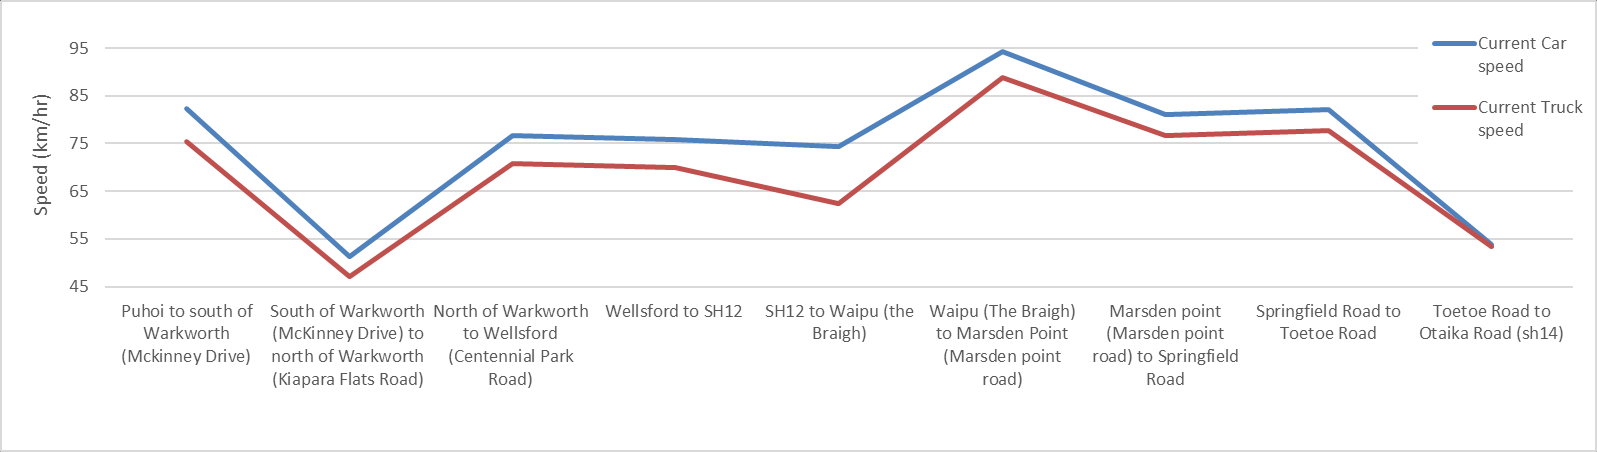
Speed data was analysed for the entire journey between Whangarei and Hamilton and as shown in
Figure 10 and
Figure 11, the trip north of Auckland is generally slower than the south of Auckland
sections of the route (but is not affected by the capacity induced peak-time issues). During peak
commuter periods Auckland can be slower, but generally the evidence shows that the average speed
on SH1 north of Auckland is slower than through Auckland and between Auckland and Hamilton.
Figure 10 : Current Speed in Corridor by Section
NZ TRANSPORT AGENCY
August 2017
31
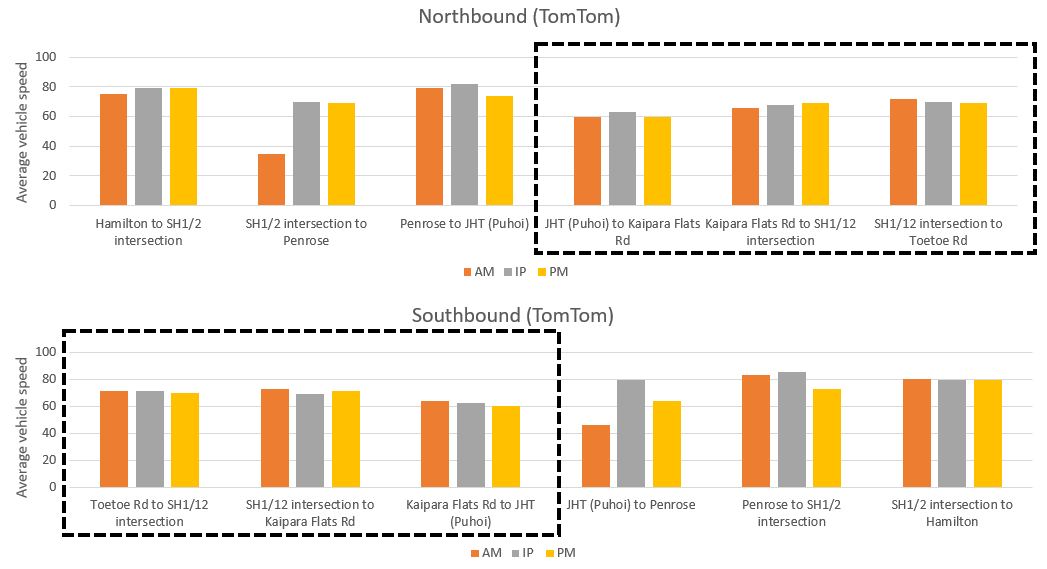
Whangarei to Auckland – Connecting Northland
Figure 11 : Speed Data Whangarei to Hamilton
4.4.2
Implications of the Evidence
This evidence strengthens the evidence gathered in the Strategic Case. The evidence has identified
that some travel time variability exists but the main issue is one of resilience when SH1 is not
available. With the route fully closed for over 200 hours a year and additional partial closures, there
is strong evidence to support a resilience problem.
The evidence has also shown that the average speed (and therefore cost of travel) for this section of
SH1 is slower than sections of highway with the same ONRC classification. Recent improvements to
the Waikato Expressway have targeted 110km/h speed limits and will likely see operating speeds in
excess of 90 km/h. The SH29 corridor, a ‘High Volume Strategic’ route, operates at an average speed
of 86km/h1. The evidence supports the perception of costly journeys in Northland. Based on
customer and industry insights, the high cost of travel is linked to decisions by industry and business
to invest in the region.
Establishing a direct link between economic performance and transport accessibility is difficult as
there are many factors that influence economic outcomes, particularly for regions like Northland.
However, a strong message from stakeholders and the evidence we have is that the performance of
the transport network, and particularly connectivity to a strong economic centre such as Auckland,
has a role to play in the economic performance of a region such as Northland. This is confirmed by
the Tai Tokerau Northland Economic Action Plan.
The evidence shows there is a problem with the resilience and performance of SH1 between Auckland
and Northland and that the Northland economy is one of the poorer performers in New Zealand. The
evidence therefore supports the following problem:
“Poor resilience and costly journeys between Northland and key markets is constraining
1 Based on 2014 ERUC light vehicle data between Pairere and Tauriko.
NZ TRANSPORT AGENCY
August 2017
32
link to page 34 link to page 34 link to page 35 link to page 35
Whangarei to Auckland – Connecting Northland
economic growth and investor confidence”
A 50% weighting was identified for this problem, as it is the most significant issue for the corridor.
Addressing this problem will make a real difference to the Northland economy.
4.5
PROBLEM 2: SAFETY
“The corridor is substandard for a national strategic route, resulting in a higher number of
crashes involving injury and death”
4.5.1
The Evidence
The Strategic Case undertook a review of crash data from 2010 to 2014. As part of this PBC,
available 2015 data was also reviewed. The 2015 safety records indicate that the corridor continues
to perform poorly from a safety perspective with 6 fatalities and 16 serious injuries recorded in the 9
months of available data.
We also know that in the first three months of 2016, there have been four fatal accidents on SH1
between Whangarei and the Brynderwyn Hills, which have not yet been included in CAS. An
assessment of these crashes shows a similar pattern to the analysis undertaken in the Strategic Case.
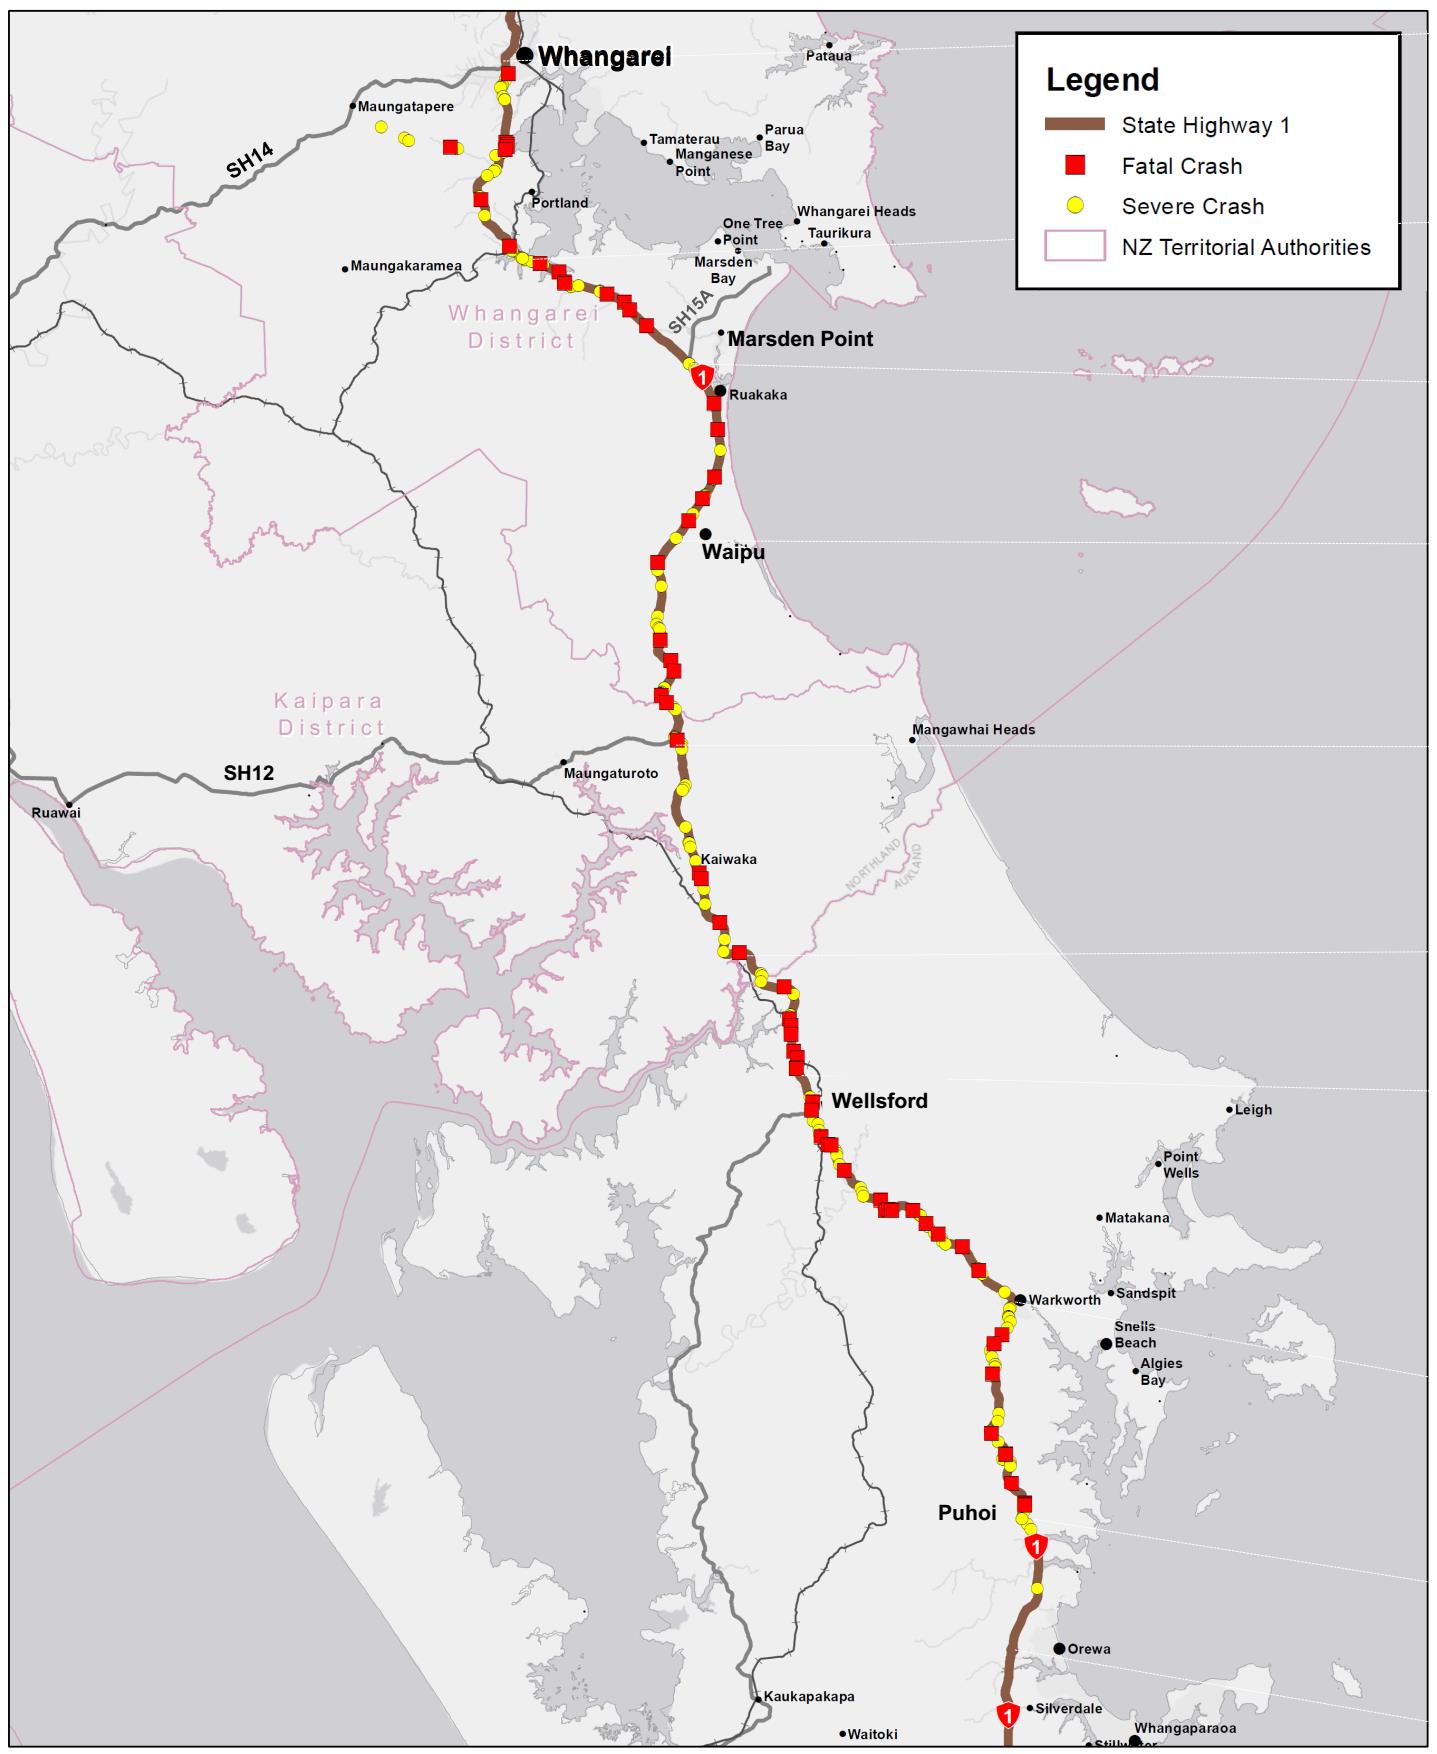
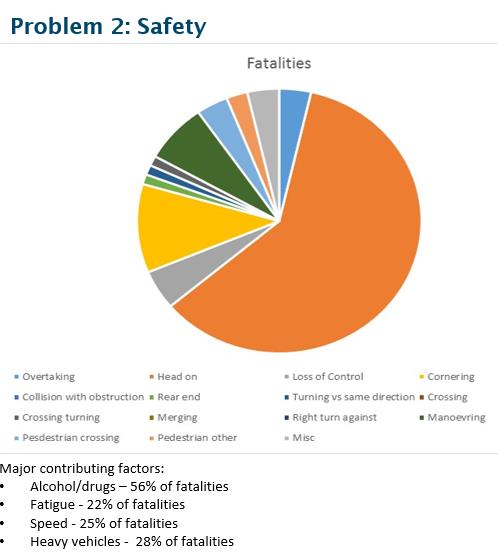
Figure 12 includes a summary of the fatal and serious crashes through the corridor over the past 10
years. Of these crashes, more than 50% were head-on incidents. Analysis of the major contributing
factors indicates that alcohol and drugs were a significant factor related to over 50% of these crashes,
with speed (25%), fatigue (22%) and heavy vehicles (28%) also important contributors.2
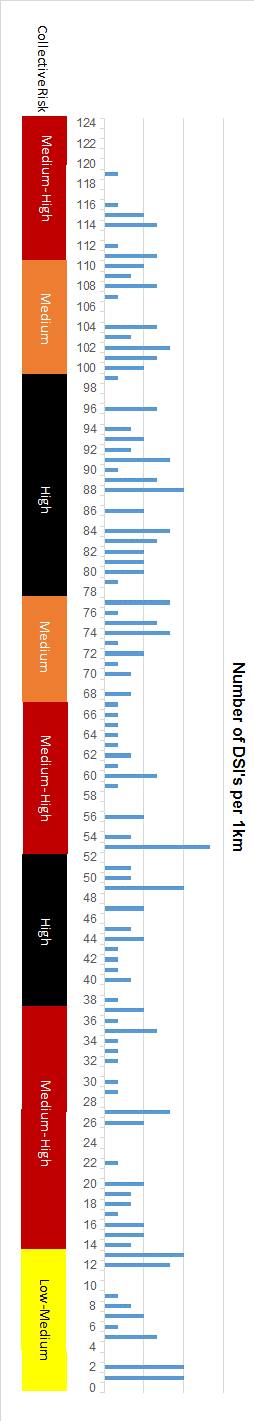
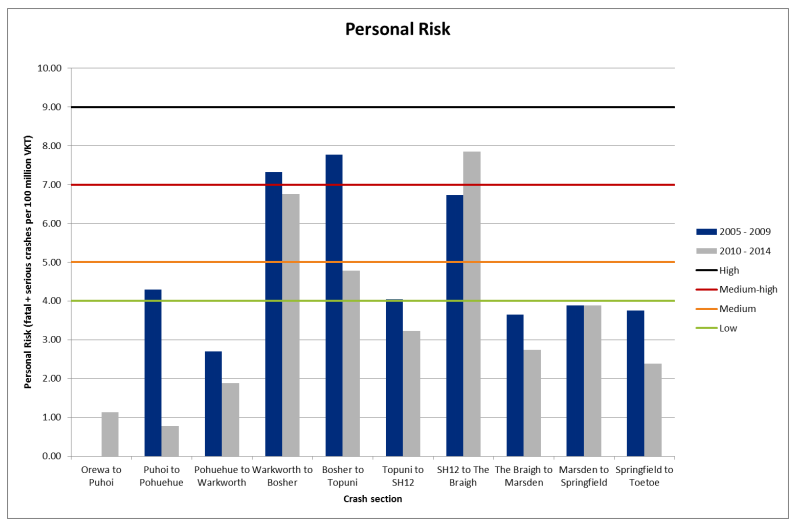
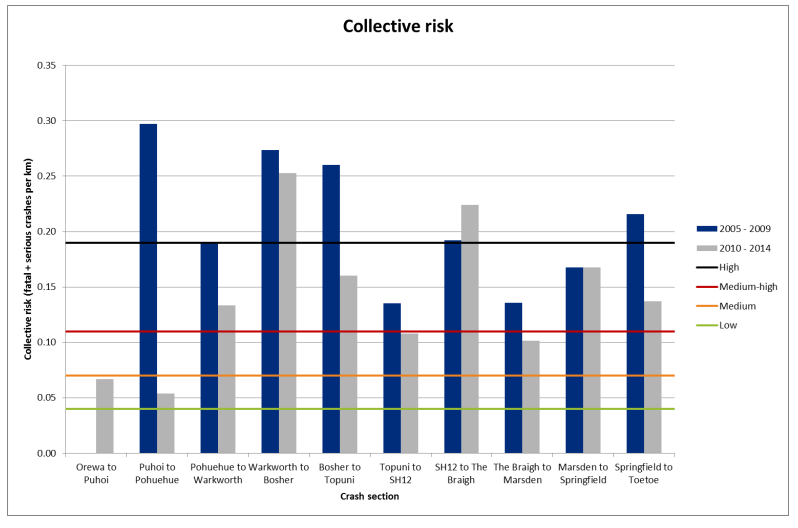
The PBC corridor crash record has also been compared with other areas of the network using the
KiwiRAP Collective and Personal Risk methodologies, as shown on the side of
Figure 12 and in
Figure
13. This identifies high-risk areas, specifically Puhoi to Wellsford and Oakleigh to Whangarei have
medium-high personal risk ratings. The recent 2015 and 2016 data (fatalities) is likely to increase
the risk rating further between the Brynderwyn Hills and Whangarei.
2 It should be noted that accidents can have more than one contributing factor.
NZ TRANSPORT AGENCY
August 2017
33
Whangarei to Auckland – Connecting Northland
Figure 12 : Fatal and Serious Accidents 2005-2015
NZ TRANSPORT AGENCY
August 2017
34
Whangarei to Auckland – Connecting Northland
Figure 13: KiwiRAP personal and collective Risk for SH1
As outlined in Appendix F, this section of SH1 carries the highest classification in the ONRC system
NZ TRANSPORT AGENCY
August 2017
35
Whangarei to Auckland – Connecting Northland
as a “National” road, with part of the route (south of Wellsford) also being “High Volume National”.
From a safety perspective this requires the following standard:
• High Volume National: Mostly forgiving roads and roadsides, equivalent to KiwiRAP 4-Star
standard. User hazards absent or mitigated, including head on risk. Active road users
generally do not have access - if present, they are provided with separate space or are
physically separated. The road form provides road user guidance
• National: A high KiwiRAP 3 or 4-star standard, or equivalent, with consistent and predictable
alignment. User hazards mostly mitigated. Active road users (if present) are mostly provided
with separate space or are physically separated. Some lower standards and/or winding
sections may require lower speeds and extra care. High level of road user safety guidance
provided.
The current route is predominantly 2 or 3 star standard. This does not meet the standard sought for
a National route (and certainly not a high volume route).
Safety also has a significant impact on the resilience of the route (due to closures because of
incidents) and it is noted that the ONRC also seeks the following resilience standard for a National
route:
• Resilience Level of Service - Route is always available during major weather or emergency
events and viable alternatives exist. Rapid clearance of incidents affecting road users. Road
users are generally advised in advance of issues and incidents
The evidence assessed to date confirms the problem identified in the Strategic Case.
4.5.2
Implications of the Evidence
In accordance with the ONRC, this National state highway should have at least a 3-4 star KiwiRAP
rating. Currently the corridor has no 4-star rated sections and 36% of its length is rated 2-star.
The evidence shows that the current SH1 safety record is poor and is not commensurate with its
ONRC. The evidence shows that the worst sections of risk exposure are at Dome Valley, the
Brynderwyn Hills and between SH15 and Whangarei, which all have medium-high risk ratings.
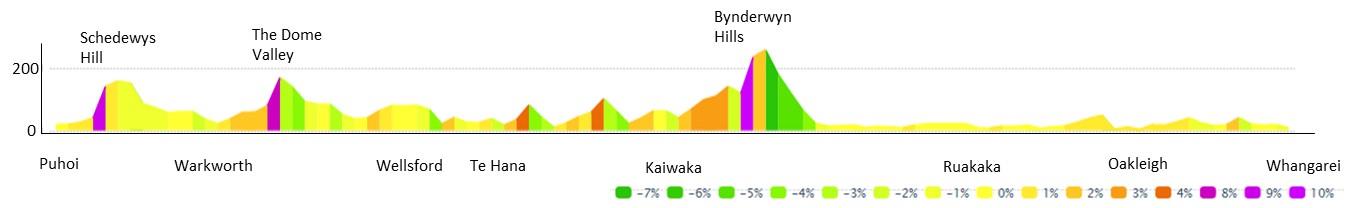
The Whangarei to Puhoi corridor is defined by a number of geometric constraints resulting in areas of
tight horizontal and steep vertical alignment. This is particularly evident in many of the crash black
spots on the corridor including Schedewys Hill, the Dome Valley and the Brynderwyn hills. The crash
history reflects this with high proportions of head on, cornering and loss of control crashes of high
severity. Cornering crashes are particularly prevalent in minor and non-injury crashes, and are the
highest proportion of crash incidents overall. The lack of central median barrier on the route is
considered to contribute to the high number of head-on crashes, many of which result in serious
injuries or fatalities. This results in an unacceptable level of death and serious injuries.
Figure 14: Vertical profile of the Auckland to Whangarei corridor
Further analysis suggests the corridor is also over represented in crashes with driver fatigue listed as
a contributing factor. Crashes involving heavy vehicles are also over represented compared with
national levels and are especially high when considering crashes involving serious and fatal injuries.
NZ TRANSPORT AGENCY
August 2017
36
Whangarei to Auckland – Connecting Northland
Given this evidence, the following problem has been identified:
“The corridor is substandard for a national strategic route, resulting in a higher number of
crashes involving injury and death”.
A 30% weighting was identified for this problem as this is a significant issue for the corridor and
addressing this problem would significantly improve the corridor’s performance.
4.6
PROBLEM 3: REDUCED ECONOMIC INVESTMENT IN NORTHLAND
“The lack of a long term, integrated investment approach creates suboptimal outcomes in
transport and reduced economic investment in Northland”
4.6.1
The Evidence
In 2013, Finance Minister Bill English and Economic Development Minister Steven Joyce released
the
Regional Government Expenditure Report jointly commissioned by Treasury and MBIE and
undertaken by NZIER. The report shows that Northland spends above the national average on
operating costs for the transport network and one third less than the national average on capital
investment. This leads to an increasing OPEX burden, as there is relatively little investment in new
infrastructure, putting even more emphasis on the need to maintain existing infrastructure.
Issues raised during consultation on the draft Regional Land Transport Plan (RLTP) and through the
development of the Network Operating Framework include:
• There is no route protection for future State Highway improvements in urban Whangarei
• Northport has highlighted the lack of an investment commitment as a reason that investors
have walked away
• Intersection improvements (developer and safety led) are being constructed without a longer
term plan to be consistent with
• Land use developments that are likely to be within the footprint of future road improvements
are currently being consented
• Safety improvements are being developed without regard to the overall efficiency of the
corridor
• Significant development is occurring in Waipu without any strategy for how this traffic will
access the state highway efficiently
Customer insights from Northland Inc outline that a clear, confirmed and committed investment
strategy for SH1 would significantly assist the case for upgrading Northport. It is important to note
that transport is one of many factors considered to contribute to unlocking the development potential
along the corridor. Consideration must be given to other infrastructure provision. Clarity on the
corridor transport plan will provide certainty to allow land use planning for townships located on the
State Highway, such as Kaiwaka and Wellsford, to be confirmed. Presently, planning cannot be
effectively implemented because of the lack of investor confidence, with transport accessibility an
important factor in these decisions, based on customer insights and stakeholder engagement.
There is also an opportunity to future proof the corridor in urban areas so that the emerging land
form does not compromise the efficiency of the state highway. The recent Puhoi to Warkworth clarity
commitment has helped land use planning in Warkworth to confidently identify appropriate locations
for growth and necessary complementary infrastructure, some of which is already being realised.
NZ TRANSPORT AGENCY
August 2017
37
Whangarei to Auckland – Connecting Northland
4.6.2
Implications of the Evidence
Without the clarity of a long term investment plan for SH1, there is the risk that the current
investment in the corridor will not be as effective as it could be. A corridor plan wasd last developed
by the Transport Agency in 2010. Since then, the Puhoi to Warkworth section of the RoNS project has
progressed through to a PPP for construction in 2021/2022.
There is considerable investment being made (or planned to be spent) in the corridor on safety
improvements, such as the Loop Road intersection upgrade. It is prudent to ensure that this
investment, where possible is consistent with the long term strategy for the corridor. In some
locations, interventions such as median barriers may be installed and then replaced or removed in the
near future to accommodate longer-term solutions for the corridor, which could include four-laning.
As outlined in the context section, the Tai Tokerau Northland Economic Action Plan has identified
that the lack of robust transport accessibility between Northland and the rest of the country as a
contributing factor to the area’s poor economic situation and transport is one of the required ‘game
changers’ to underpin business growth.
Given this evidence, the following problem has been identified:
“The lack of a long term, integrated investment approach creates suboptimal outcomes in
transport and reduced economic investment in Northland”.
A 20% weighting was identified for this problem as although the development of this PBC will assist in
addressing this problem, it is seen by stakeholders in particular as of high importance for the
corridor, and is likely to reinforce a communication approach for the completed PBC.
4.7
INVESTMENT OBJECTIVES
A workshop was held with stakeholders on 19 February 2016 to confirm the identified problems and
benefits. The workshop was also used to develop investment objectives for the PBC.
SMART investment objectives were developed with reference to the key benefits sought. Investment
objectives must provide enough information to enable an investor to make a sound investment
decision. Four investment objectives were identified as outlined below.
4.7.1
Investment Objective 1: Resilience
Problem 1 identified that the unreliable and costly nature of the corridor was affecting economic
growth. Safety is a part of the problem and therefore Benefits 1 and 2 are directly applicable to this
problem. Benefit 3 is the opportunity to increase economic growth (because of more reliable and
available transport accessibility). Linking this problem and benefits, the following investment
objective was developed:
“We will steadily reduce the number of unplanned incidents so that SH1 between Puhoi and
Whangarei has no full closures without viable alternatives for all vehicles of less than 2 hours
by 2030”
Important considerations for this investment objective were:
• Full closures cause the most significant delays for users and are the most measurable, as the
Transport Agency specifically collects this data. Partial closures often occur in an ad hoc
manner and are not always reported.
• A 2-hour closure limit was selected, as this allows a optimistic but achieveable response time
for operators of the network to address an incident.
NZ TRANSPORT AGENCY
August 2017
38
Whangarei to Auckland – Connecting Northland
• The year 2030 was selected as it allows time to complete the likely interventions.
4.7.2
Investment Objective 2: Safety
There is a real safety problem in the corridor and an opportunity to enhance the lives of users when
this is addressed. Linking Problem 2 and Benefit 1, the following investment objective was identified:
“We will improve safety along the corridor between Whangarei and Puhoi by steadily reducing
the number of deaths and serious injuries to at least a medium personal and collective risk (as
defined by KiwiRAP) by 2030”
Important considerations for this investment objective were:
• The KiwiRAP criteria provides a nationally benchmarked standard. A medium risk level is
equivalent to an average rating.
• Using both personal and collective risk criteria addresses the crash history as well as exposure
rate.
• The year 2030 was selected as it allows time to complete the likely interventions
4.7.3
Investment Objective 3: Northland Economic Development
Problems 1 and 3 are related to the need for economic growth in Northland and this is a key focus for
many government agencies. This is the outcome of Benefit 3 and an outcome associated with Benefit
4. The role of freight and tourism in the economic recovery of Northland is substantial. Linking
these problems and benefits, the following investment objective was identified:
“We will facilitate regional growth and access to key markets through decreasing the cost of
travel for freight and tourism between Puhoi and Whangarei by 15% by 2030.”
Important considerations for this investment objective were:
• There was extensive discussion with stakeholders regarding the wording of this investment
objective and the use of trip reliability or speed as a proxy for economic growth. Trip travel
time, was considered, however as the overall intent for economic growth is to reduce the cost
of travel, average speed rather than an arbitrary travel time was considered more appropriate.
• A vehicle speed / travel time measure was selected as this is the significant factor (and most
easily measurable) in cost of travel.
• The corridor between Whangarei and Puhoi is currently observed to operate at an average
speed of 76km/h.
• If this was improved to be consistent with other National routes, an average speed of 90km/h
is considered an appropriate target. This represents a 15-minute travel time saving, which
would be a noticeable improvement or roughly equivalent to a 15% reduction in Cost of travel.
It would increase accessibility to Auckland and reduce the cost of travel on the route for
freight in particular.
• The year 2030 was selected as it is within the timeframe of the MBIE Tai Tokerau Northland
Economic Action Plan and some projects required to address this objective could be of a large
scale and require longer lead times.
4.7.4
Summary
PBC investment objectives have been developed based on the problems and benefits identified
through engagement with stakeholders and project partners. Three investments have been identified
NZ TRANSPORT AGENCY
August 2017
39
Whangarei to Auckland – Connecting Northland
as follows:
• Investment Objective 1 : “We will steadily reduce the number of unplanned incidents so that
SH1 between Puhoi and Whangarei has no full closures without viable alternatives for all
vehicles of less than 2 hours by 2030”
• Investment Objective 2 : “We will improve safety along the corridor between Puhoi and
Whangarei by steadily reducing the number of deaths and serious injuries to at least a
medium personal and collective risk (as defined by KiwiRAP) by 2030”
• Investment Objective 3 : “We will facilitate regional growth and access to key markets
through decreasing the cost of travel for freight and tourism between Puhoi and Whangarei by
15% by 2030”
4.8
THE KEY PERFORMANCE ATTRIBUTES AND MEASURES
It is important that the potential benefits of successfully investing are able to be assessed and
measured in order to demonstrate ongoing delivery against investment criteria.
Across the different benefits highlighted above a number of KPIs have been identified during the ILM
process, as set out below. These KPIs are consistent with the Investment Performance Measurement:
Outcome Classes.
Table 2: Key performance measures
Investment
Investment KPI
Measure
Baseline
Target
objective
Number of full
Reduction in
closures per
27 per year
0 by 2030
incidents
year
Investment
objective 1:
Reduction in
Closure of
Resilience
incidents
more than 2
18 per year
0 by 2030
without viable hours with no
alternative
viable
alternative
Reduction in
No. of deaths
deaths and
144 DSI in 5
58 DSI in 5
and serious
serious
year period
years
injuries
Investment
injuries
objective 2:
Safety
Medium
KiwiRAP risk
66% personal
All section
personal and
rating on each
11% collective
achieve by
collective risk
section
achieve target
2025
rating
Average travel
Reduced cost
90km/h by
speed on
76km/h
of travel
2030
corridor
Investment
objective 3:
$35k in 2015
Cost of travel
National
Northland
(74% of
GDP per capita
average by
regional GDP
national
2030
average)
NZ TRANSPORT AGENCY
August 2017
40
link to page 41
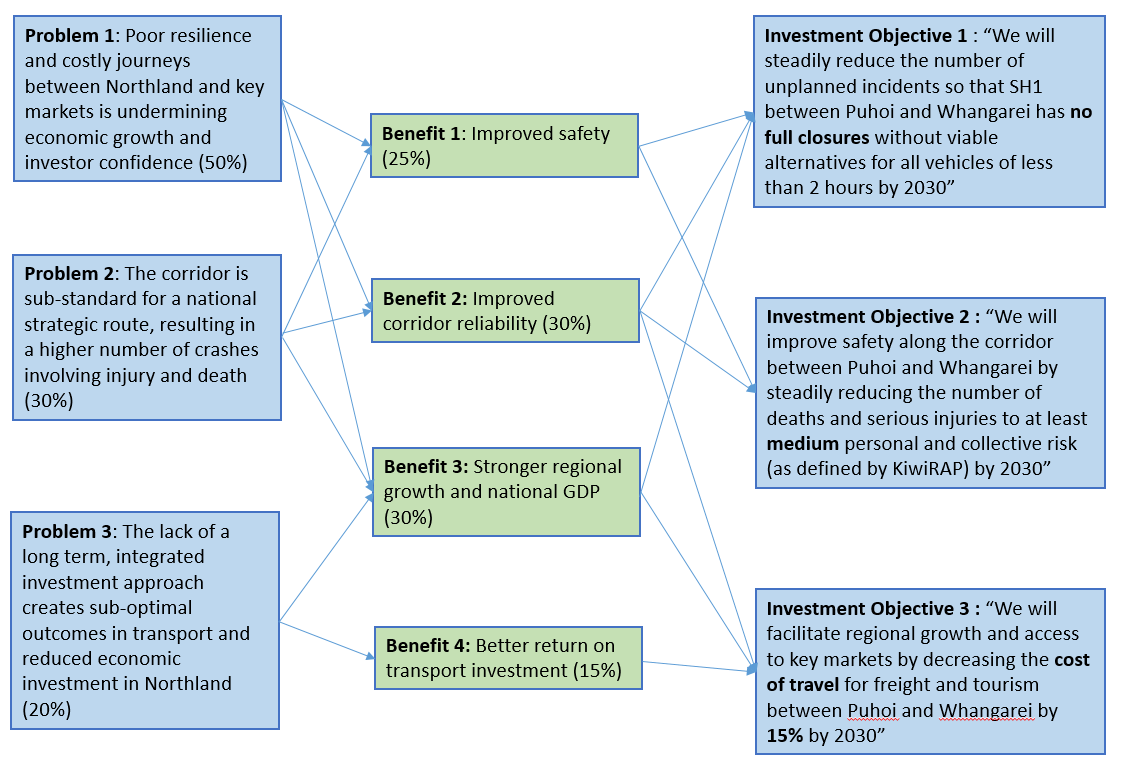
Whangarei to Auckland – Connecting Northland
Figure 15 shows how these investment objectives inter-relate to the problems and benefits identified.
Figure 15 : Investment Objective Development
The vision for the Auckland to Whangarei State Highway corridor is a safe corridor which provides
reliable journey times to support the economic growth of the region and access to key markets. The
long term goal is a divided carriageway on a good alignment between Auckland and Whangarei.
Progress towards this will be prioritised based on need and return on investment.
The investment objectives identified for the PBC are consistent with the long term vision for the
corridor.
NZ TRANSPORT AGENCY
August 2017
41
Whangarei to Auckland – Connecting Northland
PART B – DEVELOPING THE
PROGRAMME
NZ TRANSPORT AGENCY
August 2017
42
link to page 43
Whangarei to Auckland – Connecting Northland
5.
ALTERNATIVES AND OPTIONS
5.1
ALTERNATIVE AND OPTION GENERATION
Options and alternatives have been developed and subsequently combine to create programmes of
work. This section presents an overview of the methodology adopted with respect to the generation
of a long list and summarises the options and alternatives considered.
Options and alternatives were developed to address the problem statements and deliver the agreed
investment objectives as agreed with stakeholders. The agreed problem statements and investment
objectives for the corridor are set out in Part A - Strategic Case.
The methodology adopted for this process was:
• Initial development of options by project team
• Workshops with Transport Agency technical specialists to further develop and identify new
options
• Workshop with stakeholders on 17th March 2016 to further develop and identify new options
• Preparation of assessment criteria by project team, based on Transport Agency guidelines
• Presentation and endorsement of assessment criteria at workshop on 17th March 2016
• Assessment of options and ranking by project team
• Endorsement of option assessment by wider team
Assessment criteria were taken from NZ Transport Agency guidelines for option evaluation, agreed
with stakeholders and used to evaluate the identified options and alternatives with respect to their
relative ability to deliver against the agreed investment objectives for the corridor.
This allowed the options to be ranked, with the ranking informing the compilation of programmes.
The assessment criteria agreed for this project and endorsed by the stakeholders is shown
in Table 3.
The assessment criteria have been grouped according to a number of headline categories, relating to
investment objectives, ability to be implemented and an assessment of effects and opportunities.
The ability for an option to be implemented was further broken down into feasibility, affordability and
public / stakeholder support. The assessment of effects and opportunities was broken down into
cultural heritage, environmental, social and community wellbeing, economy and safety
considerations.
At the option long list stage, options have been considered against these headline categories, while
the more detailed considerations will be used to evaluate the performance of programmes, once
these are developed.
Table 3: Assessment Criteria
Objectives
Considerations
Measures
Investment objectives
We will steadily reduce the number of
Investment
Reduced volume, duration
unplanned incidents so that SH1 between
Objective 1
and impact of SH1 closures
Puhoi and Whangarei has no full closures
NZ TRANSPORT AGENCY
August 2017
43
Whangarei to Auckland – Connecting Northland
Objectives
Considerations
Measures
without viable alternatives for all vehicles of
less than 2 hours by 2030
We will improve safety along the corridor
between Puhoi and Whangarei by steadily
Investment
reducing the number of deaths and serious
Reduced deaths and serious
Objective 2
injuries to at least a medium personal and
injuries on the corridor
collective risk (as defined by KiwiRAP) by
2030
We will facilitate regional growth and access
Investment
to key markets through increasing freight
Average travel speed over
Objective 3
and tourism average travel speeds to 90
the corridor
km/h by 2030
Ability to be Implemented
Level of complexity. I.e.
How straightforward is it to implement this
tunnelling, community
alternative / option?
consultation, challenging
ground conditions etc.
Are innovative technologies involved?
Level of innovation
Are there significant hazards that may pose a Level of hazards
health, safety in design risk?
Feasibility
Impact of project on
Are there likely property risks?
property
Other organisations beside
Are other infrastructure providers affected?
NZTA
Are there consenting risks that could affect
Level of consenting risk for
delivery or cost risk?
option
Are there factors likely to affect the ability to
Maintenance and operation
operate / maintain the option over its
costs
projected life without major additional costs?
What are the funding risks of the
Included in the RLTP to no
alternative/option?
funding allocation
Can the alternative be funded traditionally?
Estimated economic
(economic efficiency)
efficiency of project
Affordability
Are alternative funding mechanisms
yes / no
required?
Are there cashflow risks that might affect the yes / no
delivery programme?
Are there ongoing operating cost risks?
Level of operating costs
NZ TRANSPORT AGENCY
August 2017
44
Whangarei to Auckland – Connecting Northland
Objectives
Considerations
Measures
Are operating subsidies required? How will
Tolling / PQP procurement
these be funded?
Has the alternative been made public?
Yes / no
Level of anticipated
Public /
How acceptable is the alternative?
acceptance
Stakeholders
Are there real or anticipated objections from
Level of anticipated
the community or stakeholders?
acceptance by stakeholders
Assessment of Effects
Are there any sites or features (including
their setting) of significance to Maori
(archaeological or existent) affected?
Are there any historic heritage places
(including their setting) (e.g. archaeological
or buildings, sites, remnants) affected?
Are any (first tier) outstanding landscapes or
natural features, or (second tier)
Environmental mapping
significant/special landscape or natural
features affected?
Are there any ecological areas, or areas with
habitat value (inc large areas of native
vegetation) affected?
Are there any coastal marine areas, wetlands,
lakes, rivers, streams or their margins
Environmental mapping
Cultural heritage, affected?
environmental,
social and
Are there any areas of contaminated land
community
affected?
wellbeing
Are there community facilities (park/schools/
hospitals etc.), or residential or other
Assessment of proximity to
sensitive land uses in the area that could be
settlements
affected by adjacency effects (e.g. noise,
disruption, vibration, air quality etc.)?
Are there potential effects from hazards or
risks (including from future climate change)
from erosion, flooding, fault lines, sea level
rise
Extent to which the option integrates
Extent of integration with
transport and land use to make best use of
land use aspirations
existing networks and infrastructure.
Are there any communities affected by
Qualitative assessment of
reduced cohesion, connectivity or
access to the road network
accessibility?
NZ TRANSPORT AGENCY
August 2017
45
Whangarei to Auckland – Connecting Northland
Objectives
Considerations
Measures
Are there opportunities to enhance the active
travel modes - cycling and walking and/or
Qualitative assessment of
linkages to other national or regional
access to alternative modes
recreational cycle networks for longer
distance cyclists?
Extent and significance of land take,
severance; negative and positive
Severance / connectivity
opportunities
How will the alternative/option affect traffic
Level of growth catered for
volumes?
Does the option provide an opportunity to
reduce vehicular travel time on SH1 between
Qualitative evaluation
the Auckland and Northland regions?
Does the option improve journey time
Qualitative evaluation
reliability?
Qualitative assessment of
Are there gainers and losers (modes /
overall benefits to
regions)? What is the overall effect?
surrounding communities
Does the option provide for more efficient
freight supply chains between the Auckland
Route quality
Economy
and Northland regions
How well does the option integrate with land
Consistency with regional
use with reference to regional growth
growth strategies
strategies
How well does the option enhance the
Qualitative assessment of
development potential of adjacent land /
access to land use
attract new jobs / help existing businesses?
How well does the option preserve the
function of SH1 as a National High Volume
Qualitative evaluation
route, consistent with ONRC
How well does the option address route
Extent to which the option
security, resilience and flexibility
improves route resilience
How will the alternative enhance safety for
Alternative mode safety
different types of transport users?
Will it involve gainers and losers in terms of
Adverse safety effects from
safety?
the option.
Safety
Are there impacts on personal safety /
Assessment of the
security?
reduction in crash risk
Assessment of reduction in
What is the impact on fatal / serious injuries? DSI
NZ TRANSPORT AGENCY
August 2017
46
Whangarei to Auckland – Connecting Northland
5.2
OPTION LONG LIST
A list of more than 115 options was developed with reference to the Agency’s intervention hierarchy,
in order to optimise investment in the corridor.
Firstly, a range of options that aimed to better integrate land use and transport were identified, such
as safer access to rest areas, bypassing settlements and rationalising property accesses onto the
State Highway.
Options that delivered a more resilient outcome were identified next. These options are intended to
reduce or remove the closure of the existing state highway and improve the alternative routes
available to customers.
A further suite of options focussed on making the best use of the existing network was identified as
well as operational solutions. These options include a review of road marking and advisory signage
to ensure consistency across the corridor. Side barriers, shoulder widening, speed restrictions and
police enforcement to manage travel speeds were also considered. Social programmes focussed on
the current safety issues related to alcohol and driving standards were identified.
A wide range of new infrastructure solutions were also identified, from very large offline schemes, to
smaller corner realignments and intersection improvements. These were evaluated based on the level
of service requirements for the corridor as well as affordability and realistic need.
The Auckland to Whangarei transport corridor is multi-modal and therefore options for the
enhancement of other modes to address the investment objectives were also considered. This
included options that increased the capacity of the rail network, including significant strengthening
and tunnel widening works, increasing the role of costal shipping, park and ride options and active
mode options.
The full list of options is included in Appendix G as well as further detail on how the assessment
criteria was applied to the assessment of each option.
5.3
ALTERNATIVE AND OPTION ASSESSMENT
An initial assessment was undertaken for each ‘head’ criteria. A seven point assessment system was
used, ranging from +++ for a strongly positive performance to --- for a strongly negative performance
in comparison with the do minimum. This is a coarse system, given the broad nature of the
assessment, however is considered appropriate at this long list stage. Appendix G outlines this
process in more detail and the assessment of individual options.
The application of the assessment criteria to the options identified the following key outcomes:
• The cycling and walking options were assessed to not have a noticeably positive effect on any
of the investment objectives
• The best performing option was safety improvements in the Dome Valley
• There were a number of highly ranked options which including operational interventions such
as improved wayfinding signage on detour routes and improved police enforcement
• Highly ranked larger capital schemes included a bypass of the Brynderwyn Hills and a 2+2
configuration between SH15 and Whangarei
• Upgrade of diversion routes scored well providing resilience benefits and benefits to local
communities
• The worst performing options were the freight lanes in Auckland and passenger rail between
Marsden Point and Auckland
NZ TRANSPORT AGENCY
August 2017
47
Whangarei to Auckland – Connecting Northland
Overall, the conclusion of this long list assessment is that there is a wide range of options and ways
to meet the project objectives from cheaper operational options, through to large-scale capital-
intensive interventions.
5.3.1
Option Analysis
In order to analyse options in more detail, the corridor was divided into sections and a number of
potential options for each section identified. Many operational interventions were applied across a
number of sections, with physical options varying between sections. For example, a range of
improvements such as a divided carriageway 1+1 arrangement, 2+1 divided carriageway, 2+2 divided
carraigeway, offline and online were identified for the section between Toetoe Road and Oakleigh.
None of these options were discarded, but some options were considered to respond better to
specific issues than others. For example, an offline alignment provides travel-time savings while a
divided 1+1 online alignment with wire rope responds to the high number of head-on collisions on
this section. Option analysis considerations are summarised by section below:
• Operational interventions – A suite of non infrastructure projects were considered for the
corridor, making best use of the existing infrastructure. Interventions included a strong focus
on education and licensing, enforcement of speed, alcohol and heavy vehicle loads. Land use
rules and regulations were considered including zoning and access restrictions. Operational
options included measures to improve response times to incidents, reduce maintenance
delays, improve detour operations and monitoring of the corridor. A suite of improvements
were identified for tourists including improved road markings, signage and more frequent rest
stops. Out of the box options such as freight lanes from Puhoi north and subsidised hotel
rooms were also considered.
• Alternative modes – A number of options to increase the role of other modes were
considered, including increased coastal shipping capacity, increased rail operation and
walking and cycling schemes. The walking and cycling schemes were assessed as having
good benefits, particularly with respect to tourism, albeit with limited impact on the safety
and resilience problems identified in the corridor. Rail options provided opportunity to
increase the rail mode share, particularly for freight trips. This was assessed positively,
however delivered comparatively small outcomes for safety, resilience and economic growth
with very significant implementation costs. Coastal shipping enhancements were assessed
similarly to rail, with operational challenges more the issue rather than costs, with good
outcomes predicted if implemented (like rail). Cycle provision has been considered over the
length of the corridor providing access to the existing network and making best use of
existing infrastructure.
• SH14 to Toetoe Road (urban Whangarei) – This predominantly urban section included a
number of options focussed predominantly on additional capacity to meet expected increases
in traffic demand and to tie into currently planned four-lane works between SH14 and the I-
site in Otaika. Safety, increased reliability and provision for other modes, particularly walking
and cycling, were also considered given the urban nature of this section. The options that
best addressed capacity, safety and resilience were 2+2 alignments. Both online and offline
options were considered. Both online and offline present significant challenges due to the
built up nature of this section of the corridor and the close proximity of shops and dwellings.
• Toetoe Road to Oakleigh – This section has a high collective risk rating, including a number
of recent head-on fatalities. Traffic demand forecasts indicate that additional capacity will be
required within 10 years. A range of interventions were considered from very site-specific
safety improvements, to comprehensive offline solutions. A major assessment consideration
was the comparison between an online upgrade of this section with an offline alignment near
NZ TRANSPORT AGENCY
August 2017
48
Whangarei to Auckland – Connecting Northland
the Portland cement works. The offline option performs better from a safety perspective and
provides travel time savings, whilst the online solution likely requires less property. Different
options for this section were included in different programmes to allow different levels of
intervention to be assessed, with the offline solution assessed to deliver the greatest
outcomes in this section, albeit for a higher cost.
• Oakleigh to Port (SH15) – An IBC completed for this section concludes that an upgrade is
required immediately to address the safety problem and additional capacity will be required
by approximately 2025. Options for additional capacity beyond 2025 were assessed,
including offline and online options in the form of either 2+1 or 2+2. The IBC recommended
online upgrades as the online alignment is adequate and offline options would be more
expensive with minimal additional benefit. The form of the solution was also assessed, with
2+2 considered the best long term solution as a 2+1 solution does not provide the long term
capacity required and would only be ‘useful’ for a relatively short period of time before 2+2
was required. The level of disruption to implement two upgrades was not valued highly and
the incremental benefits of this would be poor. The recent increased levels of growth at
Ruakaka and Marsden Point were also factored into this assessment, as recent growth has
been considerably higher than previous years.
• Port (SH15) to Brynderwyn Hills – A number of longer-term options were assessed in this
area, including online and offline solutions in the form of 2+1 and 2+2 arrangements. The
flat terrain and good existing alignment meant an offline alignment in this area is expensive
and likely to provide little additional benefit. The capacity forecasts and current operation of
this section also means that 2+1 solutions are adequate to meet forecast demands and
therefore meet the needs of the corridor for the next 30 years. 2+2 options provided further
additional capacity, but little additional benefit with respect to travel time or safety.
• Brynderwyn Hills to SH12 – A wide range of options were assessed in this area to address
the safety, resilience and travel time (speed) problems. This included consideration of online
upgrades (to complement the online realignment currently under construction on the northern
side of the hills), bypasses to the west and east of the current alignment and tunnelling
through the Brynderwyn Hills. Western bypasses were considered to better address the
identified problems as the eastern bypass terrain is poorer than the current alignment and
online options would be very challenging to build and deliver against the investment
objectives for the project. The tunnel option performed well, although was significantly more
expensive. Three western bypass options were assessed, from a relatively short section to a
larger and more significant realignment. The bigger the bypass, the flatter the resultant
grades, but longer the total journey. The middle western bypass option was assessed as
striking the best balance. A number of western bypass options were included in different
programmes to allow the different level of outcomes to be considered at the programme level.
• SH12 to Te Hana – A number of options were considered in this section, from online minor
upgrades through to offline 2+2 options. The ‘bigger’ options delivered greater outcomes,
however, in this section the gap between these ‘bigger’ options and smaller ones was not as
significant as in other areas of the corridor as the future demand is forecast to be low and
level of problems were not to the same scale. Detour upgrades were also considered through
this section.
• Te Hana to Warkworth –The Warkworth to Wellsford RoNS is assumed part of the do
minimum for this PBC and one of the key considerations for this section was to confirm a
termination point, including the extension of the RoNS to beyond Te Hana or Kaiwaka. The
key consideration in this regard was the inclusion of options to address the problems of
resilience and travel time through Te Hana. There are a number of constraints from a social,
cultural and environmental perspective in Te Hana and the extension of the RoNS project was
assessed as providing the strongest investment outcomes for the least impact. Options in this
section are likely to be longer-term solutions and therefore options for shorter-term
NZ TRANSPORT AGENCY
August 2017
49
Whangarei to Auckland – Connecting Northland
implementation were also developed and assessed as performing well, particularly safety
focussed options through the Dome Valley, which currently has a high-risk rating. The
Kaiwaka township is also located on this section and consideration was given to safety and
amenity improvements.
• Puhoi to Warkworth – With the RoNS well advanced, this section focussed on more
operational options to maximise the opportunity the RoNS provides, included Park and Ride at
Warkworth and localised safety enhancements to the existing road network.
5.3.2
Options which do not address the investment objectives
At the long list stage of the assessment some options were discarded, as they did not fundamentally
address the investment objectives.
A number of walking and cycling schemes were identified along the corridor. In isolation, they were
not considered to meeting the investment objectives of increasing the average corridor speed to 90
km/h, reducing deaths and serious injuries or reducing full closures of more than two hours along
the corridor. However, many of these options represent opportunities to enhance the journey
experience of the corridor at little cost. They could therefore be considered further with respect to
the recommended programme.
Passenger rail was also discarded at this stage as it requires substantial investment to implement
(estimated at over $1B) and, as it is likely to attract only a small proportion of general traffic from the
corridor, has limited impact on the investment objectives.
Some of the more extreme options were also discarded at this stage, such as a proposed southern
hemisphere space port for Virgin Galactic near Waipu.
Overall, very few options were discarded as being fatally flawed. However, as will be discussed in
subsequent sections, not all remaining options were included in a programme in the next stage.
NZ TRANSPORT AGENCY
August 2017
50
link to page 51
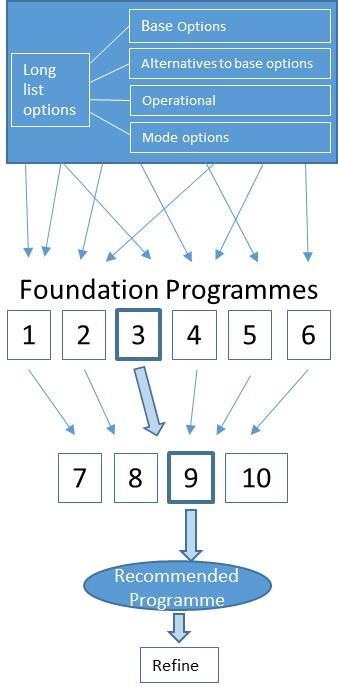
Whangarei to Auckland – Connecting Northland
6.
PROGRAMME OPTIONS DEVELOPMENT AND
ASSESSMENT
6.1
PROGRAMME DEVELOPMENT
6.1.1
Initial Programme Development
The SH1 Auckland to Whangarei PBC is a programme of works to address the corridor problems and
deliver on the investment objectives. The ultimate programme will almost certainly be a package
comprising a number of options.
This section summarises how the development of proposed programmes has been undertaken in a
robust and transparent manner. The Transport Agency’s Alternatives and Preferred Programme
templates have been used to describe each programme. These templates and a detailed description
of how programmes were developed is provided in Appendix H.
The assessment of long list options against the above criteria and relative scoring between options
was a key consideration when developing each programme.
Initially, six ‘foundation programmes’ were developed to address individual investment objectives
(programmes 1-3) with three additional programmes developed addressing the key risks and
uncertainties on the corridor; investment in response to high growth, significant investment in
alternative modes and a low level of investment focusing on low impact and operational measures.
An outline to the process adopted is provided
in Figure 16.
Figure 16 : Programme development process
NZ TRANSPORT AGENCY
August 2017
51
Whangarei to Auckland – Connecting Northland
The foundation programmes were developed by examining sections of the route and reviewing the
options assessment to identify the best performing options for the assessment criteria related to
each foundation programme. An example is Programme 1 where the best performing resilience
options along the corridor were identified and compiled.
Fundamental to each programme was a suite of operational and non-infrstructure projects. A number
of projects scored high in the option assessment and could be implemented with each of the
programmes improving the use of existing infrastructure on the corridor in the short term.
These ‘foundation programmes’ were
• Foundation Programme 1 - Resilience: This programme addresses critical resilience issues on
the corridor and specifically aims to reduce full closures of more than 2 hours with no viable
alternative route. It extends the RoNS to north of Te Hana and includes a bypass of the
Brynderwyn Hills, as these are two high resilience risk locations. It provides a 2+2 alignment
between Whangarei and SH15 (as contra-flow can be facilitated more easily on a separated
carriageway). It also improves detour routes to be HPMV capable, provides a Park and Ride
facility at Warkworth (as an alternative to car travel) and improves VMS to provide early
warning of closures and viable detour options.
• Foundation Programme 2 – Low Cost Safety: This programme addresses critical safety issues,
predominantly using the existing route. It deliberately chooses interventions that are online,
and require minimal road widening, therefore typically at a lower cost than larger intervention,
including shoulder widening, corner realignments, access rationalisation, wire rope barriers,
online improvements to the southern side of the Brynderwyn Hills, rest areas and travel time
signage to combat fatigue. It also recommends increased police enforcement and driver
education campaigns targeted at fatigue and speed.
• Foundation Programme 3 – Economic Efficiency: This programme aims to achieve an average
speed of 90 km/h for all vehicles travelling between Auckland and Whangarei. This is used to
measure the decrease in cost of travel as a proxy for enabling economic growth in Northland.
This programme recommends extending the four lane upgrade from Wellsford to north of
Kaiwaka, bypassing the Brynderwyn Hills to the west and a full 2+2 upgrade on the current
alignment from the base of the Brynderwyn Hills to Whangarei, including a four lane urban
section in Whangarei.
• Foundation Programme 4 – One Network Road Classification (ONRC): This programme aims
to address the ONRC aspirations of this National High Volume corridor. It provides a full 2+2
expressway standard route between Puhoi and Whangarei (Toetoe Road) which will be
constructed offline. Within Whangarei, a four-lane urban section is provided to the SH14
intersection.
• Foundation Programme 5 - Alternative Modes: This programme aims to maximise alternative
mode opportunities between Auckland and Northland. It includes Park and Ride provision at
Warkworth and Wellsford and significant investment in the rail line to enable it to carry full
size 20TEU containers. It also includes passenger rail services and the construction of the
Whangarei to Northport rail line. Increased coastal shipping capacity is also assumed. Offline
cycleways are included between Whangarei and Waipu and between Puhoi and Wellsford.
• Foundation Programme 6 - Least Impact: This programme aims to address the investment
objectives while having the lowest possible physical impact on corridor. Therefore, a number
of minor online safety improvements and minor intersection improvements are recommended,
as well as rest areas and investment in police enforcement, improvements to detour routes
and improved provision for cyclists.
NZ TRANSPORT AGENCY
August 2017
52
Whangarei to Auckland – Connecting Northland
Following the development of the foundation programmes, the project team undertook an
assessment against the MCA criteria to establish the effectiveness of each. This assessment was
presented to the stakeholder group at Workshop 3. Stakeholders were given the opportunity to
comment on each programme and its assessment.
6.1.2
Further Programme Development
Each foundation programme was developed to address a specific project objective or issue. With the
knowledge of how each foundation programme performed with respect to the MCA; at Workshop 3,
stakeholder groups were asked to develop programmes that best responded to all of the investment
objectives. Groups were asked to take the best aspects of each foundation programme (as well as
any other options that they felt would be appropriate) to create a recommended programme. Using
this approach, four further programmes were developed, being:
• Programme 7 – Stakeholder 1: A variant of the 90km/h programme with the exclusion of any
large infrastructure projects between Te Hana and Kaiwaka.
• Programme 8 – Stakeholder 2: Similar to the Resilience programme with a lesser treatment
on the Brynderwyn Hills to SH15 section, an online solution between Oakleigh and Toetoe
Road and Whangarei urban improvements added.
• Programme 9 – Stakeholder 3: Similar to the Resilience programme with a lesser treatment
on the Brynderwyn Hills to SH15 section, an offline solution between Oakleigh and Toetoe
Road and Whangarei urban improvements added.
• Programme 10 - Stakeholder 4: A variant of the 90km/h programme with a 2+1 solution on
the Brynderwyn Hills to SH15 section.
Appendix H outlines these programmes in detail.
6.2
DO-MINIMUM
A Do Minimum programme has been developed for this corridor, against which the recommended
programmes are assessed. In the first instance, the Do Minimum was developed through
engagement with relevant areas of the Transport Agency. It was endorsed by the project
stakeholders at Workshop 2.
In order to determine the Do Minimum network for this corridor, projects that are currently under
construction, or are planned/committed have been included. The Do Minimum is summarised in
Table 4.
Table 4: Do Minimum
Project
Do Minimum
Discussion
Ongoing maintenance
Yes
NOC agreements
Puhoi to Warkworth RoNS
Yes
PPP currently being tendered, complete 2022
Warkworth to Wellsford RoNS
Yes
Proposed completion by 2027
Loop Road north intersection
Yes
Intersection with Portland Road improvements 2018
upgrade
NZ TRANSPORT AGENCY
August 2017
53
link to page 51
Whangarei to Auckland – Connecting Northland
Northern Brynderwyn Hills upgrade
Yes
Current safety works completed late 2016
Rail Network
Yes
No upgrades
SH14 Hospital intersection
Yes
Assume in place 2017
6.3
PROGRAMME ASSESSMENT
A three-stage programme assessment approach was used as shown
in Figure 16. Firstly, the
foundation programmes were assessed against the MCA criteria and then the programmes developed
in collaboration with the stakeholders were assessed against the same criteria. The third step was
the consideration of other factors outside of the MCA. Appendix H outlines in detail the assessment
undertaken for the programmes, including completion of the Transport Agency programme
assessment forms. A summary of the assessment undertaken is included in this section of the
report.
6.3.1
Foundation Programme Assessment
The foundation programmes were developed to best address a specific issue, being one of the
investment objectives, low impact or ONRC aspirations. These programmes therefore performed very
well against some, but not necessarily all, assessment criteria.
Of these programmes, Programme 5 (Alternative Modes) and 6 (Least Impact) delivered the least well
against the assessment criteria. Programme 5 is very expensive due to the cost of upgrading the rail
line and its ability to significantly improve the safety and reliability of the road corridor is considered
low. Programme 6 conversely has little impact on the environment and from a cost perspective
provides exceptional value, however the scale of expected outcomes against the investment criteria
was considered low. These two programmes were therefore discounted from consideration as a
preferred programme.
Programme 1 performed very well against the resilience objective, however comparatively it did not
perform as well as against the other investment objectives and its economic efficiency was not
strong. Programme 2 likewise performed well against the safety criteria and reasonably well from an
economic efficiency perspective, however did not address the economic growth investment objective
well. These two programmes were therefore discounted from consideration as a preferred
programme.
This left Programme 3 (Economic Efficiency) and Programme 4 (ONRC) which performed the best (and
similarly) against all investment objectives and the best of all the foundation programmes. The
assessment highlighted that a bigger investment provided a greater level of benefits for the corridor.
The results do however, indicate a level of diminishing returns once a certain level of investment as
demonstrated by the relatively close scoring of Programmes 3 and 4 with a large cost differential
It is however noted that both programmes are expensive and perform poorly from an economic
efficiency perspective. However, these two programmes remained in contention for the
recommended programme at this point.
As outlined previously, further programmes were then developed, taking the best from each
foundation programme. These programmes were assessed and compared against the two best
performing foundation programmes.
NZ TRANSPORT AGENCY
August 2017
54
link to page 55 link to page 55
Whangarei to Auckland – Connecting Northland
6.3.2
Further Programme Assessment
Programmes 7-10 were assessed against the same criteria as the foundation programmes.
Interestingly, although developed separately by each stakeholder group, all four programmes are
similar in form and therefore perform similarly against the assessment criteria.
Programme 10 was the best performing of these four programmes, best meeting the investment
objectives and delivering strong outcomes.
Programmes 7, 8 and 9 performed slightly less well than Programme 10. Whilst these three
programmes performed very similarly, Programme 9 was the best of these three due to its better
affordability and stronger performance from a resilience perspective.
Programmes 7 and 8 were therefore discounted, leaving Programmes 9 and 10.
This left Programmes 3, 4, 9 and 10 still within contention.
Figure 17 summarises the programme
assessment, relative ranking of the programmes and the outcomes expected for the investment. The
initially discarded programmes are ‘greyed’ out, to highlight the four programmes still in ‘in play’ for
the recommended programme.
Figure 17: Programme Assessment
-
-
- 0
-
-
- t
0
1
7
8
9
e
2
3 9
4
5 ev
6 c
1
e
c
(
a
e
e
e
n
e
y
e
)
e
e
it s
e
p
e
m
e
m
t
m
yc h
m
C
m
m
m
R
m
a
e
m
m
m
m
il
m
ef
m
n
/
m
m
n
d
m
I
m
m
m
m
a
i
a
e
m
N
r
o
t
a
a
a
a
r
s
ar S
ar i k
ar O
ar et M
ar s
r
r
r
r
g
e
g
g
ci
g
g
l
g
a
g
g
g
g
o
R
f
A
e
o
o
o
o
r
or
or f
or
or
or L
r
r
r
r
P
P
P
E
P
P
P
P
P
P
P
P1
P2
P3
P4
P5
P6
P7
P8
P9
P10
Summary
Objective 1 - reduce ful closures with no alternative route
+++
+
+++
+++
+
+
+++
+++
+++
+++
Objective 2 - reduce deaths and serious injuries
++
++
+++
+++
+
+
++
++
++
+++
Objective 3 - increase travel speed to 90 km/h
++
0
+++
+++
0
0
+++
++
++
+++
Feasibility
-
-
-
--
-
-
-
-
-
-
Affordability
-
0
--
--
--
-
--
-
0
-
Public / Stakeholders
0
-
+
+
-
-
+
+
+
+
Cultural, Social and Environmental Effects
-
0
-
-
0
0
-
-
-
-
Safety
++
++
++
++
+
+
++
++
++
++
Economy
++
0
++
+++
0
0
++
++
++
++
Ranking
7
8
3
1
11
9
6
5
4
2
Average score
8.7
3.1
11.0
11.9
-0.4
0.8
9.8
9.9
10.3
11.6
Cost (Lower Bound)
$970
$430
$1,900
$2,200
$1,000
$430
$1,500
$820
$880
$1,700
Cost (Upper Bound)
$1,500
$730
$2,800
$3,200
$2,300
$650
$2,400
$1,300
$1,400
$2,500
Cost (Lower Bound) NPV 2025
$610
$270
$1,200
$1,390
$630
$270
$950
$520
$550
$1,070
Cost (Upper Bound) NPV 2025
$950
$460
$1,760
$2,020
$1,450
$410
$1,510
$820
$880
$1,580
Benefits
$470
$240
$540
$620
$310
$310
$450
$410
$530
$550
BCR lower
0.8
0.9
0.5
0.4
0.5
1.1
0.5
0.8
1.0
0.5
BCR upper
0.5
0.5
0.3
0.3
0.2
0.8
0.3
0.5
0.6
0.3
Programme Performance
P1
P2
P3
P4
P5
P6
P7
P8
P9
P10
Investment Objective 1: Proportion with viable alternative
100%
70%
100%
100%
70%
70%
100%
94%
100%
100%
Investment Objective 2: KiwiRAP corridor rating (col ective)
0.10
0.14
0.09
0.08
0.14
0.14
0.08
0.10
0.10
0.08
Investment Objective 3: Mean vehicle speed km/h
81.7
78.5
84.8
86.6
79.7
79.7
81.7
82.5
82.1
86.6
Approximate travel time saving on corridor (min)
5.0
1.4
9.5
11.9
2.6
2.6
6.0
6.4
5.6
11.9
Reduction in DSI's per 5 years
85
77
91
99
64
64
99
85
86
99
Scoring - Al average weights
9
3
11
12
0
1
10
10
10
12
The four remaining programmes, as shown
in Figure 17, are the four highest ranked programmes
based on the MCA. At a macro scale, the four programmes perform similarly with respect to the
investment outcomes sought. There are however, differences between the four programmes. This is
summarised as follows:
NZ TRANSPORT AGENCY
August 2017
55
link to page 56
Whangarei to Auckland – Connecting Northland
• Resilience – All of the four remaining programmes deliver well against this objective, will each
programme resulting in 100% of the corridor meeting the investment objective. Not all of the
previous discarded programmes achieve this level of outcome. In addition, all four of the
programmes will deliver significant reductions in the number of incidents causing closure
through improved safety performance and bypass of problem areas.
• Safety – Programmes 3, 4 and 10 deliver the greatest reduction in DSI’s with the corridor
meeting the objective of a medium KiwiRAP Collective and Personal Risk rating or better by
providing a Low rating and between 90 and 100 DSI’s forecast to be saved in a five year
period. Programme 9 also delivered an overall Collective KiwiRAP rating for the corridor of
Medium and over 85 DSI’s forecast to be saved in a five year period.
• Economic Growth (90km/h) – Programmes 10 and 4 deliver the greatest outcome for this
objective, with an average speed of more than 86km/h, which equates to a travel time
between Puhoi and Whangarei of 1hr and 08 mins (1:08), representing over 10 minutes saving
in travel time. Programme 3 is next with an average speed of 85km/h and Programme 9 the
next best with an average speed of 82km/h, which equates to a travel time between Puhoi and
Whangarei of 1:13 mins, representing over five minute saving in travel time.
Correspondingly, the NPV economic benefits for these four programmes are similar, with a range of
between $530M and $620M.
Sensitivity testing of the MCA was undertaken by doubling the weighting for specific criteria. This is
summarised
in Figure 18. This shows some changes in order, but fundamentally the ranking of a
programme stayed within one position of its base ranking, indicating that there was not a significant
sensitivity to a particular category. The partial exception to this is the affordability criteria where
more affordable programmes did gain a number of placings in the rankings.
Figure 18 : Programme Sensitivity Testing
P1
P2
P3
P4
P5
P6
P7
P8
P9
P10
Summary
Objective 1 - reduce ful closures with no alternative route
+++
+
+++
+++
+
+
+++
+++
+++
+++
Objective 2 - reduce deaths and serious injuries
++
++
+++
+++
+
+
++
++
++
+++
Objective 3 - increase travel speed to 90 km/h
++
0
+++
+++
0
0
+++
++
++
+++
Feasibility
-
-
-
--
-
-
-
-
-
-
Affordability
-
0
--
--
--
-
--
-
0
-
Public / Stakeholders
0
-
+
+
-
-
+
+
+
+
Cultural, Social and Environmental Effects
-
0
-
-
0
0
-
-
-
-
Safety
++
++
++
++
+
+
++
++
++
++
Economy
++
0
++
+++
0
0
++
++
++
++
Ranking
7
8
3
1
11
9
6
5
4
2
Sensitivity Testing
P1
P2
P3
P4
P5
P6
P7
P8
P9
P10
Objective 1 - increase travel speed to 90 km/h
7
8
3
1
10
9
6
5
4
2
Objective 2 - reduce deaths and serious injuries
7
8
3
1
10
9
6
5
4
2
Objective 3 - reduce ful closures with no alternative route
7
8
3
1
11
9
4
6
5
2
Feasibility
7
8
3
2
11
10
6
4
5
1
Affordability
7
8
4
3
11
10
6
5
2
1
Public / Stakeholders
7
8
3
1
11
10
6
5
4
2
Cultural, Social and Environmental Effects
7
8
3
1
11
9
6
5
4
2
Enhanced safety for different types of transport users?
7
8
3
1
10
9
6
5
4
2
How wil the alternative/option affect traffic volumes?
7
8
3
1
10
9
5
6
4
2
6.3.3
Other Considerations
A significant difference between the programmes is the affordability, with Programme 9 less than half
of the cost of the other three programmes. This is shown in the sensitivity testing where Programme
9 jumps to the second ranked programme, from fourth when affordability is weighted more heavily.
NZ TRANSPORT AGENCY
August 2017
56
link to page 57
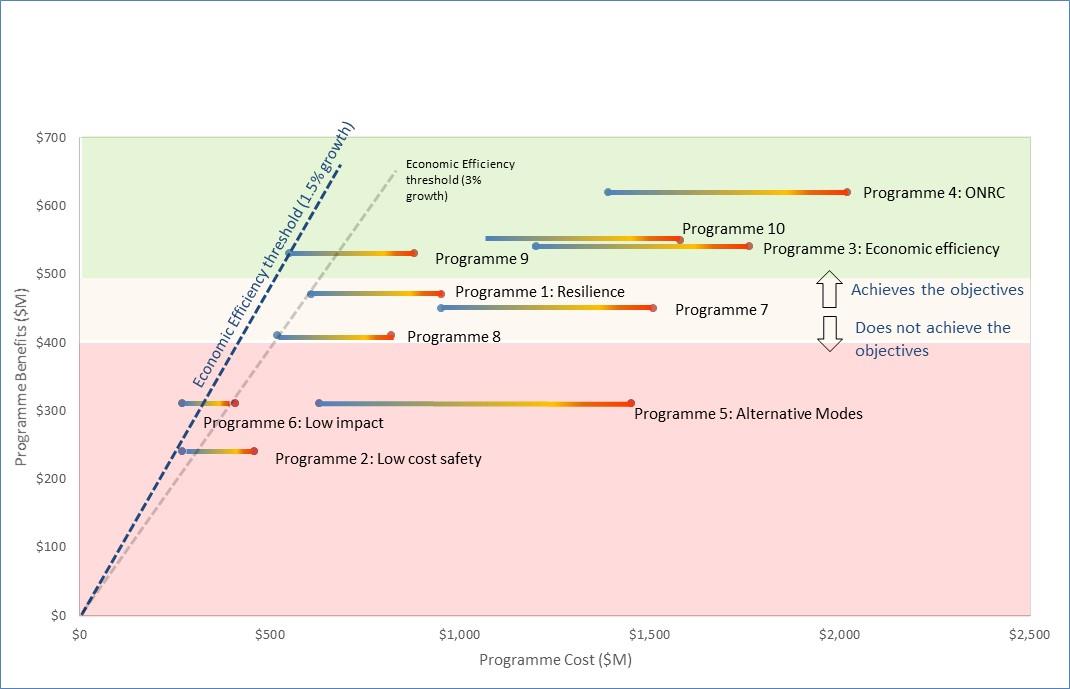
Whangarei to Auckland – Connecting Northland
Therefore, although Programme 9 is the 4th ranked programme in the MCA it has been selected as the
recommended programme. This is because it delivers a similar level of benefit and investment
outcome (at a macro level) as the three programmes ranked above it in the MCA, but it achieves this
for approximately 40% of the cost. It therefore has far superior economic efficiency. It is also the
only programme of these four with a BCR approaching the required economic efficiency of 1.0, with a
BCR range of 0.6 to 1.0.
Figure 19 shows the relative performance of the programmes from an economic efficiency
perspective and the level of transport benefits the investment can sustain (based on the problems
identified). Programme costs are reported as a range to reflect the level of detail available for cost
estimates.
A threshold of programme benefits has been estimated (as indicated by the background colours)
based on the problems and investment objectives identified for the corridor. This has been developed
in an effort to right size the investment response. As a rough guide, $400-$500M (NPV) of benefits
are considered to meet the investment objective. Programme which exceed this are providing
additional benefits from those sought by the investment objective.
While most of the programmes follow a general trend of ‘more investment – more benefits’, the
assessment indicates a level of diminishing return after a certain point. Programme 9 strikes the best
balance between delivering the available level of benefits in the corridor for an economically efficient
investment.
Figure 19 : Comparative Economic Efficiency of Programmes
NZ TRANSPORT AGENCY
August 2017
57
link to page 57
Whangarei to Auckland – Connecting Northland
Figure 19 also indicates the change in economic efficiency threshold if forecast traffic demand on the
corridor was doubled from an average of 1.5% to 3%. It indicates that Programmes 1 and 8 may
become economically efficient, but that these do not deliver as fully against the agreed investment
objectives. It also shows that Programmes 3 and 10, while delivering more against the investment
objectives, do not become economically efficient. If greater transport outcomes were desired,
Programme 4 delivers the most benefits.
There may be other reasons to justify further investment in transport outcomes that have not been
considered as part of this assessment (including Wider Economic Benefits as an example). Further
work would be required to quantify and justify this additional investment if additional outcomes were
desired.
NZ TRANSPORT AGENCY
August 2017
58
link to page 59 link to page 61
Whangarei to Auckland – Connecting Northland
7.
RECOMMENDED PROGRAMME
7.1
PROGRAMME OVERVIEW
The vision for this corridor is that it is safer and more reliable with a level of performance and quality
of alignment and form comparable to other New Zealand roads of a similar classification, so that it is
not an impediment to growth.
In a financially unconstrained environment, this vision may indicate that a four lane expressway
standard alignment is required. However, this business case indicates that the transport benefits
available in the corridor alone do not warrant investment of the scale necessary to deliver that
outcome within the next 30 years.
The recommended programme for SH1 between Puhoi and Whangarei therefore comprises a range of
interventions, including operational, supporting infrastructure (rest areas and service centre) and
both online and offline alignment enhancements. The schemes that make up the recommended
programme are outlined in
Table 5 an
d Figure 20 (pictorially) although the exact details of the
alignments will be confirmed in subsequent IBC stages.
Table 5 : Recommended Programme Components
Section
Road Infrastructure Investment
• Licence assistance – programme to assist young people in
Northland to obtain drivers licenses. Programme implemented in
partnership with local councils and the NZ Police.
• Alcohol education programme to target areas of poor compliance
with drink driving limits.
OPERATIONAL - Driver education •
and enforcement
Courtesy shuttles at popular pubs and drinking establishments
along and near the corridor
• Increased police enforcement – Increasing budget to the Police to
undertake road enforcement including drink driving, speed and
*555 response.
Safe Police observation bays
• Tourist signage – Enhance use of the Twin Coast Discovery Route
• Travel time signage – Retrofit existing distance guidance with
travel time in order to set travel time expectations. VMS detour
OPERATIONAL - Wayfinding
advance warning at key decision points on journey. I.e. at
Wellsford with information on SH16 vs SH1 to airport. Directional
arrows installed at 2.5km centres.
SN SATNav details of detour routes
Corner realignment and shoulder widening on selected corners to
SH15: Inland Freight Route (SH1 to
ease significantly substandard horizontal radii to address safety
SH14)
concerns on this route. Includes provision for a weigh station near
the SH1/SH15 intersection.
•
Four laning between Toetoe Road and Rewa Rewa Road
•
Four laning between Southend Avenue and Murdoch
Whangarei Urban Improvements
Crescent
•
Four laning between Murdoch Crescent and Tarewa Road
•
Footpath between Toetoe Road and Murdoch Crescent
NZ TRANSPORT AGENCY
August 2017
59
Whangarei to Auckland – Connecting Northland
Section
Road Infrastructure Investment
•
Cycle facilities between Toetoe to SH14 intersection
Offline 2+2 alignment with divided carriageway between Toetoe
Road and Oakleigh (Mangapai Road).
Toetoe to Oakleigh
Connection provided between Otaika Valley Road and Portland.
2+2 online upgrade of existing alignment with installation of wire
rope central and side barriers.
Oakleigh to SH15
Truck stop at SH15A intersection including vehicle charging
facilities
Intersection improvements at SH15A
Central wire rope barrier installed. Additional passing lanes
SH15 to Brynderwyn Hills
provided to improve passing opportunities.
Access rationalisation in Waipu
Western Bypass of the Brynderwyn Hills. 2+1 or 2+2 lanes. Wire
rope barriers provided.
Brynderwyn Hills
Tourist rest area – top of Brynderwyn Hills
Truck stop – SH12 intersection including vehicle charging facilities
Safety improvements including minor curve realignment
particularly around Ross Road. Installation of some side barriers.
Selected shoulder widening, paint marking and signage
improvements.
Kaiwaka township improvements including gateway treatments.
Brynderwyn Hills to Te Hana
Upgrade detour routes including Mangawhai Road and Kaiwaka-
Mangawhai Road including sections of shoulder widening and
minor curve realignments.
Truck stop/rest area in Kaiwaka including vehicle charging
facilities
• Improved permanent detour and tourism signage
RoNS project including extension to north of Te Hana. Offline 2+2
divided carriageway with interchanges north of Warkworth,
Te Hana to Warkworth
Wellsford and north of Te Hana.
Online safety improvements – Dome Valley
Town Centre improvements in Wellsford.
Puhoi to Warkworth RoNS. A 2+2 divided carriageway built to a
high standard. Includes interchanges at Puhoi and northern
Warkworth to Puhoi
interchange at Warkworth.
Park and Ride - Warkworth
The total cost of the recommended programme is between $880M to $1,430M. A range of costs
have been provided, given the level of detail of the estimates developed, as this is a programme
business case and individual options are in many instances not defined in detail.
This cost range includes operational and capital projects, however excludes the maintenance costs of
the programme (which are not assumed to create a significant additional maintenance burden). The
individual projects within the Do Minimum are not included in the programme costs as they are
assumed committed already.
NZ TRANSPORT AGENCY
August 2017
60

Whangarei to Auckland – Connecting Northland
Figure 20 : Recommended Programme (9)
Operational improvements:
➢
Licensing and
education programme
➢
Detour route legibility
with improved signage
➢
Travel times on signs
➢
Enforcement and
operational
improvements
NZ TRANSPORT AGENCY
August 2017
61
link to page 62
Whangarei to Auckland – Connecting Northland
7.2
PROGRAMME IMPLEMENTATION STRATEGY AND TRIGGER POINTS
The implementation of the recommended programme has been considered in its development. The
programme, whilst consisting of predominantly Transport Agency projects, will also require
implementation by other parties.
7.2.1
Timing and Triggers
In determining the timing for the implementation of the individual projects within the programme, a
number of factors has been considered, including the demand, economic efficiency and the need to
best meet the investment objectives. Prioritisation has been made by balancing a number of criteria
and applying the Transport Agency Performance Assessment Framework, with the following priority
of criteria applied:
• network performance and capability
• safety
• health
• environment
• cost
Based on this assessment, the implementation strategy for the programme from a timing perspective
is outlined
in Figure 21. This separately identifies the investigation and physical implementation
components of each project as some warrant early investigation to understand preferred alignments
and interface with others projects is considered important.
Figure 21 : Recommended Programme Implementation
Priority A
Priority B
Priority C
Urban Whangarei 4 Laning
Urban Whangarei Ped and Cycling
SH15 Upgrade Inland Route
Loop Road Intersection Upgrade
Toetoe to Oakleigh 2+2 Offline
v
Oakleigh to SH15A 2+2 online
SH1/SH15A intersection upgrade
SH15A to Brynderwyn 2+1
Brynderwyns Bypass
Sh12/Brynderwyns rest area
Kaiwaka Towncentre enhancements
Waipu to Wellsford detour route upgrade
Kaiwaka to Te Hana
Warkworth to Wellsford RONS to Te Hana
Warkworth to Wellsford On-line safety
Warkworth Park n Ride
Puhoi to Warkworth
Investigation
Do Min Investigation
Implementation
Do Min Implementation
The key aspects of this implementation strategy include:
NZ TRANSPORT AGENCY
August 2017
62
Whangarei to Auckland – Connecting Northland
• The safety and capacity improvements between Whangarei (SH14) and the Port is the most
urgent part of the programme given the demand and the current safety problems. To
compliment this upgrade, improvements to the inland freight route (SH15) will provide
benefits to heavy vehicles. The southern section (Oakleigh to SH15 would be triggered by
demand of 20,000 vpd).
• Investigation (through an IBC) of the Brynderwyn Hills bypass is an immediate priority to
identify a preferred alignment so that costs, benefits and impacts can be better quantified.
• Upgrades to the detour routes between Waipu and Wellsford should be progressed
immediately as HPMV resilience is required and works on SH1 in this area are not forecast for
a number of years.
• The Kaiwaka town centre enhancements should be done as soon as possible given the lack of
other improvements in this area of the programme and potential impact on the community.
• Online safety improvements through the Dome Valley should be undertaken immediately
• Warkworth Park n Ride should be progressed to ensure it is in place by the opening of the
Puhoi to Warkworth PPP project.
7.2.2
Implementation Partners
The recommended programme requires implementation from others. This includes local Councils
and partnerships in some of the behavioural options. Specifically, the implementation partnerships
include:
• WDC, Kaipara District Council and Auckland Transport - proposed resilience upgrades to local
roads between Waipu and Wellsford
• Whangarei District Council – in relation to the urban safety and capacity upgrades required
between Toetoe Road and SH14 given the built up nature of this section of the corridor
• The behavioural options will require close collaboration and implementation with the Police
and other government entities to ensure the most effective implementation of these options
• Rest areas / truck stops will require partnership with private entities
More details on the implementation of projects are outlined in the Implementation plan provided in
Appendix I.
NZ TRANSPORT AGENCY
August 2017
63
link to page 61


Whangarei to Auckland – Connecting Northland
8.
RECOMMENDED PROGRAMME – ASSESSMENT
A completed Transport Agency Programme Assessment Form for Programme 9 is included in
Appendix H.
Programme 9 was selected as it delivers on the outcomes sought for the corridor in an economically
efficient manner. Programme 9 offers a value for money programme that is affordable and able to be
implemented in stages over the next 30 years, with a manageable impact on the environment,
communities and culturally sensitive areas.
Programme 9 delivers the following outcomes:
PBC Investment Outcomes
•
6 min average travel time saving (Te Hana to
Whangarei), trucks approx. 10+ min
•
Mean operating speed of 82km/h
•
69 fewer deaths and serious injuries every 5 years
•
$880M - $1.4B cost, over 30 years
8.1
PROGRAMME OUTCOMES
The investment objectives describe the outcomes sought from investing in this corridor. A summary
of the outcomes achieved by the recommended programme is provided below:
8.1.1
Resilience
A step change in resilience is delivered by Programme 9. Resilience problems areas at the
Brynderwyn Hills and Dome Valley are bypassed by higher standard alignments. The offline upgrade
between Oakleigh and Toetoe Road in the north of the corridor will provide additional resilience in
this area where safety problems are significant and create route resilience challenges. Between
Oakleigh and SH15 (Port) an online upgrade is provided. This new 2+2 alignment, whilst on the
existing alignment will greatly increase the safety and resilience of this section of the network.
The remaining sections between SH15 (Port) to Brynderwyn Hills and Brynderwyn Hills to Te Hana will
have minor alignment enhancements but the road safety preformance of thses section will improve,
in turn reducing the frequency of closures.
Programme 9 will ensure that all corridor sections have a detour route suitable for all vehicles,
including HPMV, of less than 2 hours, fully meeting the investment objective. This will greatly
enhance the route security for users and in particular freight users.
8.1.2
Safety Outcome
Programme 9 addresses the most significant safety concern areas (Toetoe Road to SH15 and the
Brynderwyn Hills) in the corridor with a mixture of online and offline improvements in these areas as
outlined
in Figure 20. This programme achieves the objective of a MEDIUM KiwiRAP rating for the
corridor length. This rating is achieved in all areas, along the corridor with the exception of the
NZ TRANSPORT AGENCY
August 2017
64
link to page 66 link to page 66
Whangarei to Auckland – Connecting Northland
urban area of Whangarei and between the Brynderwyn Hills and Te Hana. The implementation of this
programme is expected to save 69 deaths and serious injuries every five years (the 86 in the
evaluation tables included Puhoi to Wellsford RONS savings). This will provide a safe corridor and a
significant improvement over its current safety performance for all road users, including freight and
tourists.
8.1.3
Economic Growth (90km/h) Outcome
Programme 9 delivers an average speed of 82km/h for the corridor (89km/h, including the Do
Minimum), which equates to a travel time between Puhoi and Whangarei of 1:13 min, representing
more than 5 minutes saving over the Do Minimum travel time.
The sections of the corridor that do not meet the 90km/h average speed target are between the
Brynderwyn Hills and Te Hana and within the urban Whangarei area. Between Brynderwyn and Te
Hana, the current speed environment is not that far from the average sought. The cost to increase
the speed in this section was not justifiable given the lack of other problems and the forecast level of
demand.
Within the urban Whangarei section, the presence of signalised intersections, side friction and
reduced speed environments do not allow the wider target to be achieved, however travel time and
reliability savings can be achieved through addressing pinch points in the network.
The improvements in freight travel times and reliability mean that economic confidence is anticipated
to increase in Northland, removing one of the current barriers identified as adversely affecting the
region’s economic growth.
8.1.4
Benefits Delivered Spatially
These outcomes are indicatively represented by the forecast transport benefits of the programme.
Figure 22 shows the benefits available by delivering the desired level of investment outcomes for
each corridor section. It compares this with the actual benefits realised by Programme 9.
Figure 22 shows that Programme 9 appropriately matches the level of investment at the northern end
of the corridor, under invests in the middle section (between SH12 and Wellsford) and potentially over
invests in the southern section.
The ‘under investment’ in the middle section relates to the significant level of investment required
between the Brynderwyn Hills and Te Hana to provide a higher level of outcome (reduced gradient
and improved horizontal alignment to increase average travel speed). This investment is not part of
the recommended programme given the lack of current or forecast demand over the next 30 years.
This is also reflected in the relative scale of available benefits in this section compared to the benefits
available at the northern and southern ends of the corridor.
The indicated ‘over investment’ in the southern section of the corridor relates to the significance of
the RoNS investment and the additional outcomes that this level of investment achieves when
compared to the investment objectives outlined in this PBC (which were not the same drivers for the
RoNS investment).
NZ TRANSPORT AGENCY
August 2017
65
link to page 67
Whangarei to Auckland – Connecting Northland
Figure 22 : Recommended Programme Benefits
700000
Safety Benefits
600000
500000
KM ($)
r 400000
e
Travel Time
p 300000
itsfen 200000
Be
100000
Recommended
Programme
0
To
Sp
Mar
W
Mar
SH
W
N
S
Puh
n
o
Safety Benefits
e
ri
aip
e
o
o
u
t
T
12 to
rt
W
o
n
S
l
rt
t
R
o
p
s
ls
h
h
o
e
g
d
s
ark
i
o
e
ri
u
fo
h
to
R
fie
e
d
Braig
o
o
ad
to
n
n
(
e
rd
W
f W
o
f W
o
e
l
g
P
T
n
W
e
f W
w
s
(
h
ad
d
R
fie
P
to
l
o
o
Recommended
S
R
o
e
ai
h
ls ark
ark
rt
u
H
to
o
o
l
i
o
d
n
B
i
)
p
S
fo
ark
th
Programme TT
14)
ad
ad
R
t R
n
r
u
H
h
O
t R
aig
rd
w
w
o
o
(
th
12
o
w
o
Benefits
tai
to
o
ad
f
ad
o
h
rt
o
r
ad
)
e
rt
th
k
to
h
a
to
to
h
to
8.2
PROGRAMME RISK
The recommended programme has a number of risks associated with its implementation that were
assessed as part of the programme assessment framework. These are summarised below:
8.2.1
Feasibility
Programme 9 was considered to have minor risks with respect to feasibility. Generally, the options
proposed are straightforward, well understood and ‘standard’ in nature.
Two new offline sections are proposed with this programme (Toetoe Road to Oakleigh and western
Brynderwyn Hills bypass). These carry some property and consenting risk, particularly with respect to
the coastal marine area (CMA) near Oakleigh.
The Whangarei urban improvements require widening of the State Highway in a built-up area. There
are potential consenting and property risks associated with this. In addition, all online schemes will
require careful planning to ensure the corridor continues to provide accessibility through
construction. No fatal flaws are envisaged with respect to consenting and construction.
The operational options carry some risk, as they require careful collaboration with other parties,
including the Police and other government organisations to ensure implementation is appropriately
planned and rolled out.
8.2.2
Affordability
Programme 9 is considered relatively affordable, given its BCR range (0.6 - 1.0) is at or close to the
the minimum threshold. Therefore, it is considered that the programme is likely to be efficient and
fundable through the National Land Transport Fund (NLTF).
Table 6 sets out costs and benefits for
each of the programmes considered.
NZ TRANSPORT AGENCY
August 2017
66
Whangarei to Auckland – Connecting Northland
Table 6: Programme Benefits vs Costs
P1
P2
P3
P4
P5
P6
P7
P8
P9
P10
Cost (Lower
$970
$430
$1,900 $2,200 $1,000
$430
$1,500
$820
$880
$1,700
Bound)
Cost (Upper
$1,500
$730
$2,800 $3,200 $2,300
$650
$2,400 $1,300 $1,400 $2,500
Bound)
Cost (Lower
Bound) NPV
$610
$270
$1,200 $1,390
$630
$270
$950
$520
$550
$1,070
2025
Cost (Upper
Bound) NPV
$950
$460
$1,760 $2,020 $1,450
$410
$1,510
$820
$880
$1,580
2025
Benefits
$470
$240
$540
$620
$310
$310
$450
$410
$530
$550
BCR lower
0.8
0.9
0.5
0.4
0.5
1.1
0.5
0.8
1.0
0.5
BCR upper
0.5
0.5
0.3
0.3
0.2
0.8
0.3
0.5
0.6
0.3
However, with an expected cost of between $880M and $1.43 billion, the programme represents a
prioritisation risk, with respect to the potentially limited funds available through the NLTF. It is likely
that construction would be staged over a number of years.
Further, detailed analysis is required to confirm these funding arrangements, as projects are
developed in more detail through Indicative and Detailed Business Case phases.
Some programme options could potentially use alternative funding sources given their design, which
could make tolling options possible. Further investigation would be required to understand the
benefits and impacts of this funding option.
Aspects of the programme will require implementation by other parties. The details of these funding
arrangements are yet to be confirmed.
8.2.3
Stakeholder / Public Considerations
Stakeholder and public perceptions are always a risk for infrastructure projects. To mitigate this risk
and ensure that as many perspectives as possible were included in the development of the PBC;
stakeholders were invited to attend a number of interactive workshops. In addition, public views
were sought via a web page dedicated to the PBC.
Options and alternatives were developed collaboratively with stakeholders at a workshop.
Assessment criteria were taken from NZ Transport Agency guidelines for option evaluation, agreed
with stakeholders and used to evaluate the identified options and alternatives with respect to their
relative ability to deliver against the agreed investment objectives for the corridor. Stakeholders then
participated in a workshop to develop a range of potential programmes for the corridor. Programme
NZ TRANSPORT AGENCY
August 2017
67
Whangarei to Auckland – Connecting Northland
9 was developed by one of these stakeholder groups with only minor refinements made by the
project team.
There will likely be differences of perception with respect to the proposed implementation plan. In
particular different groups are likely to have differing views of the options that should be prioritised
for early implementation. Specific management plans will need to be developed and actioned as the
programme is developed further and implemented.
Programme 9 is considered likely to attract both support and opposition like most infrastructure
projects. Fundamentally it is considered that the key aspects of the project, providing a safer and
higher quality alignment from Whangarei to SH15 (Port) and through the Brynderwyn Hills will be well
received by stakeholders and the public. This assessment is based on the feedback from
stakeholders through this PBC process.
8.2.4
Cultural Heritage, Environmental and Social Responsibility Considerations
There are identified areas of significance from a cultural heritage, environmental and social
perspective along the corridor. Programme 9 is considered to carry some risk in this area however as
it does not affect any specifically identified significant areas it is considered that this risk can be
managed.
Culturally there are areas of significance throughout the corridor. Detailed investigation will be
undertaken as part of individual project development, however based on what is known at this time,
the programme does not directly affect any specific cultural heritage sites and therefore it is
considered that this risk can be avoided or mitigated appropriately.
Environmental sensitive areas exist along the route and large-scale infrastructure projects will have an
effect on the environment. These will need to be managed. The main areas of concern relate to the
CMA near Oakleigh and ecologically sensitive areas through the Dome Valley and the Brynderwyn
Hills. Like the cultural issues, more work is needed to understand these in detail, however no
significant concerns have been identified at this stage.
There will be social enhancements with the improved safety and accessibility delivered by Programme
9. This must be balanced with the potential social impacts of property purchase and severance
caused by new offline alignments recommended in Programme 9.
A bypass of Te Hana is recommended. This will need to be sensitively addressed and mitigation
measures provided. Kaiwaka is likely to have increased traffic volumes and appropriately managing
the competing functions of through traffic and local town accessibility are an important focus for the
Kaiwaka town centre improvements project.
8.2.5
Safety
This risk is closely related to the Safety Objective, with Programme 9 providing a safer corridor.
Appropriate implementation planning to ensure safety during this construction will be required. This
risk is well understood with the options proposed as part of the overall programme.
8.2.6
Economy
Programme 9 improves the safety, reliability and performance of SH1 between Puhoi and Whangarei.
Travel times between Puhoi and Whangarei will reduce to 1:13 mins. This level of improvement in
transport performance will create a greater level of confidence for investor and business in Northland.
NZ TRANSPORT AGENCY
August 2017
68
Whangarei to Auckland – Connecting Northland
Programme 9 is a key component of the investment story improving connectivity to the Northland
region to a comparable level to the rest of the country and acting as an enabler to economic growth.
If the GDP of Northland was increased by only 1% as a result of this programme, this would equate to
over $60M of increased economic activity per year.
8.3
PROGRAMME OPPORTUNITIES
The proposed programme delivers against the investment outcomes sought and results in some risks
to implementation as outlined above. The recommended programme also offers a number of
opportunities to users, investors and the wider community. These include:
8.3.1
Social
The recommended programme bypasses Wellsford and Te Hana, this offers these towns the
opportunity to redevelop and redefine themselves without the constraint and adverse effect of SH1
running through the middle of the town. Kaiwaka will continue to have SH1 running through the
middle of town. The proposed town centre enhancement project within the recommended
programme is an opportunity to realise real social and community benefits outside of the transport
and safety benefits of the enhancement project. Further social opportunities exist for the
communities on the eastern beaches along the corridor. The increased resilience and improved
signage of roads in this area (as part of alternative route upgrades) presents an opportunity to attract
more tourists and users to their communities. Finally, the social programmes to address safety
problems, such as the license support programme offer greater social and community opportunities
and benefits than simply the safety benefits directly claimed as part of this programme.
8.3.2
Tourism
As outlined above improving alternative routes will provide additional opportunities for tourism in the
corridor. The programme is also predicted to provided increased tourism ‘traffic’ due to the higher
quality route that will be provided, making the journey more attractive to tourists using the corridor
to connect with Northland. The programme also provides enhanced and more frequent rest areas,
intended to improve tourist journey quality. The recommended programme will also be more
commensurate with the quality of road experienced by tourists when leaving Auckland and traveling
north.
8.3.3
Land Use Integration
The recommended programme is a significant investment and offers considerable land use
integration opportunities along the route and also for nearby communities. As outlined above,
townships directly on or near the route will have the opportunity to respond to the programme and
plan land use in an integrated manner. With increased accessibility this land use can potential
change from current thinking. Further afield communities such as Mangawhai could also realise the
opportunity of increased accessibility through land use changes. The enhancements between
Whangarei and SH15 (port) also create the opportunity for different thinking about land use
integration along this section.
8.4
VALUE FOR MONEY
Programme 9 balances the cost of achieving the investment outcomes sought, particularly compared
to the other programmes assessed. With NPV benefits of $530M and a cost range of $880m to
$1,430m, a BCR of between 0.6 and 1.0 is forecast.
NZ TRANSPORT AGENCY
August 2017
69
link to page 28 link to page 71
Whangarei to Auckland – Connecting Northland
Detailed analysis is required for each individual option within the programme, during subsequent IBC
and DBC phases; however there is a good benefit stream that indicates a good value for money story.
This BCR analysis has been based on appropriate assumptions for a programme at this stage, with
further benefits envisaged as more detailed analysis is undertaken. The economic assessment is
based on a 6% discount rate, 40 year evaluation period, 4 year construction period and 2025 opening
date. The benefits for each programme where calculated on a case by case basis but following the
broad assumptions set out below:
• Safety benefits were calculated by applying a crash reduction factor of between 35 % and 75%
depending on the intervention proposed on each section.
• Travel time benefits have been calculated based on changes in traffic speeds from the current
operating speed up to 90km/h depending on type of intervention
• Vehicle operating costs have been assumed at 10% of travel time benefits.
Wider economic benefits have not been included, and given economic growth is a key part of the
objectives of this project (and with transport identified as a key enabler for economic growth in the
NEAP) it is considered likely that these would exist for this programme, further strengthening the
value for money proposition of this programme.
8.5
SENSITIVITY ANALYSIS
The forecasting of future costs and benefits at the programme level involves a degree of uncertainty
and the economic analysis is sensitive to the assumptions or predictions inherent in the analysis.
To ensure that the recommended programme has been selected on a robust basis, reference is made
to the uncertainty log agreed with stakeholders as part of the Strategic Case and outlined in
Table 1. Four scenarios were developed to assess the sensitivity of Programme 9 as the recommended
programme. The scenarios were:
• Growth forecast increases – Part of the reason for this project is to improve the economic
performance of Northland. A sensitivity test was undertaken to understand the effect on the
programme if current forecast growth rates doubled. From a transportation demand
perspective, this means average growth rates increasing from 1.5% to 3% pa.
• Growth forecast reduces – A scenario was developed assuming that current growth forecasts
were not realised and the traffic growth rate halved to 0.75% pa.
• NorthPort expansion – If NorthPort significantly increased its tonnage due to rationalisation
of ports across the Upper North Island, this could result in increased demand for road-based
freight trips (500 trucks / day assumed) and increased rail demand.
• Rail mode share reduces – This scenario tests the effect on the programme if constraints in
the downstream rail network (Auckland) for freight increase. It assumes that all current rail
freight is moved by truck on SH1.
8.5.1
Scenario Outcomes
The potential outcome of these scenarios is summarised
in Table 7.
NZ TRANSPORT AGENCY
August 2017
70
Whangarei to Auckland – Connecting Northland
Table 7 : Sensitivity Analysis Outcomes
Safety
Economic
Scenario
Growth Objective
Resilience Objective
Objective
Efficiency
Average speed slows
slightly and increases
demand on SH15 (Port) to
Increased demand may
Brynderwyn Hills and
accelerate implementation
Brynderwyn Hills to Te
of Brynderwyn Hills bypass
Medium
Hana sections.
to improve the resilience of
Increases
Increased KiwiRAP rating
Requirement for
that section.
to approx.
Growth
achieved for
Brynderwyn Hills bypass
Resilience interventions
0.7-1.2
route
accelerated.
may be considered for
Unlikely to increase
Brynderwyn Hills to Te
requirement to 2+2
Hana section
capacity on these
sections.
Timeframes for
Medium
Average speed increases
interventions would be
Reduces
Reduced
KiwiRAP rating
slightly and extends the
delayed, in particular the
to approx.
Growth
achieved for
implementation timeframe
SH15 (Port) to Brynderwyn
0.5-0.9
route
for some interventions
Hills section
Increased demand may
accelerate implementation
Average speed slows
of Brynderwyn Hills bypass
Medium
slightly and potentially
to improve the resilience of
Increases
NorthPort KiwiRAP rating
accelerates requirement
that section.
to approx.
Expansion achieved for
for the Brynderwyn Hills
Resilience interventions
0.7-1.1
route
bypass
may be considered for
Brynderwyn Hills to Te
Hana section
Increased demand may
accelerate implementation
Average speed slows
of Brynderwyn Hills bypass
Medium
slightly and potentially
to improve the resilience of
Increases
Rail Mode KiwiRAP rating
accelerates requirement
that section.
to approx.
Share
achieved for
for the Brynderwyn Hills
Resilience interventions
0.7-1.2
route
bypass
may be considered for
Brynderwyn Hills to Te
Hana section
Overall, the conclusion of this sensitivity analysis is that the timing of options within the programme
could be delayed or accelerated dependent on the scenario. If the scale of the change was
significant, it may be necessary to revisit the need for some of the options. If growth was
significantly greater, it is possible that the section of the corridor between the Brynderwyn Hills and
Te Hana could require additional capacity near the end of the 30-year time horizon of this
programme. Conversely if growth was slower, the option of a 2+1 online enhancement between
SH15 (Port) and the Brynderwyn Hills could be delayed further and potentially not needed at all.
NZ TRANSPORT AGENCY
August 2017
71
Whangarei to Auckland – Connecting Northland
The rail mode share and NorthPort scenarios would likely result in additional heavy vehicles and
freight movements on the route, which could result in the acceleration of the Brynderwyn Hills bypass
option within the programme.
Overall, it is considered that the recommended option responds to these sensitivity scenarios well.
8.6
ASSESSMENT PROFILE
An assessment profile of H/H/0.6-1.0 has been determined for the programme using the Transport
Agency’s Investment Assessment Framework as detailed below:
8.6.1
Strategic Fit
Strategic fit of the problem, issue or opportunity that is being addressed: H/M/L
Overall the corridor has been given a high strategic fit as the problems and benefits defined by the
project partners, and supported by the currently available evidence, are closely aligned with achieving
the Government’s goals for land transport and the Transport Agency’s three-year strategic priorities
on predictable journeys for urban customers and improved freight network productivity.
The Strategic Case confirms that the key problems relate to safety, efficiency, reliability and
resilience, particularly for freight, and that these are significant from a national perspective.
Evidence collected through the Strategic Case indicates that the gap between current customer levels
of service on the corridor and that considered appropriate for a National High Volume corridor is
significant.
In line with the Transport Agency’s current Investment and Revenue Assessment Framework, the
Strategic Case also focuses on improving SH1 as a national route by:
• Contributing to economic growth and productivity through improving the cost of travel
along SH1, especially for the movement of freight
• Improving the safety of the corridor so that it is consistent with requirements for a
National High Volume route, resulting in a reduced number of crashes involving injury and
death
• Improving the resilience of the corridor between Northland and key markets to remove
constraints on economic growth and investor confidence
This indicates a high Strategic Fit.
8.6.2
Effectiveness
Effectiveness of the proposed solution:
H/M/L
Overall, the corridor has indicatively been given a high effectiveness rating subject to further
investigation. Whilst options have not yet been considered in detail, the following provides an
indicative view of the potential effectiveness of improving the SH1 corridor.
This is based on the intent and potential scope of the preferred programme(s) to deliver against the
range of effectiveness criteria set out in the current Investment Assessment Framework, as set out
below.
NZ TRANSPORT AGENCY
August 2017
72
Whangarei to Auckland – Connecting Northland
Component
Explanation
Rating
• tangible change in addressing the problem, issue or
Outcomes
opportunity identified in the Strategic Fit assessment
L/M/H
focused
• consistency with levels of service in an appropriate
classification system
• consistency with the current network and future
transport plans
• consistency with other current and future activities
Integrated
•
L/M/H
consistency with current and future land use planning
• accommodates different needs across modes
• support as an agreed activity across partners
• the degree of fit as part of an agreed strategy or
business case
• has followed the intervention hierarchy to consider
alternatives and options including low cost alternatives
and options
Correctly scoped
•
L/M/H
is of an appropriate scale in relation to the
issue/opportunity
• covers and/or manages the spatial impact (upstream and
downstream, network impacts)
• mitigates any adverse impacts on other results
• is affordable through the lifecycle for all parties
• has understood and traded off the best whole of life cost
approach
Affordable
L/M/H
• has understood the benefits and costs between transport
users and other parties and sought contributions as
possible
• delivers enduring benefits over the timeframe identified
Timely
in the justified strategy or business case
L/M/H
• provides the benefits in a timely manner
• manages current and future risk for results/outcomes
Confidence
L/M/H
• manages current and future risk for costs
Overall
• Assessment based on lowest rating of all components
L/M/H
Achieving the agreed benefits would support and promote the National High Volume role of SH1.
NZ TRANSPORT AGENCY
August 2017
73
link to page 69
Whangarei to Auckland – Connecting Northland
Based on the problems identified, there is sufficient scope to identify appropriate alternatives that
would make a significant contribution to achieving the multiple impacts of the GPS.
The agreed problems and benefits are integrated, and therefore there is scope to make a significant
contribution to multiple outcomes including:
• Improving safety outcomes for the corridor
• Improving journey time reliability
• More efficient and productive freight supply chains
• Improving route resilience and route security
The PBC will have a role in wider regional strategies and planning documentation though increased
confidence in the corridor and will provide ongoing integration between land use and transport for
the corridor.
8.6.3
Efficiency
Benefit and cost appraisal: H/M/0.6-1.0
Details of the benefit and cost appraisal are provided in Section
8.4, above. The BCR has been
assessed to be within the range of 0.6 – 1.0.
NZ TRANSPORT AGENCY
August 2017
74
link to page 75
Whangarei to Auckland – Connecting Northland
9.
PROGRAMME FINANCIAL CASE
9.1
INDICATIVE COST
The cost of the programme was developed through the development of costs for each individual
option that made up the recommended programme. These individual costs were then combined to
give a total cost.
These costs were developed through the knowledge of Transport Agency projects and previous
costings for options from early investigations (where this existed). All cost estimates are expressed
as a range, i.e. upper-bound and lower-bound values only have been provided.
Given the strategic nature of a programme business case, detailed option development has not been
undertaken and therefore a range best represents the costs at this stage in the programme life cycle.
Table 8 shows the cost per project element within the programme.
It indicates that the expected total cost range for Programme 9 is $880 to $1,430M.
Table 8 : Programme Cost
Cost of project
Section
Road Infrastructure Investment
($M undiscounted)
Inland Freight Route
SH15 improvements for HPMV
$20-30
Urban multi-modal capacity improvements
Whangarei urban
$30-50
Footpath and cycle facilities
Toetoe to Oakleigh
2+2 offline
$160-280
2+2 online
Oakleigh to SH15A
$140-210
Online safety improvments + extension of
SH15A to Brynderwyn
passing lanes.
$30-50
Hills
Intersection upgrade
2+2 bypass to the west
Tourist rest area – top of Brynderwyn Hills
Truck stop – SH12 intersection
Upgrade detour routes:
Brynderwyn Hills
$450-730
•
Improved permanent signage
•
Satnav details of detour routes
•
Improved alignment
Provision for cyclists
Brynderwyn Hills to Te
Minor online improvements
$10-30
Hana
Kaiwaka township improvements
Truck stop – Te Hana
Te Hana to Warkworth
Online safety improvements – Dome Valley
$30-40
Improvements to SH16
NZ TRANSPORT AGENCY
August 2017
75
Whangarei to Auckland – Connecting Northland
Cost of project
Section
Road Infrastructure Investment
($M undiscounted)
Warkworth to Puhoi
Park and Ride – Warkworth
Less than $5
•
Licence assistance
Driver education and
•
Alcohol education programme
Less than $5
enforcement
•
Courtesy shuttles
•
Increased police enforcement
•
Tourist signage
Wayfinding
•
Travel time signage
Less than $5
•
VMS detour advance warning
TOTAL
$880-1430
9.2
FUNDING ARRANGEMENTS
The expected programme BCR is at the minimum threshold. Therefore, it is considered that the
programme will be efficient and fundable through the National Land Transport Fund (NLTF).
However, with an expected cost of between $880M and $1.43 billion, the programme represents a
prioritisation risk, with respect to the potentially limited funds available through the NLTF.
It is likely that construction would be staged over a number of years, with improvements to the
section between SH14 and Oakleigh recommended to commence within 5 years, while the full
programme is not expected to be constructed for more than 20 years.
Further, detailed analysis is required to confirm these funding arrangements, as projects are
developed in more detail through Indicative and Detailed Business Case phases.
Funding will need to be confirmed through the inclusion of individual components of the programme
in the 2018-2021 National Land Transport Plan, which is due for development for the next 3+3+4
years in June 2017.
Aspects of the programme will require implementation by other parties. The details of these funding
arrangements are yet to be confirmed.
9.3
AFFORDABILITY
As indicated above, it is consider that the recommended programme will be efficient and fundable
through the NLTF. Implementation would be staged over several years.
The recommended programme will be jointly progressed in coordination with Road Controlling
Authorities Auckland Transport (AT), Kaipara District Council (KDC) and Whangarei District Council
(WDC). This approach is proposed, as several programme elements are located on the local road
network, under the control of these organisations.
NZ TRANSPORT AGENCY
August 2017
76
Whangarei to Auckland – Connecting Northland
PART C – DELIVERING AND
MONITORING THE PROGRAMME
NZ TRANSPORT AGENCY
August 2017
77
Whangarei to Auckland – Connecting Northland
10.
MANAGEMENT CASE
The management case assesses whether a programme is deliverable. It tests the programme
planning, governance structure, risk management, communications and stakeholder management,
benefits realisation and assurance. It sets out a plan to ensure that the programme benefits are
realised and includes measures to assess and evaluate this.
10.1
PROGRAMME GOVERNANCE AND REPORTING
The programme will be led by the NZ Transport Agency. Some components of the programme will
require investment from other organisations including Auckland Transport, Whangarei District
Council, Kaipara District Council and the NZ Police.
A project management team will be responsible for the day-to-day management of the project. A
project control group will meet fortnightly to consider and endorse key project milestones.
The project team will engage Professional Services specialists to develop Indicative and Detailed
Business Cases for individual projects as required. These Professional Services resources would
report directly to the in-house project team. The subsequent stages of project development should
use this PBC as a key reference document for an subsequent development and could trigger the need
to update the PBC should any of the key assumptions change.
In addition, inputs from a number of Transport Agency teams will be required. The table below
shows the responsible person in each case:
Role
Responsible Person
Programme Sponsor
Jim Sephton
Stakeholder / Comms
Kelli Sullivan
Transport Planning
Sebastian Reed
Planning and Investment Case Manager
Martin Taylor
Road Safety
Brian Rainford
Network Operations
Graham O’Connell
Network Management
Tim Crow
Project Services
TBA
10.2
STAKEHOLDER ENGAGEMENT AND COMMUNICATIONS PLAN
The key stakeholders for the PBC are listed below. The stakeholders have been identified based on
the practical and technical details of the range of issues, interactions and alternatives/options that
may be considered. Most of the stakeholders have been engaged through participation in the PBC
workshops including confirming the strategic case, developing alternatives/options and the preferred
option(s) workshops. They will also be included in the circulation of the related business case
documents for review and agreement.
• Auckland Council
• Auckland Transport
NZ TRANSPORT AGENCY
August 2017
78
Whangarei to Auckland – Connecting Northland
• Kaipara District Council
• Whangarei District Council
• Northland Inc
• Iwi
• Road Transport Association
• NZ Police
• National Road Carriers
• Northport
Different stakeholders will bring specialist judgement or bring different perspectives and skills at
different stages.
A stakeholder plan will be developed to ensure these relationships are appropriately managed and to
optimise the development of individual IBCs and DBCs. This will also address the specific details for
each stakeholder, including key contact person and approach for engagement.
Stakeholders will be managed through the Programme Manager, with support from the Agency’s
communications team, who knows the stakeholders well and will assist with organisation and
preparation for this stakeholder engagement.
External communications will be managed through the Programme Manager, with support from the
Agency’s communications team, who will assist with organisation and preparation for these
communications. A Communications Plan will be prepared.
10.3
PROGRAMME PERFORMANCE AND REVIEW
It is important that performance against the investment objectives and desired outcomes be reviewed
following implementation of each programme element. This review may indicate that other parts of
the programme may not need to be pursued or that triggers may need to be reviewed.
With respect to the SH1 Auckland to Whangarei corridor programme, it is likely that the four-lane
component of the programme from Whangarei to SH15 will be delivered ahead of other programme
components. As such, a performance review hold-point is recommended following construction to
determine whether triggers for further interventions remain appropriate.
NZ TRANSPORT AGENCY
August 2017
79
Whangarei to Auckland – Connecting Northland
APPENDIX A – NETWORK PLAN
NZ TRANSPORT AGENCY
August 2017
80
Whangarei to Auckland – Connecting Northland
APPENDIX B - ENVIRONMENTAL PLANS
NZ TRANSPORT AGENCY
August 2017
81
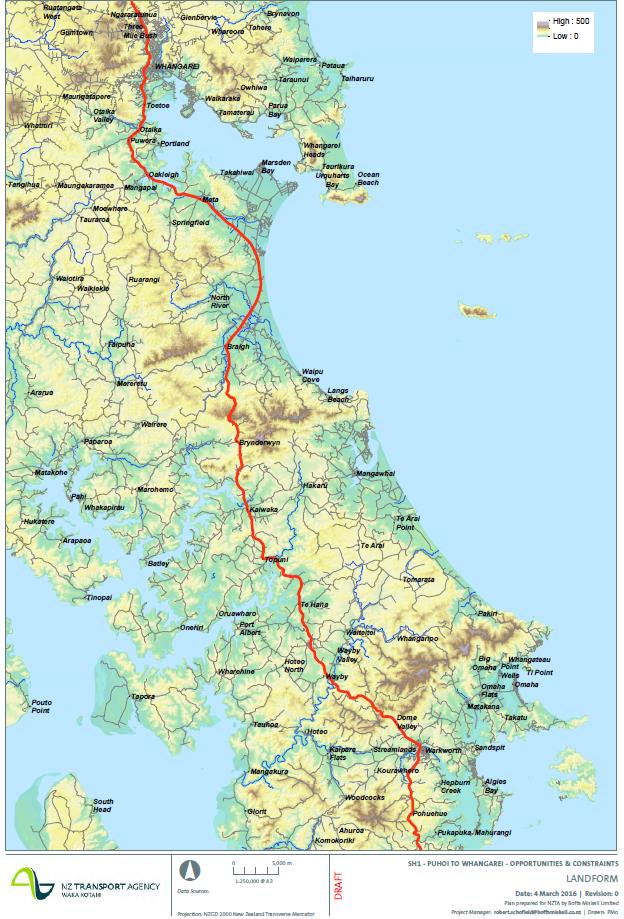
Whangarei to Auckland – Connecting Northland
NZ TRANSPORT AGENCY
August 2017
82
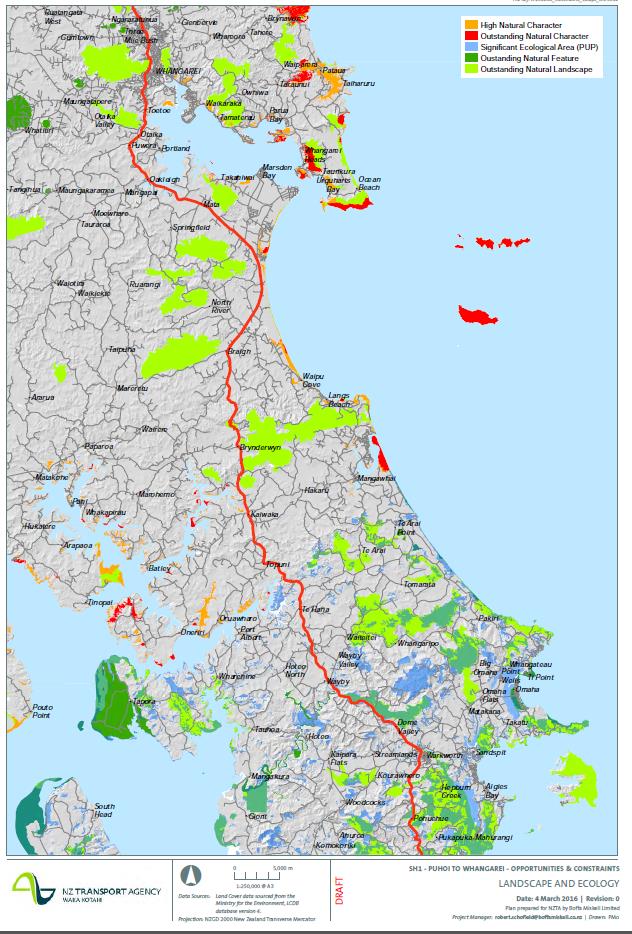
Whangarei to Auckland – Connecting Northland
NZ TRANSPORT AGENCY
August 2017
83
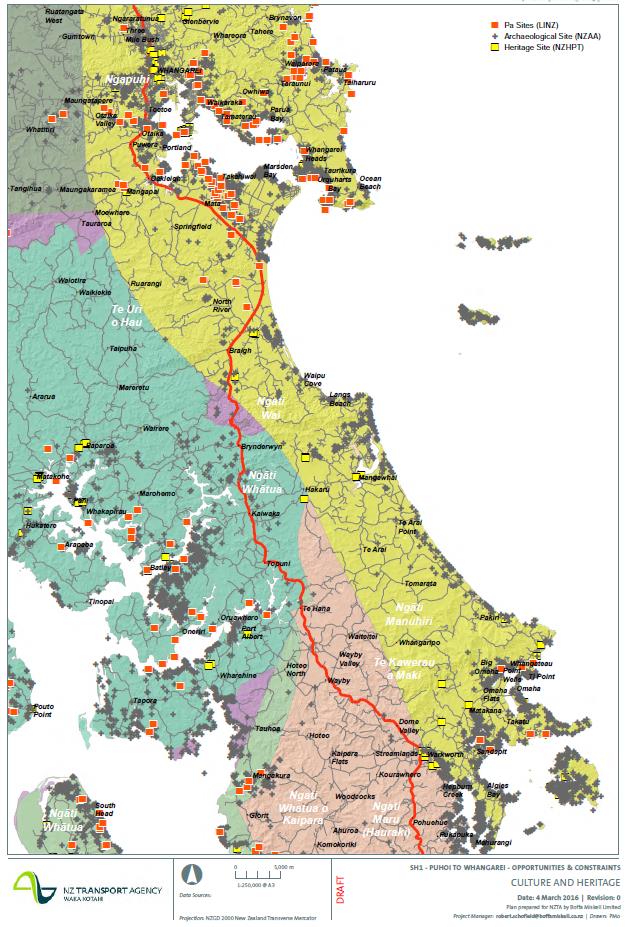
Whangarei to Auckland – Connecting Northland
NZ TRANSPORT AGENCY
August 2017
84
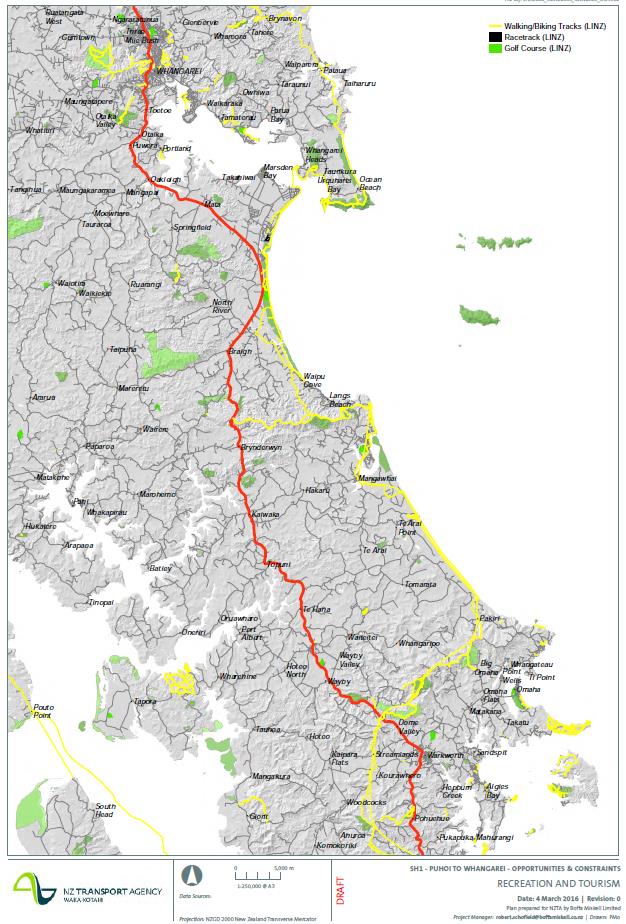
Whangarei to Auckland – Connecting Northland
NZ TRANSPORT AGENCY
August 2017
85
Whangarei to Auckland – Connecting Northland
APPENDIX C –STRATEGY DOCUMENTS
Government Policy Statement on Land Transport 2015/16 – 2024/25
The NZ Transport Agency must give effect to the Government Policy Statement (GPS), which sets out
the Government’s strategic direction for investment in the land transport network. The GPS places
particular importance on investment in the state highway network, in recognition of its importance to
the efficient movement of people and freight, and addressing the safety problems across the
network. Whilst the focus of the GPS is very much on delivering the current Roads of National
Significance programme, the associated long-term results sought are intended to directly support
economic growth and productivity through provision of better access to markets and employment.
Regional Land Transport Strategy
The current Regional Land Transport Strategy (RLTS) identifies a number of regional policies and
priorities that seek to achieve integrated transport outcomes in the future. Four of the seven
priorities are key to supporting the outcomes that are desired for the SH1 corridor:
• Resilience of the road network
• Alignment with HMPV usage
• Freight and economic development
• A safer road network, reducing fatalities and serious injuries.
The RLTS recognises that volumes of freight are significant and the importance of the Auckland to
Whangarei transport corridor (SH1) as critical to the Northland region’s growth and performance:
“The Auckland isthmus effectively separates the Northland region from the rest of New Zealand. As a
result, Auckland is a key lifeline for Northland. Secure and reliable transport connections to
Auckland and beyond are critical for economic success of both regions. Access difficulties (through
Auckland, through Northland or both) may deter some visitors and have significant implications for
freight movements, particularly with the trend towards ‘just in time deliveries’ to retail and wholesale
sector outlets serving Northland’s consumer and tourism sectors rather than businesses stockpiling
supplies.
Secure transport connections are therefore vital to ensure the security of supply of the goods, food
and fuel that the region depends upon. Northland’s road network is also vital for access to
emergency and essential services.”
NZ Transport Agency
National Programme Business Case - Safer Journeys (Roads & Roadsides)
The National Programme Business Case for Safer Roads and Roadsides identifies the majority of the
SH1 corridor between Puhoi and Whangarei as high-risk roads requiring action over the next 10-year
period (See Section 3.4). This confirms the case for change to improve road safety along the whole of
this PBC corridor, and that this will contribute to reducing deaths and serious injuries.
Network Resilience - National Strategic Case
The Transport Agency is currently preparing a National Resilience Business Case to assist planning
for investment to improve network resilience. This study has identified three key problem areas and
associated benefits, each of which are relevant to SH1:
• Poor highway resilience may impede critical services from providing disaster response and
recovery support.
• Unreliability of some highways affects businesses and undermines economic growth.
NZ TRANSPORT AGENCY
August 2017
86
Whangarei to Auckland – Connecting Northland
• The risky environment of some roads increases the possibility of harm to road users.
The development of the National Resilience Programme Business Case is ongoing. However current
indications are that a preferred programme focus will be to keep the state highway network open or
to ensure that alternative routes are always available. The indication at this stage is that priority will
be given to the national routes and high volume routes. This confirms that resilience (and route
security) issues along SH1 between Auckland (Puhoi) and Whangarei are significant and support the
case for future improvement.
High Productivity Motor Vehicles – National Strategic Case
The Transport Agency has prepared a Strategic Case that outlines the case and context related to
allowing heavy vehicles to operate outside the current mass and dimension limits. Beyond the
Strategic Case, work to develop and assess alternative programmes to achieve the associated
productivity gains is ongoing. The National Strategic Case for HPMV confirms the investment routes
for the 2012-15 period and this includes SH1. Physical works have been undertaken to strengthen
bridges in the corridor, allowing the route to be used by full HPMVs.
One Network Road Classification (ONRC)
The ONRC system classifies all roads into different types of roads. This is based on criteria in
relation to safety, resilience access, traffic volume and other measures. There are also Level of
Service guidelines for how the different types of classification should be performing against the
above criteria. The Transport Agency uses this system to classify all of the state highways in the
country.
As outlined in Figure X below, state highway one in this corridor is classified as a National route for
the entire length of the PBC area, with the section south of Wellsford classified as “High Volume” also
due to the traffic volumes. The National classification is the highest classification in the system and
is defined as:
National: These are roads that make the largest contribution to the social and economic wellbeing of
New Zealand by connecting major population centres, major ports or international airports and have
high volumes of heavy commercial vehicles or general traffic. They must meet the thresholds for 3
criteria, including at least one of the following movement criteria (Typical Daily Traffic, Heavy
Commercial Vehicles or Buses, Urban Peak) and at least one of the economic and social criteria (i.e. 3
in total). To be included in the high volume subset a road must meet one of the high volume criteria
for typical daily traffic or HCVs.
This confirms the strategic importance of this road as a connection between Northland and Auckland.
NZ TRANSPORT AGENCY
August 2017
87
Whangarei to Auckland – Connecting Northland
APPENDIX D –PUBLIC CONSULTATION REPORT
NZ TRANSPORT AGENCY
August 2017
88
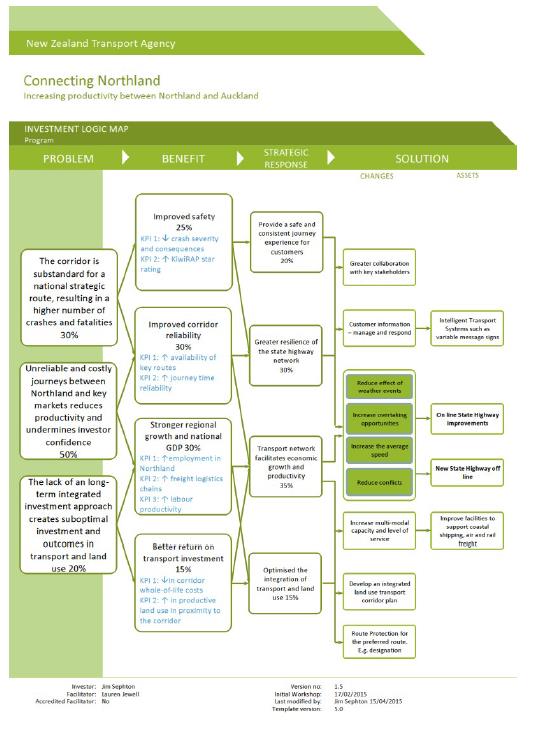
Whangarei to Auckland – Connecting Northland
APPENDIX E – ILM MAP
NZ TRANSPORT AGENCY
August 2017
89
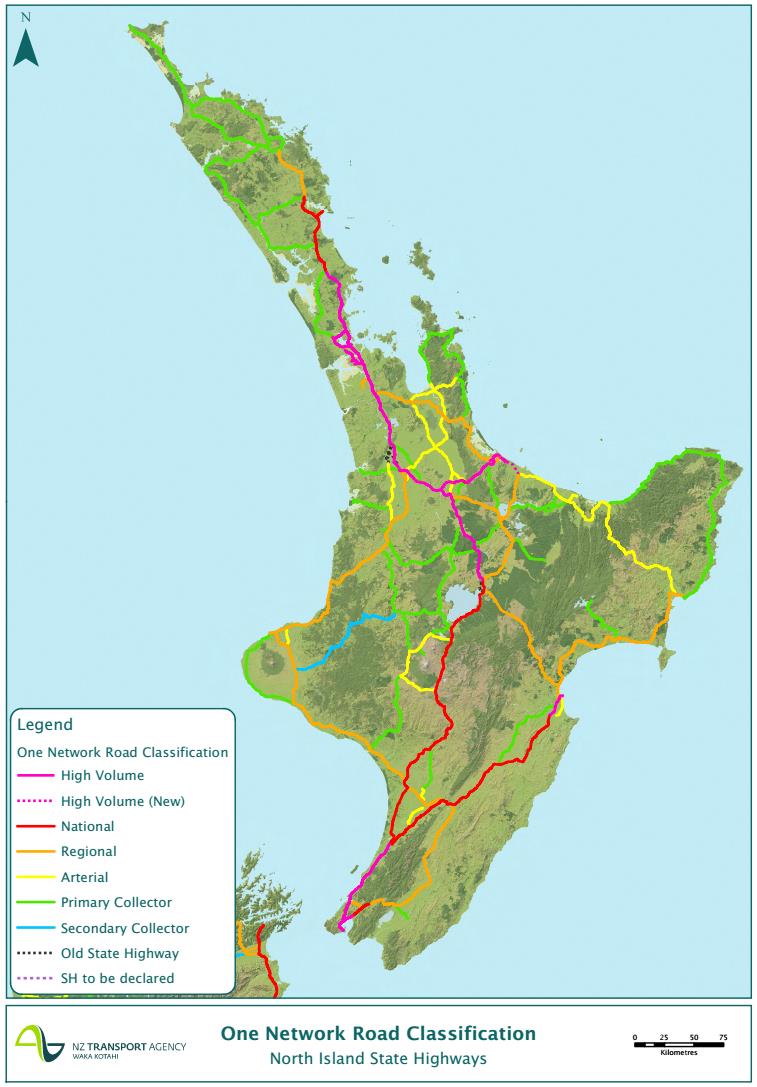
Whangarei to Auckland – Connecting Northland
APPENDIX F –ONE NETWORK ROAD CLASSIFICATION
NZ TRANSPORT AGENCY
August 2017
90
Whangarei to Auckland – Connecting Northland
APPENDIX G – OPTION DEVELOPMENT AND ANALYSIS
NZ TRANSPORT AGENCY
August 2017
91
Whangarei to Auckland – Connecting Northland
APPENDIX H – PROGRAMME ANALYSIS AND ASSESSMENTS
NZ TRANSPORT AGENCY
August 2017
92
Whangarei to Auckland – Connecting Northland
APPENDIX I – IMPLEMENTATION PLAN
Section
Investigation
Implementation
Lead
Support
DBC 2017 –
Determine scope
2019 – Construction
Transport
Inland Freight Route
and scale of
of upgrade
WRC, WDC
Agency
upgrades to the
completed
route
IBC-DBC 2018/19 –
Determine best
2020/2021 –
Transport
Whangarei urban
option for multi-
Construction of
WRC, WDC
Agency
modal solution
upgrade completed
(SH14 to Toetoe)
IBC-DBC 2017/18 –
Determine best
2019/2020 -
Transport
Toetoe to Oakleigh
option, including
Construction of
WRC, WDC
Agency
online
upgrade completed
consideration
IBC-DBC 2018/19 –
2022/2024 -
Oakleigh to SH15
Undertaken with
Construction of
Transport
(including SH15/1
Toetoe to Oakleigh
upgrade completed
WRC, WDC
Agency
intersection)
for best combined
(intersection as
solution to SH15
required)
2026/2027 -
SH15 to Brynderwyn
Transport
DBC 2024/25
Construction of
KDC, WDC
Hills
Agency
upgrade completed
IBC-DBC 2018/19 –
2024/2026-
Determine most
Transport
Brynderwyn Hills
Construction of
KDC
appropriate bypass
Agency
upgrade completed
option
2025/2026 -
Brynderwyn Hills to Te
Transport
IBC-DBC 2023/24
Construction of
KDC, AT
Hana – SHI Alignment
Agency
upgrade completed
Brynderwyn Hills to Te
2020 – Construction
Transport
Hana – Kaiwaka town
IBC-DBC 2018/19
KDC
upgrade completed
Agency
centre
2019/20 –
Brynderwyn Hills to Te
Transport
IBC-DBC 2017/18
Construction upgrade
KDC, AT
Hana – Detour routes
Agency
completed
DBC 2017/18 –
As per current
Te Hana to Warkworth
Transport
Route protection for implementation plans
AT, AC
RONS
Agency
preferred option
for RoNS
DBC 2017 –
2018 – Construction
Te Hana to Warkworth
Transport
Preferred option
of upgrade
AT
Dome Safety
Agency
identification
completed
NZ TRANSPORT AGENCY
August 2017
93
Whangarei to Auckland – Connecting Northland
Section
Investigation
Implementation
Lead
Support
Warkworth to Puhoi
2021 – Complete for
Transport
IBC-DBC 2019/20
AT, AC
Park and Ride
opening of PPP
Agency
Driver education and
enforcement
•
Licence
assistance
Transport
•
Alcohol
2019 – Complete and
Agency,
education
BC - 2017/18
Police
operational
WDC, AT,
programme
KDC
•
Courtesy
shuttles
•
Increased police
enforcement
Wayfinding
•
Tourist signage
AT, AC,
•
Travel time
2019 – Complete and
Transport
AMA, KDC,
signage
BC - 2017/18
operational
Agency
WDC, NRC,
•
VMS detour
WRC
advance
warning
NZ TRANSPORT AGENCY
August 2017
94