________________________________________________________
Religious Affiliation
Variable specification
2018 Census
Log of late changes to variable specifications:
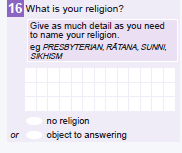
Major change to the question design has been approved (see Section 1.1). The
two questions will be replaced with one question; a write-in free text box for
religion and 2 tick boxes (‘No religion’ and ‘Object to Answering’).
Purpose
Census variable specifications are living documents created during the development phase
of census, up to and including the 2018 Census. They serve as a resource for general
reference, and inform the work of teams working on the census, including field operations,
respondent interaction, questionnaire design, classifications and standards, processing, data
evaluation, and outputs.
These specifications document important information about each census variable in one
place, including metadata such as definitions and classifications, emerging information
needs, data quality problems, and details of how we ensure that good quality data is
produced. Information is added to these variable specifications as it becomes available.
Feedback and analysis of testing may result in changes to these documents.
Decisions on inclusion of this topic/variable
Inclusion
Date
Who
(note important details)
Census Test July
Yes
11/04/16
Denise McGregor
2016
Census Test 2017
Yes
6/10/16
Denise McGregor
2018 Census
Yes – see changes to
30/06/17
Denise McGregor
questionnaire as above
link to page 3 link to page 3 link to page 3 link to page 3 link to page 3 link to page 3 link to page 4 link to page 5 link to page 5 link to page 7 link to page 7 link to page 7 link to page 7 link to page 8 link to page 8 link to page 8 link to page 9 link to page 9 link to page 10 link to page 10 link to page 10 link to page 10 link to page 10 link to page 10 link to page 11 link to page 11 link to page 13 link to page 13 link to page 14 link to page 14 link to page 14 link to page 14 link to page 14 link to page 15
Contents
1.0 Background information ................................................................................................................... 3
1.1 Change indicator ........................................................................................................................... 3
1.2 Census contact people .................................................................................................................. 3
1.3 Other key contact people ............................................................................................................. 3
2.0 Collection and Classification ............................................................................................................. 3
2.1 Definition ...................................................................................................................................... 3
2.2 Where this data comes from ........................................................................................................ 4
2.3 Derivations .................................................................................................................................... 5
2.4 Classifications ................................................................................................................................ 5
2.5 Coding ........................................................................................................................................... 7
3.0 Output ............................................................................................................................................... 7
3.1 Subject population ........................................................................................................................ 7
3.2 Output categories and types of output ........................................................................................ 7
4.0 Data use and emerging information needs ...................................................................................... 8
4.1 Data use by Statistics New Zealand .............................................................................................. 8
4.2 Data use outside of Statistics New Zealand .................................................................................. 8
4.3 Emerging trends and information needs ...................................................................................... 9
4.4 2018 Census content consultation and engagement ................................................................... 9
4.5 Alternative data sources ............................................................................................................. 10
5.0 Data quality ..................................................................................................................................... 10
5.1 Quality priority level ................................................................................................................... 10
5.2 Assessment of overall data quality for 2013............................................................................... 10
5.3 Non-response rate in 2013 ......................................................................................................... 10
5.4 Imputation .................................................................................................................................. 10
5.5 Data quality issues ...................................................................................................................... 11
5.6 Recommendations and suggestions for improving data quality ................................................ 11
5.8 Edits ............................................................................................................................................. 13
5.9 Evaluation checks to be updated for 2018................................................................................ 13
Appendices ............................................................................................................................................ 14
2013 Variable Specification: [link] .................................................................................................... 14
B. 2013 Information by Variable: [link] ............................................................................................. 14
C. 2013 Warrant of Fitness: [link] ..................................................................................................... 14
D. Guide to determining the change indicator rating ....................................................................... 14
E. Link to 2017 Test Analysis Report here ......................................................................................... 15
1.0 Background information
1.1 Change indicator
Major change in the 2018 Census
The question will no longer include any tick box religious groupings, for both level
one groupings within the classification (Christianity, Buddhism, Hinduism), and
Christian-based religions (e.g. Anglican, Catholic etc.). Instead all respondents who
indicate they have a religion will be asked to write in their religion. This may impact
the counts of religious groupings.
Possible impacts from proposed changes to the online question design, relating to
the ‘No Religion’ and ‘Object to Answer’ other fields, autofil and drop down response
options
1.2 Census contact people
Primary – Digby Carter (author of variable specification)
Secondary – Kate Lang
1.3 Other key contact people
Subject matter – Population Stats – Robert Didham
Classifications and Standards – Andrew Hancock
Questionnaire Methodology and Development – Matthew Flanagan
Respondent Interaction: ?
2.0 Collection and Classification
2.1 Definition
Religious Affiliation
Religious affiliation is the self-identified association of a person with a religion, religious
denomination or sub-denominational religious group.
A
religion is a set of beliefs and practices, usually involving acknowledgement of a divine or
higher being or power, by which people order the conduct of their lives both practically and in
a moral sense. Entities that do not meet these criteria but are universally or widely regarded
as religions, are also included.
A
denomination is the church or religious sect that forms a sub-group of a religion.
Denominations of a particular religion share the same principles but differ from each other in
aspects such as the form of worship used and the way in which they are governed.
2.2 Where this data comes from
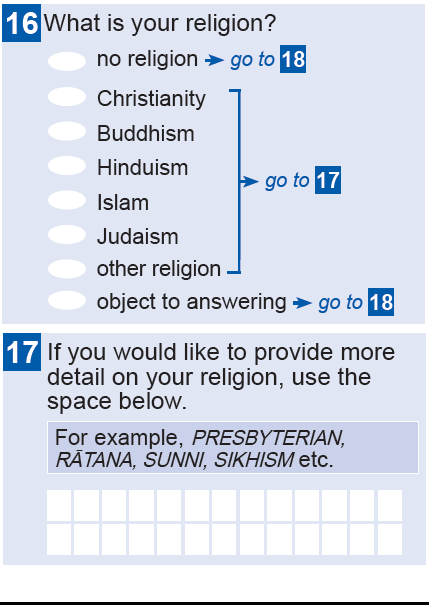
2018 Census Question
2017 Census Test
This data comes from Q16 and 17 on the Individual Form
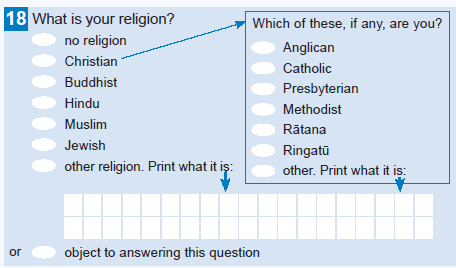
2013 Census Question (for comparison)
2.3 Derivations
2018 Census - Derivation 81 is now incorporated into the new output derivation for
randomisation of multiple responses – TBC (underway)
Census Test 2017
Derivation 81 Sorting of Multiple Responses.
2013 Census
Derivations used in 2013
Derivation
This derivation sorts responses to language, iwi and religion into
Number 81:
ascending numerical order. In addition, any
non-residual values that
Sorting of Multiple
are repeated for any one record are reduced to one occurrence. For
Responses
example, if a respondent ticks English and writes English in the other
Notes Link
box the code for English wil be entered twice in the processing
system but later reduced to one response of English through this
output system derivation.
The residual codes: response unidentifiable, response outside scope,
and not stated wil be retained for each relevant multiple response
question (language, iwi, religion). For example, if a respondent states
two responses that are both coded to unidentifiable, then two output
codes of 'response unidentifiable' wil be output for that person.
Please note that the other residual codes of 'don't know' and
'object/refused to answer' wil not have duplicates i.e. the derivation
wil only retain one of each of these.
2.4 Classifications
The following classifications will be used in the 2018 Census:
RELIGAFF V2.0 – Religious Affiliation 1999
(
Previous censuses: 2013 –
RELIGAFF v1.0; 2006 – same as 2013)
Religious affiliation is a hierarchical classification with three levels. Level one has a one-digit
code structure and has 10 categories. Level two has a three-digit code structure and
contains 51 categories. Level three has a five-digit code structure and contains 167
categories.
The top two levels are shown below:
0
No Religion
000
No Religion
1
Buddhism
101
Buddhism
2
Christian
200
Christian nfd
201
Adventist
202
Anglican
203
Asian Christian
204
Baptist
205
Brethren
206
Catholicism
207
Church of Christ and Associated Churches of Christ
208
Evangelical, Born Again and Fundamentalist
209
Jehovah's Witnesses
210
Latter-day Saints
211
Lutheran
212
Methodist
213
Orthodox
214
Pentecostal
215
Presbyterian, Congregational and Reformed
216
Protestant nfd
217
Salvation Army
218
Uniting/Union Church and Ecumenical
299
Other Christian
3
Hinduism
301
Hinduism
4
Islam
401
Islam
5
Judaism
501
Judaism
6
Māori Religions, Beliefs and Philosophies
600
Māori Religions, Beliefs and Philosophies nfd
601
Ratana
602
Ringatū
609
Other Māori Religions, Beliefs and Philosophies
7
Spiritualism and New Age Religions
700
New Age nfd
701
Church of Scientology
702
Nature and Earth Based Religions
703
Satanism
704
Spiritualist
709
Other New Age Religions
8
Other Religions, Beliefs and Philosophies
800
Other Religions, Beliefs and Philosophies nfd
801
Baha'i
802
Chinese Religions
803
Jainism
804
Japanese Religions
806
Sikhism
807
Theism
808
Zoroastrian
809
Unification Church (Moonist)
810
Jedi
811
Other Religions, Beliefs and Philosophies
9
Residual Categories
944
Don't Know
955
Object to answering
977
Religion Unidentifiable
988
Response Outside Scope
999
Not Stated
Concordance: This is approved for the 2017 test only.
Religious Affiliation 1999 V1.0 to V2.0 – Predominant Concordance for Census V1.0
2.5 Coding
Religion (IF16) – RELIGAFF V2.0
tickbox1 = 00000
tickbox2 = 95555
no response = 99999
3.0 Output
3.1 Subject population
Census Usually Resident Population Count
3.2 Output categories and types of output
Religious affiliation is a hierarchical classification with 190 categories. Level one has a one-
digit code structure and has 10 categories. Level two has a three-digit code structure and
contains 50 categories. Level three has a five-digit code structure and contains 130
categories.
The 2013 categories for Religious Affiliation (Total Response) and Religious Affiliation 1-4 at
the highest level available for output were:
0 No Religion
1 Buddhist
2 Christian
3 Hindu
4 Islam/Muslim
5 Judaism/Jewish
6 Mäori Christian
7 Spiritualism and New Age Religions
8 Other Religions
9 Residual Categories
At this level of the classification (the highest level), 'object to answering' (which is a valid
response) is included in 'residual categories' together with 'don't know', 'religion
unidentifiable', 'response outside scope' and 'not stated'.
Respondents can write-in multiple answers to the religion question. During processing and
coding this is reduced and output up to 4 religions (ie Religious Affiliation 1-4). If more than 4
responses (religag 1-4) then the first written responses will be taken.
Religious Affiliation 1
(The first response given in the Religious Affiliation question on the
2006 Individual Form.)
Religious Affiliation 2
(The second response given in the Religious Affiliation question on
the 2006 Individual Form.)
Religious Affiliation 3
(The third response given in the Religious Affiliation question on
the 2006 Individual Form.)
Religious Affiliation 4
(The fourth response given in the Religious Affiliation question on
the 2006 Individual Form.)
For selecting Religious Affiliation 1-4, a priority rule was used in 2013 (the same in both
2001 and 2006) which fol owed the tick-boxes on the form (with written responses taking
priority over tick boxes first). The 2018 Census question does not include tick boxes for
religions, so this is no longer the case.
4.0 Data use and emerging information needs
4.1 Data use by Statistics New Zealand
2013 Census data on religious affiliation was output as part of the QuickStats information
about culture and identity, and the QuickStats about people aged 65 and over. Output tables
were also available cross-tabulated by geographic areas (regional council, territorial
authorities, district health boards, general and Māori electoral boundaries). Information on
religious affiliation within iwi groupings was available through NZ.Stat.
4.2 Data use outside of Statistics New Zealand
Data on religious affiliation is used
- by researchers and religious organisations to trace the changes in values and belief
systems in New Zealand society
- to assess the need for various types of religion-related or religion-sponsored services,
including those of churches, mosques, temples, and religious schools; and for the care of the
aged and other disadvantaged groups
- by churches to assess their level of support
- as an explanatory variable for studies on subjects such as marriage formation and
dissolution, educational attainment, and income
- by Māori, Pacific peoples, and other
- as part of measuring cultural affiliation in combination with the Ethnicity, Birthplace, Years
since arrival in New Zealand and Languages spoken variables
4.3 Emerging trends and information needs
New Zealand has become increasingly secular and the proportion of respondents who
stated they had ‘No Religion’ increased from 35 to 42 percent between 2006 and 2013. The
proportions of most religious groups also decreased slightly between the two censuses, but
there were slight increases in the proportions of Hindu, Muslim and Buddhist religions stated.
In the 2006 Census, around 20,000 respondents identified their religion as Jedi, and their
responses coded as ‘response outside scope’, but after some public pressure, the
information was released by Statistics New Zealand.
A review of the classification and standard was to take place in 2009 – this was postponed
and indicated as necessary in the 2013 WOF (the last review was done in 1999), but has not
taken place.
A previously identified issue is to investigate is the potential for disaggregation of the no
religion category. The no religion category captures a wide range of synonyms including
atheist and agnostic. The 2018 Census public consultation and engagement indicated a
desire for more information (output) on non-church based religions and belief systems, this is
unlikely to occur without a review of the classification.
A refresh of the classification took place in 2017 and has resulted in the updated
classification being used for the 2018 Census.
4.4 2018 Census content consultation and engagement
In the
Preliminary View of 2018 Census Content the proposed recommendation was to
continue to collect information on religious in the 2018 Census.
There was not a large response to this recommendation overall. Submissions and online
discussion were in favour with inclusion and largely agreed with the reasoning in the
preliminary view that while society is becoming more secular, religious affiliation is still
important to measure. It was also noted that the census is the only major source of data on
religious affiliation.
A number of submitters and online commentators indicated that they would like more access
to more information on non-church based religions and belief systems.
Documentation on content consultation and engagement:
2018 Census content: Summary of feedback from engagement and consultation
2018 Census content: Summary of submissions
Conclusions from engagement:
The need for information output on non-church based religions was assessed through the
content determination framework.
The small user need for information in this area compared to mainstream religious affiliation
(and their significance as a demographic attribute) meant that more detail in this area is
preferable, but not important enough to necessitate a classification review.
The recommendation for this variable was no change other than investigation of options to
improve data quality and collection detail. The 2017 Census Test showed that the question
format was not working well, and the question has been redesigned for 2018.
4.5 Alternative data sources
No sources identified
5.0 Data quality
5.1 Quality priority level
Priority Level 3
These variables/topics are given third priority in terms of quality (accuracy, relevance,
timeliness, consistency, interpretability and accessibility), time and resources across all
phases of census. There are minimum quality standards (eg a quality level is assigned to all
variables: one, two or three).
Priority levels document:
Update to the 'three quality priority levels' in the 2018 Census
5.2 Assessment of overall data quality for 2013
High: fit for use – with minor data quality issues only.
2013 Census variable quality rating scale gives more detail.
5.3 Non-response rate in 2013
6.9% (including substitutes, but excluding not stated responses by those who object to
answering the question)
The non-response rate is complicated by the religion question having an object to answer
category. With object to answer included the rate jumps from 6.9% up to 10.3%. For the
official non response rate (6.9%) the not stated responses in the religion object category
have been removed.
The non-response rate was just in the acceptable range specified in the FFU document (5-
7%)
-Notes Link - so is considered acceptable. When looking at the non-response rate over 5
Year Age Groups [table 5] the numbers mirror the 2006 and 2001 data, just slightly higher
overall. It has the same peak in the 20-24 year age group and begins to increase from the
75-79 age group, however it does peak dramatically in the 100+ year age group which could
be explained by the high number of elderly in rest homes not attempting to answer the
Religion question.
5.4 Imputation
Imputation methods are being investigated, using historic data, deterministic imputation and
donor imputation in CANCEIS.
Link to paper
TAG Imputation for item non-response here.
5.5 Data quality issues
Quality of the data from the 2017 Test led to changes to the design of the 2018 Census
Question, as described in other sections of the specification.
From the
2013 WOF:
For your information/caution:
There were a few hundred records that were affected by the fuzzy scanning problem
(similar to the problem effecting Language) and this may have impacted numbers of
Buddhist nfd, Hindu nfd and Muslim nfd but it is pretty safe to assume that the impacts
would not have made a big difference to the overall increase in these numbers.
The religion_objection_code was added to the Religion classification in 2006. There was
little useful information on this variable provided. Having this extra variable in the
classification is very confusing and made analysis of the Religion variable much more
strenuous than it otherwise would have been. It would make a lot more sense to actually
get rid of the object to answering category in religion 1,2,3 and 4 and include all answers
in religion_objection_code OR the other way round and get rid of the objection code
altogether. It creates confusion and takes a lot more time and effort to get the total actual
Not Stated Counts and the total actual Object to Answering Counts. Because of this
proceed with caution when reviewing the residual responses especially 'Object to
Answering' and 'Not Stated' due to religion_objection_code adding complications.
Cross tabs with Religion and Ethnicity should always be done with the ethnic indicator
variables as this removes multiple responses for Ethnicity
5.6 Recommendations and suggestions for improving data quality
Note that the 2017 question format did not capture detail on religious affiliations and has
been revised for the 2018 Census. See Appendix E for more detail on the 2017 test results.
The recommendations below are from the
2013 WOF:
A review of the Religion classification is necessary before the next census (a review has
not been done since 1999). One of the reasons it needs a review if that the codes and
synonym relationships in the residual categories (unidentifiable and outside scope) are
blurry i.e. 'Free Thinker' could be classified under 'Response Outside Scope', 'Response
Unidentifiable' or 'Other New Age Religions' etc instead of 'No Religion' in which it is
currently under. High counts of nfd religions were also seen, could be worth adding extra
synonyms into the classification.
An urgent look at changing the way object to answering is calculated is needed. It makes
it too complicated to determine the actual objection rate when having to sort out the
counts for object to answering in the total response and religion objection code numbers.
It also makes it difficult to calculate the exact non response rate as objecting to
answering has a non-response rate included in the category also. Is this how output
prefers to view the data? If not then possible changes would be beneficial, maybe to
even revert back to the way it was calculated in 2001. Not sure why it needs its own
category as well as one included in the total response dataset. All objection responses
should either be included along with all the other religions (just put in the residual
category) OR all objection responses to be included in a separate category
(religion_objection_code) NOT both.
Propose an edit where if a respondent ticks 'No Religion' and any other religion, the
response will just be coded as No Religion OR a religion category. This became an issue
as the scanner wasn't sensitive enough to pick up crossed out answers, instead included
all 'marked' responses so this is not respecting respondents intentions. This was
proposed in 2004 but got declined so this decision needs to be reviewed.
In regards to the internet forms, a recommendation is that if a respondent chooses No
Religion, all other response options should be greyed out. This way there isn't an over
inflated count of No Religion responses.
There is a need for improvement in scanning/recognition. This was also mentioned in
2006. The scanner doesn't seem to have enough sensitivity to recognise when a
respondent has crossed out their answer (very obvious scribbles) so therefore in many
multiple responses records, all are included even the crossed out one. This is not
respecting the respondents intentions and was inflating numbers especially in regards to
No Religion, Christian ndf, Anglican, Presbyterian, Catholic ndf categories. A suggestion
to fix this is that when all boxes are ticked, it gets sent to an operator to double check
that it is actually correct.
Another suggestion is to add a derivation for number of religions stated (similar to the
Language variable). This would be beneficial for evaluation purposes and output.
The current situation with online forms is that respondents are able to tick 'No Religion;
and/or 'Object to Answer'. (Object to answer’ means the respondent objects to answering
the question, but giving no religion is an answer, which means we would take that
response as valid to the question. A change where this was no longer allowed could be
considered. This has been implemented for the 2018 Census question.
5.7 Differences between desktop, mobile, and paper forms
Features of desktop and mobile forms that lead respondents to questions relevant to them
The online version wil fol ow the intention of the paper form in that on the Internet the
religious affiliation question will be treated as an 'and' question. This means that when forms
are completed on the Internet, the system wil allow multiple responses to be selected.
However this may not be possible to implement for the 2017 Test and single responses only
wil be accepted. Multiple response to this question is possible when forms are completed
on paper. Respondents wil be able to select 'no religion' and/or 'object to answer' with any
other religion(s) on the Internet form. When the internet data is processed the number of
responses to this question will be limited to four as it is with the paper form.
On the Internet form, if Other Religion is selected, a text box will appear and respondents
can write in the name of the religion (or religions) up to 60 characters. Auto-suggestions will
be used online to assist the respondent with the names of religions from the codefile.
Differences in responding
Note that the question for 2018 does not provide tickboxes for religious groupings as in
2013. Respondents who wish to identify their religion will have to write in their religion in
Question 16.
Link to
Auto suggestion lists for 2018 Census Internet Form
Additional help information on desktop and mobile forms
There is no additional help on the internet forms, but auto-suggestion from the codefiles will
aid the respondent with names and spelling.
Built-in editing on online forms for desktop and/or mobile devices.
If the user deselects the 'other religion' radio button, entered data will be cleared and the text
field removed from view.
For people who stated that they are overseas visitors, this question will be greyed out, and
they wil not be able to answer it unless they change their answer to the previous question.
When form completion is via paper, however, it is possible for overseas visitors to answer
this question
5.8 Edits
2018 Census
None
2013 Census
No edits in 2013.
5.9 Evaluation checks to be updated for 2018
* Note the possible impacts of major question change
Total Response - Religion
Total Response - Religion >5000
Religion by 5 year age groups
Religion by Country of Birth
Religion by Region
Time series comparison 2006, 2013 total response counts
Religion counts as a % of total states response >1%
No Religion by 5 year age groups
Religion (level 1) by Ethnicity (level 1) - Counts & Percentages
Non Response by 5 year age groups
Object to Answering by 5 year age groups
Religion by Response Outside Scope – check the data for large numbers, and if they are a
particular category (e.g. Jedi in 2006).
Auto coding quality checks - Auto & Manual
Check for scanning issues
Check for invalid codes
Appendices
2013 Variable Specification:
[link]
B. 2013 Information by Variable:
[link]
Information by variable is a brief document available on the Statistics New Zealand website
which provides background information such as the definition and classification, along with
information about data quality, and data quality issues to be aware of. It is the first ‘port of
call’ for finding out about data quality issues.
C. 2013 Warrant of Fitness:
[link]
The Warrant of Fitness (WOF) is a report on the final data quality that was achieved for a
variable. It is an internal document that is much more detailed than Information by Variable.
The warrant of fitness is produced at the end of data evaluation. It documents whether the
data looked as expected, data quality issues and corrective actions taken, and makes
recommendations for the following census. Although it is the end document for reporting on
data quality, it also serves as a reference document for developing the next census.
D. Guide to determining the change indicator rating
Minor – minor changes that are not expected to have much effect on the data produced.
Examples of this are minor changes to questionnaire design and/or guide notes/help
information for respondents, minor classification changes that do not have much effect on
what is included in each category, a small number of new codefile entries, minor changes to
the derivation.
Moderate –changes that are expected to have some effect on the data produced. This could
include changes to question wording, layout, or response options that are expected to
change people’s responses; changes in the guide note/help instructions that affect certain
groups of respondents; new classification categories; changes to the codefile entries for
some categories; new edits.
Major – major changes that are expected to affect the data produced eg a change in the type
of information collected which means changes to the question wording; substantial changes
to response options; major changes to guide note/help instructions; a new classification with
multiple changes to categories and what they include; a new codefile; significant changes to
the derivation.
E. Link to 2017 Test Analysis Report
here