 KOROKORO, WOOLLEN MILLS AND
BIRCHVILLE DAMS
SAFETY REVIEW
KOROKORO, WOOLLEN MILLS AND
BIRCHVILLE DAMS
SAFETY REVIEW
March 2013
Greater Wellington Regional Council (Parks)
Revision 0 for Client Comment

Greater Wel ington Regional Council (Parks)
Korokoro, Woollen Mills and Birchville Dams Safety Review 2013
Mar-13
EXECUTIVE SUMMARY
This safety review is an independent engineering review of the safety of Korokoro, Wool en Mil s
and Birchvil e dams relative to current practice. It is the second safety review carried out for these
dams and is based on a review of available documentation, site visits and discussions with Greater
Wellington Regional Council staff. The first safety review was in 2006 and this report fits within
the recommended 10-yearly frequency for such reviews. The safety review has been carried out in
accordance with the New Zealand Society on Large Dams (NZSOLD) Dam Safety Guidelines
requirements for safety review of Low potential impact category (PIC) dams.
Korokoro and Wool en Mil s dams are located in Belmont Regional Park near Petone and were
constructed in 1903. Birchvil e Dam is located in Akatarawa Forest near Upper Hutt and was
constructed in 1930. The three dams were previously used for municipal water supply but now
have public amenity and recreation as their primary use. The dams remain operational in the
sense that they continue to impound their reservoirs.
Key dam safety status conclusions and recommendations are presented for each of the dams as
fol ows;
Korokoro Dam
The dam is performing wel except for significant seepage at the toe near to the spil way. It
appears that the rate of seepage has increased with time and may be suggestive of erosion of the
dam’s foundation. Whilst this would likely not deteriorate rapidly nor lead to a rapid failure, a
recommendation has been made to undertake regular monitoring of the seepage rate to
characterise its behaviour with time and serve as an early warning of foundation piping.
There are no indications of gross movement of the dam or signs of instability in the foundation
and abutments.
Whilst the dam has obviously been overtopped on a regular basis it has performed wel . The most
significant erosion is of what was either placed fil or natural ground against the downstream face
of the dam. A recommendation has been made to monitor this and if undermining occurs then
remediation wil be required. In the meantime it is beneficial to see and measure the seepage that
is emerging at this location.
The dam meets acceptability criteria for stability under all loading conditions.
There are no indications of any of the dam’s failure modes developing, although better
understanding of the toe seepage is required to confirm that this is not related to foundation
piping.
Korokoro Dam has a low likelihood of failure and the best and most appropriate risk management
is to perform regular routine surveil ance inspections including the monitoring of key features, i.e.
toe seepage and erosion. The value of this is significantly improved by keeping vegetation short on
the toe and downstream abutment contacts.
Local capture and regular measurement of the seepage quantity at the dam toe (near to the
spil way) and adjacent to the spil way plunge pool (dam ‘total’ seepage) wil be highly beneficial to
ongoing surveil ance of the dam and should be implemented as a priority. Woollen Mills Dam
The dam is performing wel except for major erosion beneath and at the toe of the spillway. This
appears to have been initiated by rock-fal damage to the spil way chute and subsequent
undermining by normal and flood flows. The extent of undermining has worsened significantly
over the last six years and if it continues wil eventual y lead to the dam’s integrity being
compromised through removal of base and toe support. A recommendation has been made to
Damwatch Services Ltd
i
Job S1237 – Revision 0 for Client Comment March 2013
Greater Wel ington Regional Council (Parks)
Korokoro, Woollen Mills and Birchville Dams Safety Review 2013
Mar-13
undertake regular monitoring of the extent of undermining in the short team and remediation
should be planned for in the near future.
There are no indications of gross movement of the dam or signs of other instability in the
foundation and abutments.
The dam meets acceptability criteria for stability under all loading conditions.
There are currently no indications of any of the dam’s failure modes developing, however
continued spil way undermining wil eventual y lead to dam failure through loss of base or toe
support.
Woollen Mills Dam has a low to moderate likelihood of failure due to the worsening condition of
the spil way. The most immediate risk management is to perform regular routine surveil ance
inspections including the monitoring of its key feature, i.e. spillway toe erosion. Remediation of the
spil way and its toe wil return the dam to its intended function and reduce the likelihood of failure
to low. This should be done as a matter of priority. Birchville Dam
The dam is performing very wel with no indication of stress within the dam or its abutments.
There is no discernible leakage or seepage, although the toe is covered with large riprap meaning
that seepage in this area would not be visible. A recommendation has been made to undertake
regular monitoring of the abutments, with particular attention to the left abutment to ensure that
there are no indications of instability.
There are no indications of gross movement of the dam or signs of other instability in the
foundation and abutments.
The dam meets acceptability criteria for stability under al loading conditions using basic analysis
methods. A more complex analysis is not necessary or warranted given the dam’s Low PIC and
good performance over eighty three years.
There are currently no indications of any of the dam’s failure modes developing, however ongoing
monitoring of its abutments is important.
Birchville Dam has a low likelihood of failure. The best and most appropriate risk management is
to perform regular routine surveil ance inspections including the monitoring of key features, i.e. the
left and right abutments.
Greater Wellington Regional Council dam safety activities
Greater Wel ington Regional Council (GWRC) has ongoing dam safety activities for Korokoro,
Woollen Mills and Birchville dams. Importantly, these include monthly routine inspections by
maintenance rangers that have been trained in dam safety and surveil ance. Routine dam safety
inspections, in conjunction with appropriate technical support and review, are widely known to be
the most effective method for monitoring dam safety.
Fundamental y, GWRC’s dam safety activities include the items recommended in the NZSOLD
guidelines and are being completed at the recommended, or in some cases greater, frequency.
Due to the impending regulations for the NZ Dam Safety Scheme,
from July 2014 GWRC wil need
to review the dam potential impact categories (PIC’s) in accordance with the new Building Act
methodology. If Medium PIC’s are determined (currently Low), the current dam safety programme
wil require alignment with the dam safety assurance programme (DSAP) format specified in the
regulations.
Damwatch Services Ltd
i
Job S1237 – Revision 0 for Client Comment March 2013
Greater Wel ington Regional Council (Parks)
Korokoro, Woollen Mills and Birchville Dams Safety Review 2013
Mar-13
Recommendations
The fol owing table is a summary of recommendations made in this report, per dam and generic to
GWRC’s dam safety activities;
Recommendation
Report Timeframe
ref.
to address
Korokoro Dam
Clearing the vegetation on the downstream face, toe and abutment
5.2.2
2-3 months
contacts, and drainage of the toe, will vastly improve ability to perform
regular visual inspection.
Local capture and regular measurement of the seepage quantity at the
5.2.2
2-3 months
dam toe (near to the spil way) and adjacent to the spil way plunge pool
(dam ‘total’ seepage) wil be highly beneficial to ongoing surveil ance of the
dam and should be implemented as a priority.
The downstream toe should be monitored during and after flood events
5.2.2
During and
and if undermining of the toe develops, remediation wil be required. In the
after floods
meantime it should remain uncovered so that toe seepage can be observed
and measured.
Woollen Mills Dam
Clearing the vegetation on the toe and abutment contacts will vastly
5.3.2
2-3 months
improve ability to perform regular visual inspection.
The spil way toe undermining has worsened in the last six years and wil
5.3.2
Remediate
need to be remediated before erosion removes material supporting the
in next 12
dam resulting in dam failure. In the meantime the extent of undermining
months
should be regularly monitored, particularly after significant rainfal events.
Birchville Dam
Clearing a 2m vegetation buffer on the dam to abutment contacts will
5.4.2
2-3 months
vastly improve ability to perform regular visual inspection.
It is important to inspect the downstream abutments for any signs of deep-
5.4.2
Monthly
seated instability or seepage, with particular attention to the left
during
abutment. Surface weathering is not an issue.
routines
It would be valuable to conduct a basic bathymetric survey of the reservoir
5.4.2
1-2 years
using depth sounding from a boat. A significant increase in the depth of
&
sediment against the arch dam would warrant a check of the sediment
6.3.2
load and arch dam thrust loads.
It would be beneficial to lower the storage level temporarily to allow
5.4.2
1-2 years
removal of the weed and moss, which in turn would al ow a visual
inspection of the downstream face concrete.
GWRC dam safety activities
Due to the impending regulations for the NZ Dam Safety Scheme,
from July 1.3.2
2 years
2014 GWRC wil need to review the dam potential impact categories (PIC’s)
&
in accordance with the new Building Act methodology. If Medium PIC’s are 6.4.2
determined (currently Low), the current dam safety programme wil require
alignment with the dam safety assurance programme (DSAP) format
specified in the regulations.
It would be beneficial to perform special surveillance inspections of all 6.1.1
During and
GWRC (Parks) dams during and after flood events to establish a
after floods
documented record of the dams’ performance under flood conditions.
Depth of water over the dam crest supported by photography and video
footage wil be particularly beneficial.
Damwatch Services Ltd
i i
Job S1237 – Revision 0 for Client Comment March 2013
link to page 7 link to page 7 link to page 8 link to page 8 link to page 8 link to page 10 link to page 10 link to page 11 link to page 13 link to page 13 link to page 13 link to page 13 link to page 13 link to page 15 link to page 15 link to page 15 link to page 16 link to page 16 link to page 18 link to page 18 link to page 18 link to page 20 link to page 21 link to page 23 link to page 23 link to page 23 link to page 25 link to page 27 link to page 29 link to page 30 link to page 30 link to page 30 link to page 31 link to page 32 link to page 33 link to page 34 link to page 37 link to page 49
Greater Wel ington Regional Council (Parks)
Korokoro, Woollen Mills and Birchville Dams Safety Review 2013
Mar-13
TABLE OF CONTENTS
1
INTRODUCTION ....................................................................................................... 2
1.1
Background.............................................................................................................. 2
1.2
Review scope ........................................................................................................... 3
1.3
Context of this report ................................................................................................ 3
1.4
Industry practice ...................................................................................................... 3
2
POTENTIAL IMPACT CATEGORY (PIC) REVIEW ............................................................. 5
2.1
Classification Systems ............................................................................................... 5
2.2
Korokoro, Woollen Mills and Birchville PIC’s ................................................................ 6
3
DAM DETAILS .......................................................................................................... 8
3.1
General ................................................................................................................... 8
3.2
Korokoro Dam .......................................................................................................... 8
3.3
Woollen Mills Dam ................................................................................................... 8
3.4
Birchville Dam .......................................................................................................... 8
4
FAILURE MODES DETERMINATION .......................................................................... 10
4.1
General ................................................................................................................. 10
4.2
Korokoro Dam ........................................................................................................ 10
4.3
Woollen Mills Dam ................................................................................................. 11
4.4
Birchville Dam ........................................................................................................ 11
5
INSPECTION FINDINGS ............................................................................................ 13
5.1
Safety Review Team ................................................................................................ 13
5.2
Korokoro Dam ........................................................................................................ 13
5.3
Woollen Mills Dam ................................................................................................. 15
5.4
Birchville Dam ........................................................................................................ 16
6
ASSESSMENT WITH RESPECT TO CURRENT ACCEPTIBILITY CRITERIA FOR LOW PIC DAMS .
............................................................................................................................. 18
6.1
Korokoro Dam ........................................................................................................ 18
6.2
Woollen Mills Dam ................................................................................................. 20
6.3
Birchville Dam ........................................................................................................ 22
6.4
Dam Safety Programme .......................................................................................... 24
7
DAM SAFETY STATUS.............................................................................................. 25
7.1
General ................................................................................................................. 25
7.2
Korokoro Dam ........................................................................................................ 25
7.3
Woollen Mills Dam ................................................................................................. 26
7.4
Birchville Dam ........................................................................................................ 27
8
REFERENCES .......................................................................................................... 28
APPENDIX A: DRAWINGS
APPENDIX B: PHOTOS FROM 2012 SAFETY REVIEW SITE INSPECTIONS
APPENDIX C: ROUTINE INSPECTION CHECKLISTS
Damwatch Services Ltd
Job S1237 – Revision 0 for Client Comment March 2013
1
Greater Wel ington Regional Council (Parks)
Korokoro, Woollen Mills and Birchville Dams Safety Review 2013
Mar-13
1
INTRODUCTION
1.1 Background
Damwatch has been engaged by Greater Wellington Regional Council (Parks) to perform the 2013
Safety Review of Korokoro, Wool en Mil s and Birchvil e dams.
Korokoro and Wool en Mil s dams are located in Belmont Regional Park near Petone and were
constructed in 1903. Birchville Dam is located in Akatarawa Forest near Upper Hutt and was
constructed in 1930. The three dams were previously used for municipal water supply but now
have public amenity and recreation as their primary use. The dams remain operational in the
sense that they continue to impound their reservoirs.
The purpose of this Safety Review is to provide an independent assessment of the dams’ safety
status relative to current practice. The Safety Review has been carried out in accordance with the
New Zealand Society on Large Dams (NZSOLD) Dam Safety Guidelines (NZSOLD, 2000).
This is the second Safety Review for Korokoro, Woollen Mills and Birchville dams following the
NZSOLD Guidelines. The first Safety Review was carried out in 2006 (Damwatch, 2006) and is used
as reference point in assessing the current condition, performance and dam safety status of the
three dams.
The Safety Review dam inspections were made on 10th of December 2012. No testing of dam
valves was carried out however none of these is considered to be dam safety critical plant.
Safety Review Team
The Safety Review team comprised:
Dan Forster
Lead Examiner and Author
Senior Dam Safety Engineer,
Damwatch Services Ltd.
Andrew Balme
Support Examiner and Author
Dam Safety Engineer,
Damwatch Services Ltd.
Bronek Kazmierow, Principal Ranger, Assets and Maintenance, Parks, Greater Wel ington Regional
Council (GWRC) is the client for the project. During the site inspections the review team was also
assisted by:
Lawrence Silas
GWRC (Maintenance Ranger)
Chris Sanders
GWRC (Maintenance Ranger)
Bryn Menzies
GWRC (Maintenance Ranger)
Joel Revil
GWRC (Maintenance Ranger)
James Craig
GWRC (Engineering Technician)
Jeremy Patterson (Belmont Regional Park Ranger) and Joanne Hunwick (Assets Coordinator) were
unable to attend the site inspections however attended the dam safety awareness training the
fol owing day and provided valuable input.
The Safety Review team grateful y acknowledges the helpful and efficient assistance given by
Greater Wellington Regional Council personnel.
Damwatch Services Ltd
Job S1237 – Revision 0 for Client Comment March 2013
2
Greater Wel ington Regional Council (Parks)
Korokoro, Woollen Mills and Birchville Dams Safety Review 2013
Mar-13
1.2 Review scope
The activities involved in this Safety Review are:
Visual inspection of the dam and associated hydraulic structures.
Assessment of the construction, design, monitoring, physical condition and maintenance of
the structures with reference to current acceptability criteria.
Review and update the likelihood of failure for each dam.
Review and update the Potential Impact Category (PIC) for each dam.
Develop routine inspection checklists for each dam.
Preparation of a report.
No significant new calculation or studies are carried out in this Safety Review. References have
been made to existing documentation, records and any work carried out since the last Safety
Review in 2006.
Internal inspections of intake towers and outlet conduits were not part of the Safety Review brief.
1.3 Context of this report
1.3.1
Building regulations
The Building Act (2004) introduced a draft regulatory framework for dam safety, where previously
dam owners had self-regulated dam safety practices. The regulatory framework for dams is set
out in the Dam Safety Scheme of the Building Act. Formal regulations that will allow the Dam
Safety Scheme to operate are expected to become mandatory on 1 July 2014.
The Building Act Dam Safety Scheme requires all dam owners to have a Potential Impact
Classification (PIC) for each dam over 3 m high and 20,000m³ stored volume (Government is
currently considering introduction of a higher threshold), prepared in accordance with the Building
Act’s classification methodology. The PIC identifies the impacts of failure of the dam in terms of
population at risk and damage to environment and property. The Building Act has introduced a
new methodology for determining PIC which wil become compulsory on 1 July 2014. A Medium
or High PIC dam is required by the Building Act to have a dam safety assurance programme (DSAP)
for safe management of the dam. The DSAP wil include routine and periodic activities including
monitoring, gate testing, O&M plans and safety review timetables. Emergency action plans (EAP)
are part of the DSAP. A Low PIC dam is not required by regulation to have a DSAP or EAP.
1.3.2
Greater Wel ington Regional Council dam safety activities
Greater Wellington Regional Council has ongoing dam safety activities in place for the Korokoro,
Woollen Mills and Birchville dams. These activities are aligned to NZSOLD dam safety guideline
requirement for dams with Low PIC (refer to Section 6.4).
From 1 July 2014, GWRC will need to formal y review the dam PIC’s in accordance with the new
Building Act methodology. If Medium PIC’s are determined, the current dam safety program wil
require alignment with the DSAP format specified in the Regulations. The Regulations require the
PIC assessment to be authorised by a Recognised Engineer.
1.4 Industry practice
Dam safety practice in New Zealand follows the NZSOLD Dam Safety Guidelines (NZSOLD, 2000).
Where the NZSOLD Guidelines do not provide detail, international dam design guidelines are
available. Typical y reference is made to dam guidelines from the International Commission on
Large Dams (ICOLD), USA, Canada and Australia.
Damwatch Services Ltd
Job S1237 – Revision 0 for Client Comment March 2013
3
Greater Wel ington Regional Council (Parks)
Korokoro, Woollen Mills and Birchville Dams Safety Review 2013
Mar-13
Seismic hazard data is provided by GNS Science using a model that is based on internationally
accepted techniques. GNS has recently completed a comprehensive assessment of the Wellington
Fault, the closest active fault to the three GWRC dams. GNS has also been closely involved in
assessing information from the Canterbury earthquakes and has just recently updated its national
seismic hazard model in light of new information. This is discussed further in Section 6 stability
assessments.
Damwatch Services Ltd
Job S1237 – Revision 0 for Client Comment March 2013
4
link to page 10 link to page 10 link to page 11
Greater Wel ington Regional Council (Parks)
Korokoro, Woollen Mills and Birchville Dams Safety Review 2013
Mar-13
2
POTENTIAL IMPACT CATEGORY (PIC) REVIEW
2.1 Classification Systems
2.1.1
NZSOLD Guidelines
Under NZSOLD Dam Safety Guidelines (NZSOLD, 2000) the Potential Impact Category (PIC) is
assessed based of the incremental impact (consequences) of a dam failure using the worst of
sunny day and flood dambreak scenarios. The incremental consequences considered are people
(life), economic losses and environment. The PIC for dams in terms of failure consequences are
presented in
Table 2-1.
Table 2-1 PIC for Dams in terms of Failure Consequences (NZSOLD, 2000)
Potential Incremental Consequences of Failure
Potential Impact
Category
Life
Socio-economic, Financial,
& Environmental
High
Fatalities
Catastrophic damages
Medium
A few fatalities are possible
Major damages
Low
No fatalities expected
Moderate damages
Very Low
No fatalities
Minimal damages beyond owner’s property
2.1.2
Building Act
In 2014 the Dam Safety Scheme of the Building Act (Department of Building and Housing, 2008)
will introduce a PIC classification methodology that considers population at risk rather than
expected fatalities. Population at risk (PAR) will be defined as “
the number of people likely to be
affected by inundation greater than 0.5 metres in depth if they took no action to evacuate”.
As for the NZSOLD guidelines, the Building Act methodology will also consider the incremental
impact of a dam failure on property and environment for the worst of sunny day and flood
scenarios. The methodology is summarised i
n Table 2-2 and
Table 2-3.
Table 2-2 Determination of Assessed Damage Level (Department of Building and Housing, 2008)
SPECIFIED CATEGORIES
DAMAGE
Critical or Major Infrastructure2
LEVEL
Residential
Natural
Community
Houses1
Damage
Time to Restore
Environment
Recovery Time
to operation3
Catastrophic
More than 50
Extensive and
More than one year
Extensive and
Many years
houses destroyed
widespread
widespread
destruction of and
damage
damage to several
major infrastructure
components
Major
4 to 49 houses
Extensive destruction
Up to 12 months
Heavy damage
Years
destroyed and a
of and damage to
and costly
number of houses
more than one major
restoration
damaged
infrastructure
component
Moderate
1 to 3 houses
Significant damage to
Up to 3 months
Significant but
Months
destroyed and
at least one major
recoverable
some damaged
infrastructure
damage
component
Minimal
Minor damage
Minor damage to
Up to one week
Short-term
Days to weeks
major infrastructure
damage
components
Notes:
1. In relation to residential houses, destroyed means rendered inhabitable.
2. Includes:
Damwatch Services Ltd
Job S1237 – Revision 0 for Client Comment March 2013
5
Greater Wel ington Regional Council (Parks)
Korokoro, Woollen Mills and Birchville Dams Safety Review 2013
Mar-13
(a) lifelines (power supply, water supply, gas supply, transportation systems, wastewater treatment,
telecommunications (network mains and nodes rather than local connections)), and
(b) emergency facilities (hospitals, police, fire services), and
(c) large industrial, commercial or community facilities, the loss of which would have a significant impact on the
community, and
(d) the dam if the service the dam provides is critical to the community and that service cannot be provided by
alternative means.
3. Estimated time required to repair the damage sufficiently to return the critical and major infrastructure to normal
operation.
Table 2-3 Determination of Potential Impact Classification (PIC) (Department of Building and Housing, 2008)
ASSESSED
POPULATION AT RISK (PAR)
DAMAGE LEVEL 0
1 to 10
11 to 100
More than 100
Catastrophic
High
High
High
High
Major
Medium
Medium/High
High
High
(see note 4)
Moderate
Low
Low/Medium/High
Medium/High
Medium/High
(see notes 3 & 4)
(see note 4)
(see notes 2 & 4)
Minimal
Low
Low/Medium/High
Low/Medium/High
Low/Medium/High
(see notes 1, 3 & 4)
(see notes 1, 3 & 4)
(see notes 1, 3 & 4)
Notes:
1. With a PAR of five or more people, it is unlikely that the PIC wil be Low.
2. With a PAR of more than 100 people, it is unlikely that the PIC wil be Medium.
3. Use a Medium PIC if it is highly likely that a life wil be lost.
4. Use a High PIC if it is highly likely that 2 or more lives wil be lost.
2.2 Korokoro, Woollen Mills and Birchville PIC’s
2.2.1
2006 determination
The last assessment (Damwatch, 2006) determined a Low PIC for all three dams on the basis of
moderate damages (socio-economic, financial and environmental), population at risk of less than 5
and no fatalities expected.
Both sunny day and incremental flood dam-break scenarios were assessed in detail and the PIC
was determined using both classification systems described above. Both systems resulted in the
same PIC.
2.2.2
Review in 2013
Since 2006 there is nothing to warrant changing the assumed dam-break characteristics, nor has
there been an appreciable change to the downstream channel or population at risk. The
population considered most at risk remains itinerant recreational walkers or cyclists on the tracks
adjacent to the streams downstream of each dam. Under flood conditions it is unlikely that
walkers or cyclists wil be using the tracks so the governing case is sunny day failure.
The fol owing reasoning and conclusions are supported by dam-break modelling undertaken in the
2006 PIC assessment (Damwatch, 2006).
Under sunny day condition the time factored number of itinerant walkers and cyclists can be
estimated as a population at risk (PAR) of less than 5. This is to say that
on average during daylight
hours it is unlikely that at a given time there wil be more than 5 people downstream of the dam in
question. Remembering that the definition of PAR is “
the number of people likely to be affected by
inundation greater than 0.5 metres in depth if they took no action to evacuate” it is important to
consider the likely downstream track inundation depths for each dam-break and whether or not
walkers or cyclists would have sufficient warning and ability to evacuate.
Damwatch Services Ltd
Job S1237 – Revision 0 for Client Comment March 2013
6
link to page 10 link to page 11
Greater Wel ington Regional Council (Parks)
Korokoro, Woollen Mills and Birchville Dams Safety Review 2013
Mar-13
In the case of al three dams the duration of sunny day dam-break flood would be very short due
to the smal volume of stored contents, i.e. in the order of minutes to an hour. On this basis the
exposure to itinerant downstream persons is very low on a time weighted basis. Regarding dam-
break flood inundation depth; the track below Korokoro and Woollen Mills dams is relatively
elevated above the stream channel and general y dam-break flows wil be contained within the
stream channel. In comparison the track below Birchvil e dam is relatively close in height to the
stream and in some areas the track would be inundated by up to 1m in a sunny day dam-break.
However as mentioned above the released volume of water would be relatively smal and the
breach flood would pass in a matter of minutes. Whilst the val ey is generally narrow and steep
sided meaning that total evacuation would be difficult, there are a number of options to relocate
above dam-break inundation levels including trees and local high points in the track.
Further downstream of all three dams there is no residential or industrial population at risk under
sunny day or incremental rainy day dam-break scenarios. The respective streams exit into the
Hutt River (Birchville dam) and the Wellington Harbour (Korokoro and Woollen Mills dams) shortly
after emerging from the bushland.
Therefore we conclude that
(in the terminology of the Dam Safety Scheme) it is not highly likely
that a life will be lost at Korokoro, Woollen Mills and Birchville dam sunny day dambreak
scen
arios, nor for incremental flood rainy day scenarios.
From Table 2-2 the assessed level of damage for al three dams would be Moderate with the
dominant factor being environmental damage that would take in the order of months to recover.
Furthermore, this damage would be no worse than would occur during an infrequent natural flood
in the valley.
In conclusion, using Table 2-3 with a Moderate level of damage and PAR of 1 to 10 (and less than
5),
the PIC determination for Korokoro, Woollen Mil s and Birchvil e dams remains as Low (Building
Act methodology). The same PIC is determined using the existing NZSOLD methodology (refer
Table 2-1), with Moderate level of damage and no expected fatalities.
It is useful to test the sensitivity of these determinations by considering what condition would
result in a Medium PIC. Effectively this would be if PAR was assessed to be 5 or greater or if there
was one fatality expected. At present this is considered to be unlikely, however it is something
that should be reviewed in subsequent years as the tracks downstream of the dams become more
popular with walkers and cyclists.
Damwatch Services Ltd
Job S1237 – Revision 0 for Client Comment March 2013
7
Greater Wel ington Regional Council (Parks)
Korokoro, Woollen Mills and Birchville Dams Safety Review 2013
Mar-13
3
DAM DETAILS
3.1 General
There is limited design and construction information available for the three dams; particularly
Korokoro and Woollen Mills given the year of construction. GWRC has endeavoured to search
historic archives for useful reports and drawings, and thus this safety review is undertaken using
the best available existing information. Basic drawings only exist for Korokoro and Birchvil e dams
and are provided in Appendix A.
3.2 Korokoro Dam
Korokoro Dam is an 8m high concrete gravity dam on the Korokoro Stream located in the Belmont
Regional Park, approximately 4 km upstream of Cornish St in Petone. The dam was built in 1903 to
provide high pressure water supply for fire-fighting in Petone and was the first dam of its type to
be built in New Zealand. The dam has a 37m crest length and incorporates a free overflow
stepped spil way at its contact with the right abutment.
The local geology is general y anticipated to comprise sandstone-mudstone sequences of the
Rakaia terrain, often referred to under the informal name ‘Wel ington Greywacke’ (Damwatch,
2006).
The impounded reservoir has significant accumulation of soft sediment such that the active clear
water storage is of the order of half a metre deep. The reservoir has also reduced significantly in
surface area as the upstream extent has advanced downstream again through sedimentation. The
total original Korokoro reservoir volume is estimated to be 30,000 m³, but today only 2,500 m³
would likely be released in a sunny day failure. This is a conservative estimate based on the
present water storage depth and expected behaviour of the deposited sediment (Damwatch,
2006).
3.3 Woollen Mills Dam
Woollen Mills Dam is a 6m high concrete gravity dam on the Korokoro Stream, approximately
2.5km downstream of Korokoro Dam, within Belmont Regional Park. The dam was built in the
same year as Korokoro Dam (1903) as part of a compensation package to the Petone Wool en
Mil s who had previously col ected water in the lower reaches of the Korokoro Stream utilising a
timber dam. The dam has a crest length of approximately 16m and incorporates a free overflow
spil way at its contact with the right abutment.
The local geology is general y anticipated to comprise the same sandstone-mudstone sequences as
Korokoro Dam often referred to under the informal name ‘Wel ington Greywacke’ (Damwatch,
2006).
The impounded reservoir has significant accumulation of gravel sediment such that active clear
water storage is almost non-existent. The original Wool en Mil s reservoir storage was estimated
as 3,000 m³, but today only 600 m³ would likely be released in a sunny day failure. This is a
conservative estimate based on the present water storage depth and expected behaviour of the
deposited gravels (Damwatch, 2006).
3.4 Birchville Dam
Birchville Dam is a 15m high single curvature arch dam on Clarke Stream, which is a west bank
tributary of the Hutt River at Birchvil e. The dam was built as part of Upper Hutt’s water supply in
1930. The dam has a constant radius of 27.5m and a crest (chord) length of 40m (arch length
46m). Whilst the dam is 15m high above its lowest foundation the use of boulders at the toe for
spil protection give the appearance of a lower dam height.
Damwatch Services Ltd
Job S1237 – Revision 0 for Client Comment March 2013
8
Greater Wel ington Regional Council (Parks)
Korokoro, Woollen Mills and Birchville Dams Safety Review 2013
Mar-13
The local geology is general y anticipated to comprise sandstone-mudstone sequences of the
Rakaia terrain, often referred to under the informal name ‘Wel ington Greywacke’ (Damwatch,
2006).
The impounded reservoir is partially silted with 1988 measurements showing silt levels 6.3m
below the spil way crest. The Birchvil e reservoir storage volume was estimated to be 20,000 m³ in
1989 and today fol owing continued deposition of sediment it is estimated that 10,000 m³ would
likely be released in a sunny day failure of the dam (Damwatch, 2006).
Damwatch Services Ltd
Job S1237 – Revision 0 for Client Comment March 2013
9
Greater Wel ington Regional Council (Parks)
Korokoro, Woollen Mills and Birchville Dams Safety Review 2013
Mar-13
4
FAILURE MODES DETERMINATION
4.1 General
The understanding of a dam’s credible failure modes provides the basis for comprehensive
assessment of its ongoing safe performance. Damwatch has applied this methodology for a
number of years and it is now recommended in a number of jurisdictions. Failure modes are the
most likely credible ways that a dam wil fail, if it was to fail, and therefore do not imply that
failure is imminent by any of the defined modes. Understanding a dam’s failure modes al ows
operation, surveil ance and maintenance activities to be targeted directly at the areas of key
importance and thus provide best prevention, or at worst, early detection of the initiation of a
dam failure mechanism. The same applies to safety reviews of dams in ensuring that issues
relevant to the safety of the dam are not overlooked.
Korokoro, Wool en Mil s and Birchvil e dams have not had failure modes formal y developed as an
independent exercise that reviews al historical information on the subject dam and forms a
collective judgment of its credible failure modes. For the purpose of this safety review we have
carried out a preliminary determination as an aid to describing issues relevant to the dams. We
consider this level of assessment appropriate given that the dams are Low PIC and there is limited
design and construction information available.
4.2 Korokoro Dam
4.2.1
Failure modes
The fol owing credible failure modes have been determined for Korokoro Dam;
FM1: Flood overtopping leading to dam instability and/or undermining
FM2: Piping failure in the dam foundation under normal loading
FM3: Earthquake leading to significant structural damage
This determination is based on the following influencing factors;
• Korokoro Dam is a concrete gravity dam with no foundation relief drains and no uplift
instruments (typical for its era), meaning that the potential for instability is increased
where reservoir head is transmitted to the base of the dam.
• The spil way is sized for an annual flood (approx.) meaning that the dam is regularly
overtopped. There is evidence of erosion at the toe of the dam.
• There is a significant seep emerging at the downstream toe adjacent to the spil way,
indicating foundation piping erosion as a possible causal mechanism.
• Korokoro Dam is located very close to the Wel ington Fault meaning that in a seismic
event, earthquake shaking loads will be very high.
4.2.2
Surveil ance
Regular visual inspection and measurement of any seepage or leakage are the best forms of early
detection of these failure modes. The key performance indicators are;
• Toe erosion
(FM1)
• Increasing and/or turbid (muddy) leakage
(FM2)
• Earthquake damage
(FM3)
Special inspections during and after floods and after earthquakes are also important given the
unusual load condition. Inspections should include observation of flood overtopping flow paths,
erosion/undermining, structural damage, unusual seepage and reservoir rim instability.
Damwatch Services Ltd
Job S1237 – Revision 0 for Client Comment March 2013
10
Greater Wel ington Regional Council (Parks)
Korokoro, Woollen Mills and Birchville Dams Safety Review 2013
Mar-13
4.3 Woollen Mills Dam
4.3.1
Failure modes
The fol owing credible failure modes have been determined for Woollen Mills Dam;
FM1: Flood overtopping leading to dam instability and/or undermining
FM2: Piping failure in the dam foundation under normal loading
FM3: Earthquake leading to significant structural damage
This determination is based on the fol owing influencing factors;
• Wool en Mil s Dam is a concrete gravity dam with no foundation relief drains and no uplift
instruments (typical for its era), meaning that the potential for instability is increased
where reservoir head is transmitted to the base of the dam.
• The spil way is sized for an annual flood (approx.) meaning that the dam is regularly
overtopped.
• There is major undermining of the spil way plunge pool that has regressed significantly
upstream over the last six years. This wil likely lead to dam instability through removal of
toe support or foundation piping due to shortened seepage length increasing hydraulic
gradient.
• Woollen Mills Dam is located very close to the Wellington Fault meaning that in a seismic
event earthquake shaking loads wil be very high.
4.3.2
Surveil ance
Regular visual inspection and measurement of the extent of plunge pool undermining and any
seepage or leakage is the best form of early detection of these failure modes. The key
performance indicators are;
• Toe erosion (including spil way plunge pool)
(FM1)
• New/increasing and/or turbid (muddy) leakage
(FM2)
• Earthquake damage
(FM3)
Special inspections during and after floods and after earthquakes are also important given the
unusual load condition. Inspections should include observation of flood overtopping flow paths,
erosion/undermining, structural damage, unusual seepage and reservoir rim instability.
4.4 Birchville Dam
4.4.1
Failure modes
The fol owing credible failure modes have been determined for Birchville Dam;
FM1: Earthquake leading to significant structural damage and/or left abutment failure
FM2: Left abutment failure under normal loading
This determination is based on the fol owing influencing factors;
• Birchvil e Dam is a single curvature arch dam with no foundation or abutment relief
drainage. Arch dams are typically very robust and perform wel in all loading conditions
provided the abutments continue to support dam loads.
• The dam toe is resilient to flood overtopping on the assumption that it is wel embedded
into the foundation and protected with extensive riprap (indicated on design drawing and
supported visual y). The dam is also indicated to be keyed in to the abutments, providing
a degree of resistance to erosion under flood overtopping.
Damwatch Services Ltd
Job S1237 – Revision 0 for Client Comment March 2013
11
Greater Wel ington Regional Council (Parks)
Korokoro, Woollen Mills and Birchville Dams Safety Review 2013
Mar-13
• The left abutment rock is adversely jointed, weathered and re-entrant. These factors
present the potential for abutment instability, however there is no indication of deep
seated instability or seepage.
• Birchville Dam is located very close to the Wellington Fault meaning that in a seismic event
earthquake shaking loads wil be very high.
4.4.2
Surveil ance
Regular visual inspection with particular attention to the abutments is the best form of early
detection of these failure modes. The key performance indicators are;
• Slope distress in the left abutment
(FM1 and FM2)
• New/increasing and/or turbid (muddy) leakage in the left abutment
(FM1 and FM2)
• Structural damage to the dam under normal or earthquake loading
(FM1 and FM2)
Special inspections during and after floods and after earthquakes are also important given the
unusual load condition. Inspections should include observation of flood overtopping flow paths,
erosion/undermining, structural damage, unusual seepage and reservoir rim instability.
Damwatch Services Ltd
Job S1237 – Revision 0 for Client Comment March 2013
12
Greater Wel ington Regional Council (Parks)
Korokoro, Woollen Mills and Birchville Dams Safety Review 2013
Mar-13
5
INSPECTION FINDINGS
The safety review dam inspections were made on 10th of December 2012. No testing of dam
valves was carried out.
5.1 Safety Review Team
The Safety Review team comprised:
Dan Forster
Lead Examiner and Author
Senior Dam Safety Engineer,
Damwatch Services Ltd.
Andrew Balme
Support Examiner and Author
Dam Safety Engineer,
Damwatch Services Ltd.
The dam inspections were also attended by:
Bronek Kazmierow
GWRC (Principal Ranger)
Lawrence Silas
GWRC (Maintenance Ranger)
Chris Sanders
GWRC (Maintenance Ranger)
Bryn Menzies
GWRC (Maintenance Ranger)
Joel Revil
GWRC (Maintenance Ranger)
James Craig
GWRC (Engineering Technician)
5.2 Korokoro Dam
5.2.1
Key findings summary
The dam is in remarkably good condition considering it is now one hundred and ten years old. The
key issues identified during the inspection of Korokoro Dam were;
1. Significant vegetation on the dam groins, downstream face and toe.
Clearing the
vegetation, particularly on the toe, wil vastly improve ability to perform regular visual
inspection.
2. Water ponded on the toe, particularly against the left abutment.
Drainage of the toe wil
vastly improve the value of regular visual inspection and seepage monitoring.
3. Significant seepage emerging from the toe of the dam adjacent to the spil way.
Local
capture and regular measurement of the seepage quantity wil be highly beneficial to
ongoing surveil ance of the dam. Likewise capture and regular measurement of dam ‘total’
seepage adjacent to the spil way plunge pool wil be highly beneficial.
5.2.2
Inspection detail
(Referenced site inspection photos are included in Appendix B)
Reservoir
The reservoir has significant accumulation of soft sediment such that the active clear water
storage is of the order of half a metre deep. The reservoir has also reduced significantly in surface
area as the upstream extent has advanced downstream also with accumulation of sediment
(photo 1).
The reservoir rim is heavily vegetated and has no signs of instability.
Damwatch Services Ltd
Job S1237 – Revision 0 for Client Comment March 2013
13
Greater Wel ington Regional Council (Parks)
Korokoro, Woollen Mills and Birchville Dams Safety Review 2013
Mar-13
Abutments
Both left and right abutments are heavily vegetated with no signs of instability (photos 1 and 2).
There is no sign of erosion at the upstream contact of dam to abutment on either abutment. The
downstream left groin is vegetated right to the dam contact (photos 2 and 9).
It is recommended
that a 2m clear width be provided to al ow ongoing inspection of this key area. The downstream
right abutment is vegetated right to the contact with the spil way chute (photos 3, 4 and 11).
It is
recommended that selective trimming of overhanging vegetation be undertaken to al ow ongoing
inspection of this key area. Upstream face, crest and downstream face
The dam upstream face, crest and downstream face concrete are sound with no significant
defects. There is a brick missing from the crest detail near to the spil way, however this is of low
consequence (photos 2 and 3). A large portion of the downstream face has accumulated sediment
and grass growth.
It is recommended that this be removed to allow clear view of the downstream
face. The crest accommodates appendages in the form of a wooden walkway and viewing platform for
visitors (photos 1 and 2). These are in reasonable condition and are only of dam safety
significance during major floods when they will catch debris and reduce the discharge capacity
over the dam crest.
Spillway
The spil way comprises a free overflow crest and stepped chute at the right abutment contact
(photos 3, 4, 5 and 11). The spillway is in fairly good condition with no evidence of major erosion
in the chute steps or plunge pool. The chute wal s are upright with no signs of damage. Anecdotal
evidence suggests that the spil way chute, and potential y the dam also, are frequently
overtopped. This is supported by evidence of significant erosion of what is either placed fil or
natural ground adjacent to the spil way chute and above the toe of the dam.
Toe
The dam toe is heavily vegetated with ferns, trees and grasses (photos 5 and 9-11).
It is
recommended that the trees and grasses be removed to al ow regular visual inspection of this key
area.
There is significant seepage emerging from beneath the spil way chute and from the toe of the
dam adjacent to the spil way (photos 6-8). This has increased from approximately 2.4 litres per
minute in 2006 to approximately 12 litres per minute at the time of inspection (December 2012).
Whilst these measurements were made without an accurate instrument or set-up, it is clear there
has been a notable increase in the rate of seepage over recent years and this is concerning.
Local
capture and regular measurement of the seepage quantity wil be highly beneficial to ongoing
surveil ance of the dam and should be implemented as a priority. Likewise capture and regular
measurement of dam ‘total’ seepage adjacent to the spil way plunge pool wil be highly beneficial.
There is ongoing evidence of erosion at the dam toe of what is either placed fill or natural ground.
This should be monitored during and after flood events and if undermining of the toe develops
remediation wil be required. In the meantime this area should be uncovered so that toe seepage
can be observed and measured. Comparative photography is a useful tool in determining changes
to erosion. There is water ponded on the toe, particularly against the left abutment (photo 2). Drainage of
the toe will vastly improve the value of regular visual inspection.
There is a large diameter pipe of unknown origin exiting adjacent to the spil way plunge pool
(photo 11). It is thought that this may be the outlet for the dam outlet works, which is believed to
be out of service. Clearing of vegetation on the dam toe may confirm this.
Damwatch Services Ltd
Job S1237 – Revision 0 for Client Comment March 2013
14
Greater Wel ington Regional Council (Parks)
Korokoro, Woollen Mills and Birchville Dams Safety Review 2013
Mar-13
5.3 Woollen Mills Dam
5.3.1
Key findings summary
The dam is one hundred and ten years old and is in good condition except for the spil way toe.
The key issues identified during the inspection of Woollen Mills Dam were;
1. Major damage to the lower extent of the spil way chute and regression/undermining
upstream of the spil way plunge pool.
This has worsened in the last six years and wil need
to be remediated before erosion removes material supporting the dam resulting in dam
failure. In the meantime the extent of undermining should be regularly monitored,
particularly after significant rainfal events.
2. Significant vegetation on the dam groins and toe.
Clearing the vegetation, particularly on
the toe, wil vastly improve ability to perform regular visual inspection.
5.3.2
Inspection detail
(Referenced site inspection photos are included in Appendix B) Reservoir
The reservoir is almost non-existent with significant accumulation of gravels (photos 13 and 14).
The active clear water storage is less than half a metre deep and of the order of 10 metres
upstream extent.
The upstream val ey is very narrow and steep sided with numerous instances of rock-fall (photo
12). There is a moderate to high likelihood of the occurrence of rock-fall leading to temporary
blockage of the Korokoro Stream, impoundment of a reservoir and likely subsequent breach. This
would likely be damaging to Wool en Mil s dam through sudden overtopping and the impact of
debris.
Abutments
Both left and right abutments are steep with moderate vegetation (photos 13-17). The left
abutment is stable (photos 21 and 22) whereas the right abutment exhibits significant rock-fall
downstream of the dam alignment (photos 13, 16 and 17). It appears that rock-fal damaged the
spil way chute and contributed to regression/undermining of the spil way toe (19 and 22).
However, rock instability on the right abutment does not appear to be deep seated and as such
does not compromise the dam.
Upstream face, crest and downstream face
The dam upstream face, crest and downstream face concrete are sound with no significant defects
(photos 13, 17 and 21). There is a crack that extends down the spil way wal , across the crest and
diagonal y down the upstream face toward the spil way crest. The crack is not open or displaced
and does not affect the structural integrity of the main dam body (photo 18).
Spillway
The spil way comprises a free overflow crest and chute at the right abutment contact. The
spillway chute and toe are in very poor condition with significant loss of the chute slab and major
undermining of the toe (photo 22). Probing with a stick under the remaining downstream chute
slab indicates an eroded cavity of 1.5m horizontal extent and 2m depth approximately.
This has
worsened significantly in the last six years and wil need to be remediated before erosion removes
material supporting the dam resulting in dam failure. In the meantime the extent of undermining
should be regularly monitored, particularly after significant rainfal events.
Damwatch Services Ltd
Job S1237 – Revision 0 for Client Comment March 2013
15
Greater Wel ington Regional Council (Parks)
Korokoro, Woollen Mills and Birchville Dams Safety Review 2013
Mar-13
Toe
The dam toe is heavily vegetated with weeds (photos 15 and 23). Inspection of the immediate toe
fol owing cursory weed-clearing indicated no signs of erosion.
It is recommended that the weeds
be removed to allow adequate visual inspection of this key area. At times there is water ponded on the toe of the dam, however drainage of this area could be
difficult due to the relatively flat ground/streambed slope.
5.4 Birchville Dam
5.4.1
Key findings summary
The dam is eighty three years old and is in very good condition. The key issues identified during
the inspection of Birchville Dam were;
1. Significant vegetation on the dam groins and toe.
Clearing a 2m buffer on the groins will
vastly improve ability to perform regular visual inspection.
2.
Importance of regular visual inspection of the downstream left abutment checking for any
signs of deep-seated instability or seepage. Surface weathering is not an issue.
3.
It would be valuable to conduct a basic bathymetric survey of the reservoir using depth
sounding from a boat.
4.
It would be beneficial to lower the storage level temporarily to al ow removal of the weed
and moss, which in turn would al ow a visual inspection of the downstream face concrete.
5.4.2
Inspection detail
(Referenced site inspection photos are included in Appendix B) Reservoir
The reservoir is reported to have significant accumulation of sediment, with sediment measured
6.3m below the spil way crest in 1988. In the years since this measurement it is expected that the
depth to sediment will have decreased, thus decreasing the active water storage volume.
It would
be valuable to conduct a basic bathymetric survey of the reservoir using depth sounding from a
boat. The reservoir rim is steep and heavily vegetated with no signs of instability (photo 24).
Abutments
Both left and right abutments are steep with heavy vegetation (photos 25, 27 and 30). Both
abutments are visibly stable although there has been previous question raised over the stability of
the left abutment due to jointing and re-entrant nature (Tonkin and Taylor, 1989).
Inspection of
the upper and downstream left abutment reveals that whilst there is significant surface weathering
there are no indications of deep-seated instability or leakage. This key area should continue to be
monitored during routine visual inspections.
Both left and right ends of the dam make positive contact with their respective abutments. There
is no reservoir erosion at the upstream contacts (photo 28).
To improve visual inspection of the
downstream contacts a 2m strip clearance of vegetation is recommended (photos 29 and 31). Upstream face, crest and downstream face
The dam upstream face, crest and downstream face concrete are sound with no significant defects
(photos 25, 27 and 29). The downstream face is covered with weed and moss due to the constant
presence of spil flow (photos 26 and 30).
It would be beneficial to lower the storage level
temporarily to al ow removal of the weed and moss, which in turn would al ow a visual inspection
Damwatch Services Ltd
Job S1237 – Revision 0 for Client Comment March 2013
16
Greater Wel ington Regional Council (Parks)
Korokoro, Woollen Mills and Birchville Dams Safety Review 2013
Mar-13
of the downstream face concrete. Based on other observations of the dam concrete it is expected
that the concrete beneath the weed and moss is in reasonable condition.
Spillway
The spil way comprises a free overflow crest central to the dam with toe erosion protection in the
form of riprap (photos 25 and 26). The spil way crest length is approximately half the dam crest
length at an estimated 23 m. The spil way is in good condition with the toe riprap intact and
continuing to provide erosion protection to the dam toe.
Toe
The immediate dam toe is clear of vegetation and wel protected from spil flow by substantial
depth of riprap (photos 26 and 30). There are no indications of dam or foundation leakage.
Damwatch Services Ltd
Job S1237 – Revision 0 for Client Comment March 2013
17
Greater Wel ington Regional Council (Parks)
Korokoro, Woollen Mills and Birchville Dams Safety Review 2013
Mar-13
6
ASSESSMENT WITH RESPECT TO CURRENT ACCEPTIBILITY CRITERIA FOR LOW PIC
DAMS
6.1 Korokoro Dam
6.1.1
Flood passage capacity
Flood hydrology for the Korokoro Stream was last assessed in 2003 with flood return periods and
discharges given for the Wool en Mil s dam up to Q100 (Opus, 2003). This remains the current and
best estimate of flood conditions in the Korokoro Stream.
NZSOLD dam safety guidelines (NZSOLD, 2000) defines the flood capability acceptance criterion for
a Low PIC dam is, “between 1:100 and 1:1,000 AEP (annual exceedance probability)”, termed the
‘inflow design flood’ (IDF).
Flood return periods and discharges were subsequently estimated for the Korokoro dam site with
a one hundred year return period flood of 42 m³/s. The 2006 safety review estimated Korokoro
dam spil way as having a capacity of 5 m³/s, which is approximately an annual flood event
(Damwatch, 2006). Thus on a current standards basis, Korokoro Dam does not have sufficient
flood capability using its spillway. It is expected that the dam is regularly overtopped by floods
and this is supported by the evidence of significant erosion of the downstream toe area.
This being said, the dam has withstood what is believed to be a significant degree of overtopping
remarkably wel for its lifetime of one hundred and ten years. On a historical performance basis
the dam performs satisfactorily under flood overtopping and has low incremental consequence of
failure by this mode (it is unlikely there wil be recreational users downstream during major
flooding).
The area that has undergone the most significant erosion is at the dam toe adjacent to the
spil way chute wal , where significant material has been removed. It is not certain whether this
material was natural ground or fil placed during construction. The dam toe or spil way chute are
not currently undermined, however there is significant seepage emerging from this location,
including from bony concrete beneath the spil way chute.
It is recommended to continue to
monitor the dam toe and spil way wall area for undermining and if it develops to remediate and
instal a form of protection or energy dissipation. In the meantime this area should be uncovered
for ongoing monitoring of seepage flows.
It would be beneficial to perform special surveil ance inspections during and after flood events to
establish a documented record of the dam’s performance under flood conditions. Depth of water
over the dam crest supported by photography and video footage wil be particularly beneficial.
6.1.2
Dam stability assessment
The 2006 safety review (Damwatch, 2006) assessed dam stability in some detail. The assessment
remains current on the basis that the parameters used for foundation and dam characteristics and
the assessment loads still stand. This safety review provides a summary of the 2006 Korokoro dam
stability assessment to demonstrate the approach used and present key results. Further details
can be found in the 2006 safety review.
General
A key failure mechanism to be assessed for a concrete gravity dam is sliding on any horizontal or
near-horizontal plane within the dam, at the base, or on any rock seam in the foundation.
The NZSOLD dam safety guidelines (NZSOLD, 2000) provide the fol owing recommended minimum
values for the factors of safety against sliding.
• For normal loading: 3.0
Damwatch Services Ltd
Job S1237 – Revision 0 for Client Comment March 2013
18
Greater Wel ington Regional Council (Parks)
Korokoro, Woollen Mills and Birchville Dams Safety Review 2013
Mar-13
• For design flood conditions: 2.0
• For maximum safety evaluation earthquake loading: 1.1
• For post-earthquake loading conditions: 2.0
Some regulatory authorities in other countries allow lower factors of safety in certain
circumstances. For example, the US Federal Energy Regulatory Commission (FERC) has the
fol owing recommended factors of safety for dams having a low potential impact as fol ows:
• For normal loading: 2.0
• For design flood conditions: 1.25
• For maximum safety evaluation earthquake loading: greater than 1.0
• For post-earthquake loading conditions: 1.25
Sediment
The 2006 safety review (Damwatch, 2006) took into account the degree of sediment stored in the
dam’s reservoir (approx. 7.5m depth of sediment used) to calculate sediment loads on the dam.
This is assumed not to have changed significantly in six years (relative to the lifetime of the dam)
and has not been recalculated.
Flood loading
As discussed in Section 6.1.1, the 1:100 AEP flood is the minimum requirement for flood loads.
The 1:100 AEP flood of 42 m³/s is estimated to overtop the dam to a depth of 0.9m, which is
approximately 1.6m above the normal reservoir level (Damwatch, 2006).
Earthquake loading
For a Low PIC dam the NZSOLD guidelines do not provide specific recommendations for the level
of earthquake shaking such dams should safely withstand without failure. Major dam owners in
New Zealand have adopted the 1:500 annual exceedance probability (AEP) event as the safety
evaluation earthquake for Low PIC structures (Mejia L. et al, 2001). This is considered appropriate
for this dam. The New Zealand Standard earthquake loading code (Standards New Zealand, NZS
1170.5:2004) can be used to determine the earthquake shaking the dams would be subject to in a
1:500 AEP earthquake, and this shows that a 0.4g peak ground acceleration would be appropriate
for this dam. A pseudo-static analysis was used (Damwatch, 2006).
The loading code is based on the National Seismic Hazard Model developed by GNS Science. GNS
has very recently reviewed and updated the model, with particular attention taken to apply
learnings from the Canterbury earthquakes to other regions of the country.
Damwatch has spoken
with GNS regarding any changes to the seismic hazard model and there has been no change in the
Wel ington area to the short period motions that affect dams. Therefore the peak ground
acceleration taken from the 2004 earthquake loading code remains appropriate. The seismic hazard model may also be used to estimate historic ground accelerations (model ed
values) that the dam sites have been exposed to in the past.
Dam sections
For Korokoro Dam two sections were analysed in Damwatch (2006); the centre of the dam and the
right hand side adjacent to the spil way, with three horizontal sliding planes considered, namely; in
the rock foundation, in the concrete near the base of the dam, and at mid height (right hand side
of dam only).
Damwatch Services Ltd
Job S1237 – Revision 0 for Client Comment March 2013
19
Greater Wel ington Regional Council (Parks)
Korokoro, Woollen Mills and Birchville Dams Safety Review 2013
Mar-13
Assessed factors of safety under al loading conditions
Table 6-1 is a summary of factors of safety against both NZSOLD and FERC recommended values,
as determined in the 2006 safety review (Damwatch, 2006).
Table 6-1: Korokoro Dam sliding factors of safety (Damwatch, 2006)
Load case
In rock
In concrete In concrete NZSOLD min. FERC min.
foundation
near base
mid height
(Low PIC)
(Low PIC)
Centre section
Normal
3.4
9.4
-
3.0
2.0
Flood
2.5
6.9
-
2.0
1.25
Earthquake
1.6
4.3
-
1.1
>1.0
Post-eq
2.1
5.3
-
2.0
1.25
Right hand section
Normal
2.0
5.5
13.7
3.0
2.0
Flood
1.4
4.1
6.8
2.0
1.25
Earthquake
1.1
2.9
6.2
1.1
>1.0
Post-eq
1.2
3.1
7.5
2.0
1.25
Assessment of results
The results show that in the foundation; both NZSOLD and FERC minimum factors of safety are
achieved in the centre section, whereas only the FERC factors are met in the right hand section.
However, there is anticipated to be some three dimensional structural contribution at the more
slender right hand section because there are no contraction joints or vertical cracks. This would
increase the factors of safety determined in the two-dimensional analysis. The reverse is true for
the centre section, however the available margins of safety are greater.
Overall, it is considered that Korokoro Dam meets acceptable foundation sliding stability criteria
(Damwatch, 2006).
6.2 Woollen Mills Dam
6.2.1
Flood passage capacity
Flood hydrology for the Korokoro Stream was last assessed in 2003 with flood return periods and
discharges given for the Wool en Mil s dam up to Q100 (Opus, 2003). This remains the current and
best estimate of flood conditions in the Korokoro Stream.
Wool en Mil s dam site has a one hundred year return period flood of 67 m³/s. The 2006 safety
review estimated Woollen Mills dam spillway as having a capacity of 5.5 m³/s, which is
approximately an annual flood event (Damwatch, 2006). It is expected from this that the dam is
regularly overtopped by floods. This is supported by anecdotal evidence, however apart from the
spil way chute and plunge pool damage there is no significant damage observed at the dam toe.
As a general rule, the dam has withstood what is believed to be a significant degree of overtopping
remarkably wel for its lifetime of one hundred and ten years. The area that has undergone the
most significant erosion is at the spil way chute and plunge pool where significant undermining
exists. This is believed to have been contributed to by rock-fall causing damage to the spil way
chute slab, however is undoubtedly worsened by continued frequent floods and less frequent
major floods.
Damwatch Services Ltd
Job S1237 – Revision 0 for Client Comment March 2013
20
Greater Wel ington Regional Council (Parks)
Korokoro, Woollen Mills and Birchville Dams Safety Review 2013
Mar-13
It would be beneficial to perform special surveillance inspections during and after flood events to
establish a documented record of the dam’s performance under flood conditions. Depth of water
over the dam crest supported by photography and video footage wil be particularly beneficial.
NZSOLD dam safety guidelines (NZSOLD, 2000) defines the flood capability acceptance criterion for
a Low PIC dam is, “between 1:100 and 1:1,000 AEP (annual exceedance probability)”, termed the
‘inflow design flood’ (IDF). Thus on a current standards basis, Woollen Mills Dam spillway does not
have sufficient flood capacity. However, on a historical performance the dam performs fairly wel
under flood overtopping and has low incremental consequence of failure by this mode (it is
unlikely there wil be recreational users downstream during major flooding). In support of this, the
very smal volume of remaining reservoir reduces the consequences of dam break. In this respect
a dam ‘failure’ is unlikely to result in an incrementally significant release of stored water content.
6.2.2
Dam stability assessment
The stability assessment for Korokoro Dam (refer Section 6.1.2) provides introductory commentary
on the method used for the 2006 stability assessment for Korokoro and Wool en Mil s dams (the
same methodology was used for both dams).
As far as Wool en Mil s dam stability is concerned the 2006 assessment remains current on the
basis that the parameters used for foundation and dam characteristics and the assessment loads
stil stand. This safety review provides a summary of the assessment to demonstrate the approach
used and present key results. Further details can be found in the 2006 safety review (Damwatch,
2006). Comment is provided on the worsened spil way toe erosion in the context of dam stability.
Sediment
The 2006 safety review (Damwatch, 2006) took into account the degree of sediment stored in the
dam’s reservoir (approx. 5m depth of sediment used) to calculate sediment loads on the dam.
This is assumed not to have changed significantly in six years (relative to the lifetime of the dam)
and has not been recalculated.
Flood loading
As stated in Section 6.2.1, the 1:100 AEP flood is approximately 60 m³/s and is estimated to
overtop the dam to a depth of 1.5m, which is approximately 2.4m above the normal reservoir level
(Damwatch, 2006).
Earthquake loading
As for Korokoro Dam, a 1:500 AEP peak ground acceleration of 0.4g was considered appropriate
for Woollen Mills dam and a pseudo-static analysis was used (Damwatch, 2006).
Dam section
A typical Woollen Mills dam section was analysed with two horizontal sliding planes considered,
namely; in the rock foundation, in the concrete near the base of the dam.
Assessed factors of safety under al loading conditions
Table 6-2 is a summary of factors of safety against both NZSOLD and FERC recommended values,
as determined in the 2006 safety review (Damwatch, 2006).
Damwatch Services Ltd
Job S1237 – Revision 0 for Client Comment March 2013
21
Greater Wel ington Regional Council (Parks)
Korokoro, Woollen Mills and Birchville Dams Safety Review 2013
Mar-13
Table 6-2: Woollen Mills Dam sliding factors of safety (Damwatch, 2006)
Load case
In rock
In concrete NZSOLD min.
FERC min.
foundation
near base
(Low PIC)
(Low PIC)
Typical section
Normal
2.9
8.8
3.0
2.0
Flood
1.8
5.6
2.0
1.25
Earthquake
1.2
3.7
1.1
>1.0
Post-eq
1.8
4.9
2.0
1.25
Assessment of results
In the foundation three of the factors of safety are below the NZSOLD minimum values, but are
well above the FERC values. This is acceptable on the basis that the analysis assumes a flat shear
surface in the foundation, whereas in reality this surface is rough and provides much greater
resistance to shear failure.
In the time since 2006 there has been further loss of foundation at the spil way toe through
undermining. However, this does not affect the stability assessment on the basis that a typical
section was used and the spil way chute continues to provide some buttressing support to the
dam section at this location. It has been recommended earlier in this report that the spil way toe
undermining be remediated to prevent dam instability.
Overal , it is considered that Woollen Mills Dam meets acceptable foundation sliding stability
criteria (Damwatch, 2006).
6.3 Birchville Dam
6.3.1
Flood passage capacity
Tonkin and Taylor’s stability review of Birchvil e Dam in 1989 assessed the 1:100 AEP flood peak as
being approximately 20 m³/s (Tonkin and Taylor, 1989). Their report also assessed spil way
capacity and concluded that the 1:100 AEP flood would just be contained within the spil way and
the PMF (45 m³/s) would overtop the dam crest by approximately 300mm. Damwatch check
calculations in 2006 concurred with this assessment.
It would be beneficial to perform special surveil ance inspections during and after flood events to
establish a documented record of the dam’s performance under flood conditions. Depth of water
over the spil way crest supported by photography and video footage wil be particularly beneficial.
NZSOLD dam safety guidelines (NZSOLD, 2000) defines the flood capability acceptance criterion for
a Low PIC dam is, “between 1:100 and 1:1,000 AEP (annual exceedance probability)”, termed the
‘inflow design flood’ (IDF). Thus based on current standards, Birchville Dam has sufficient flood
capacity in that it can safely pass a 1:100 AEP flood and would likely also pass a PMF without
severe damage. This is supported by eighty three years of dam performing wel under flood
loading, with no indications of erosion or instability that could compromise the dam. Further, on a
risk basis the dam has low incremental consequence of failure by flood overtopping. This is on the
basis that it is unlikely there wil be recreational users downstream during major flooding.
6.3.2
Dam stability assessment
There is not a rapid and simple method for assessing the structural stability of an arch dam. For
complicated arch dams detailed computational analysis is used. However, the 2006 safety review
made a reasonable assessment of loading for Birchvil e dam using simple ring theory. The method
provided an estimate of the thrusts at the abutments from water and earthquake loads and in turn
Damwatch Services Ltd
Job S1237 – Revision 0 for Client Comment March 2013
22
Greater Wel ington Regional Council (Parks)
Korokoro, Woollen Mills and Birchville Dams Safety Review 2013
Mar-13
the thrust loads were used to assess the stability of the abutments. Experience shows that
unstable wedges of rock in abutments are the most likely feature to endanger the safety of an arch
dam. The 2006 safety review considered that the left abutment may have unfavourably aligned
jointing that could cause a potential wedge failure mechanism. It then assumed that only friction
in the joint could be relied on to resist thrust and that the joint would be pressurised by the
reservoir (Damwatch, 2006).
The following residual factors of safety for sliding in foundation joints or seams recommended in
the NZSOLD guidelines (NZSOLD, 2000) were used;
• Normal loading: 1.5
• Design flood: 1.3
• Maximum safety evaluation earthquake: 1.0
Sediment load
An approximate depth of sediment of 5m was used to calculate sediment loads on the dam. A
recommendation has been made to undertake a bathymetric survey of the reservoir to confirm
the present depth of sediment.
A significant increase in the depth of sediment against the arch
dam would warrant a check of the sediment load and arch dam thrust loads.
Flood loading
Flood loading on the dam was assumed to be 0.3m overtopping resulting in only a smal increment
in thrust loading.
Earthquake loading
As for Korokoro and Wool en Mil s dams the earthquake loading used was 0.4g (peak ground
acceleration). The increase in thrust was estimated to be approximately 80% of the normal thrust
loads. This takes into account the seismic inertia force and from the self weight of the dam and
the hydrodynamic water pressure.
Abutment assessed
The left abutment conditions were deemed to be the least favourable and hence this was the
dominant feature that was assessed.
Assessed factors of safety under al loading conditions
Table 6-3 is a summary of the factors of safety against NZSOLD recommended values, as
determined in the 2006 safety review (Damwatch, 2006).
Table 6-3: Birchville left abutment residual sliding factors of safety (Damwatch, 2006)
Load case
At 5m
At 10m
NZSOLD min.
depth
depth
Left abutment
Normal
2.0
1.5
1.5
Flood
2.0
1.5
1.3
Earthquake
1.8
1.5
1.0
Assessment of results
The results give confidence in the stability of the left abutment under al loading conditions. The
right abutment was not assessed specifically as its conditions are more favourable than the left
abutment.
Damwatch Services Ltd
Job S1237 – Revision 0 for Client Comment March 2013
23
Greater Wel ington Regional Council (Parks)
Korokoro, Woollen Mills and Birchville Dams Safety Review 2013
Mar-13
The two-dimensional assessment that was used is conservative in that three-dimensional effects
would improve the abutment resistance (provided by plan area of failure wedge), and a level of
cantilever action by the arch dam would result in lower thrust loads. The assessment is also
conservative in that it considered factors of safety at point depths, whereas in reality the thrust
and resistance applies to a depth range of dam to abutment contact, thus the overal factors of
safety would be greater.
Importantly, under earthquake loading when arch dam thrusts are increased, there is expected to
be minimal reduction in the stability of the potential abutment rock failure wedges. Arch dams
and their abutments are inherently stable under both earthquake and flood loading and this is
supported by their worldwide historical performance.
The 2006 safety review considered that, whilst some cracking of the dam concrete would be
probable under earthquake shaking of 0.4g, dam failure by excessive cracking was not expected.
Overal , it is considered that Birchville Dam meets acceptable stability criteria (Damwatch, 2006).
6.4 Dam Safety Programme
6.4.1
NZSOLD dam safety guidelines
NZSOLD dam safety guidelines recommend that Low PIC dams be subject to the fol owing dam
safety and surveillance activities;
1. Regular (routine) inspection by the operator or owner of the general condition of the dam
and the consistency of aspects such as identifiable seepage. Monthly to 4-monthly
recommended.
2. Routine maintenance of dam surfaces and spil way paths.
3. Intermediate (e.g. 1 to 2 yearly) inspections by an appropriate technical adviser.
4. Comprehensive (10 yearly) inspection and review by an appropriate technical dam
specialist. This may be met by augmenting the intermediate report at the 10 year interval.
For Low PIC dams a dam safety assurance programme (DSAP) and an emergency action plan (EAP)
will not be mandatory for compliance with the new Building Act Dam Safety Scheme.
6.4.2
Assessment of Greater Wellington Regional Council dam safety activities
As introduced in Section 1.3.2, Greater Wellington Regional Council (GWRC) has ongoing dam
safety activities for Korokoro, Woollen Mills and Birchville dams. Importantly, these include
monthly routine inspections by maintenance rangers that have been trained in dam safety and
surveil ance. Routine dam safety inspections, in conjunction with appropriate technical support
and review, are widely known to be the most effective method for monitoring dam safety.
Fundamental y, GWRC’s dam safety activities include the items recommended in the NZSOLD
guidelines and are being completed at the recommended, or in some cases greater, frequency.
Due to the impending regulations for the NZ Dam Safety Scheme,
from July 2014 GWRC wil need
to review the dam PIC’s in accordance with the new Building Act methodology. If Medium PIC’s are
determined (currently Low), the current dam safety programme wil require alignment with the
dam safety assurance programme (DSAP) format specified in the regulations.
Damwatch Services Ltd
Job S1237 – Revision 0 for Client Comment March 2013
24
Greater Wel ington Regional Council (Parks)
Korokoro, Woollen Mills and Birchville Dams Safety Review 2013
Mar-13
7
DAM SAFETY STATUS
7.1 General
In this final section conclusions are drawn on dam safety status by bringing together the key
components of the review. This is a process that forms an understanding of the dam structures
and their failure modes; forms a hypothesis for their performance; assesses their performance
through observation and analysis; and concludes with a determination of the overall safety status.
7.2 Korokoro Dam
7.2.1
Understanding of the dam and failure modes
Korokoro Dam is an 8m high concrete gravity dam that is one hundred and ten years old. There is
limited design and construction information available, however indications are that the dam has
been wel built on competent foundation.
The dam does not have foundation (uplift) relief drains and is regularly overtopped by flood. The
dam’s reservoir is predominantly fil ed with silt with limited active storage remaining.
The dam’s credible failure modes are;
FM1: Flood overtopping leading to dam instability and/or undermining
FM2: Piping failure in the dam foundation under normal loading
FM3: Earthquake leading to significant structural damage
7.2.2
A hypothesis for performance
A dam of this height and construction is fairly robust and is expected to perform well, however
instability through foundation uplift and/or sliding needs to be the primary concern. Given the
absence of foundation drains it has to be assumed that ful reservoir pressure exists in the
foundation, decreasing to downstream pool level at the dam toe.
The dam and foundation are expected to be relatively resistant to erosion through piping and
overtopping.
7.2.3
Assessment of performance
The dam is performing wel except for significant seepage at the toe near to the spil way. It
appears that the rate of seepage has increased with time and may be suggestive of erosion of the
dam’s foundation. Whilst this would likely not deteriorate rapidly nor lead to a rapid failure, a
recommendation has been made to undertake regular monitoring of the seepage rate to
characterise its behaviour with time and serve as an early warning of foundation piping.
There are no indications of gross movement of the dam or signs of instability in the foundation
and abutments.
Whilst the dam has obviously been overtopped on a regular basis it has performed wel . The most
significant erosion is of what was either placed fill or natural ground against the downstream face
of the dam. A recommendation has been made to monitor this and if undermining occurs then
remediation wil be required. In the meantime it is beneficial to see and measure the seepage that
is emerging at this location.
The dam meets acceptability criteria for stability under all loading conditions.
7.2.4
Dam safety status
The dam is in relatively good condition and is performing wel for its age and the prevalent dam
technology of the day. There are no indications of any of its failure modes developing, although
Damwatch Services Ltd
Job S1237 – Revision 0 for Client Comment March 2013
25
Greater Wellington Regional Council (Parks)
Korokoro, Woollen Mills and Birchville Dams Safety Review 2013
Mar‐13
better understanding of the toe seepage is required to confirm that this is not related to
foundation piping.
Korokoro Dam has a low likelihood of failure and the best and most appropriate risk management
is to perform regular routine surveillance inspections including the monitoring of key features, i.e.
toe seepage and erosion. The value of this is improved significantly by keeping vegetation short on
the toe and downstream abutment contacts.
7.3 Woollen Mills Dam
7.3.1
Understanding of the dam and failure modes
Woollen Mills Dam is a 6m high concrete gravity dam that is one hundred and ten years old. There
is limited design and construction information available, however indications are that the dam has
been well built on competent foundation.
The dam does not have foundation (uplift) relief drains and is regularly overtopped by flood. The
dam’s reservoir is predominantly filled with gravel with almost no active storage remaining.
The dam’s credible failure modes are;
FM1: Flood overtopping leading to dam instability and/or undermining
FM2: Piping failure in the dam foundation under normal loading
FM3: Earthquake leading to significant structural damage
7.3.2
A hypothesis for performance
A dam of this height and construction is fairly robust and is expected to perform well, however
instability through foundation uplift and/or sliding needs to be the primary concern. Given the
absence of foundation drains it has to be assumed that full reservoir pressure exists in the
foundation, decreasing to downstream pool level at the dam toe.
The dam and foundation are expected to be relatively resistant to erosion through piping and
overtopping.
7.3.3
Assessment of performance
The dam is performing well except for major erosion beneath and at the toe of the spillway. This
appears to have been initiated by rock‐fall damage to the spillway chute and subsequent
undermining by normal and flood flows. The extent of undermining has worsened significantly
over the last six years and if it continues will eventually lead to the dam’s stability being
compromised through removal of base and toe support. A recommendation has been made to
undertake regular monitoring of the extent of undermining with time and remediation should be
planned for in the near future.
There are no indications of gross movement of the dam or signs of other instability in the
foundation and abutments.
The dam meets acceptability criteria for stability under all loading conditions.
7.3.4
Dam safety status
The dam is in good condition and performing well with the exception of erosion beneath the
spillway. There are currently no indications of any of its failure modes developing. However,
continued spillway undermining will eventually lead to dam instability through loss of base and toe
support.
Woollen Mills Dam has a low to moderate likelihood of failure due to the worsening condition of
the spillway. The most appropriate immediate risk management is to perform regular routine
Damwatch Services Ltd
Job S1237 – Revision 0 for Client Comment March 2013
26
Greater Wel ington Regional Council (Parks)
Korokoro, Woollen Mills and Birchville Dams Safety Review 2013
Mar-13
surveil ance inspections including the monitoring of its key feature, i.e. spil way toe erosion.
Remediation of the spil way and its toe wil return the dam to its intended function and reduce the
likelihood of failure to low. This should be done as a matter of priority.
7.4 Birchville Dam
7.4.1
Understanding of the dam and failure modes
Birchville Dam is a 15m high single curvature arch dam that is eighty three years old. There is
limited design and construction information available, however indications are that the dam has
been wel built on competent foundation.
The dam incorporates a free overflow spil way that can pass a flood of approximately 1:100 AEP,
with further capacity possible through overtopping of the dam. The dam’s reservoir contains a
large amount of accumulated sediment.
The left abutment is re-entrant and exhibits adverse jointing and weathering.
The dam’s credible failure modes are;
FM1: Earthquake leading to significant structural damage and/or left abutment failure
FM2: Left abutment failure under normal loading
7.4.2
A hypothesis for performance
Arch dams are typically robust and perform very wel provided that their abutments and
foundation continue to support dam thrust loads.
Birchvil e Dam has been wel constructed on what appear to be competent abutments and
foundation. There has been past concern raised over the left abutment stability, however there is
no indication of deep seated instability or seepage.
7.4.3
Assessment of performance
The dam is performing very wel with no indication of stress within the dam or its abutments.
There is no discernible leakage or seepage, although the toe is covered with large riprap meaning
that seepage in this area would not be visible. A recommendation has been made to undertake
regular monitoring of the abutments, with particular attention to the left abutment to ensure that
there are no indications of instability.
There are no indications of gross movement of the dam or signs of other instability in the
foundation and abutments.
The dam meets acceptability criteria for stability under al loading conditions using basic analysis
methods. A more complex analysis is not necessary or warranted given the dam’s Low PIC and
good performance over eighty three years.
7.4.4
Dam safety status
The dam and its abutments are in good condition and performing wel . There are currently no
indications of any of its failure modes developing, however ongoing monitoring of its abutments is
important.
Birchville Dam has a low likelihood of failure. The best and most appropriate risk management is
to perform regular routine surveil ance inspections including the monitoring of key features, i.e. the
left and right abutments.
Damwatch Services Ltd
Job S1237 – Revision 0 for Client Comment March 2013
27
Greater Wel ington Regional Council (Parks)
Korokoro, Woollen Mills and Birchville Dams Safety Review 2013
Mar-13
8
REFERENCES
Damwatch Services Ltd. (2006).
Safety Review of Birchvil e, Korokoro and Wool en Mil s Dams. Department of Building and Housing. (2008).
Dam Safety Scheme, Guidance for regional
authorities and owners of large dams.
Mejia L., Newson T., Gil on M. (2001).
Criteria for developing seismic loads for the safety evaluation
of dams of two New Zealand Owners, NZSOLD/ANCOLD 2001 Conference on Dams.
NZSOLD. (2000).
Dam Safety Guidelines. Opus International Consultants. (2003).
Korokoro Stream Flood Frequency. Standards New Zealand. (2004).
NZS 1170.5 1:2004, Structural design actions, Part 5: Earthquake
actions – New Zealand.
Tonkin and Taylor. (1989).
Birchvil e Dam, Stability Review, Stage 1.
Damwatch Services Ltd
Job S1237 – Revision 0 for Client Comment March 2013
28
Greater Wel ington Regional Council (Parks)
Korokoro, Woollen Mills and Birchville Dams Safety Review 2013
Mar-13
APPENDIX A: DRAWINGS
Damwatch Services Ltd
Job S1237 – Revision 0 for Client Comment March 2013
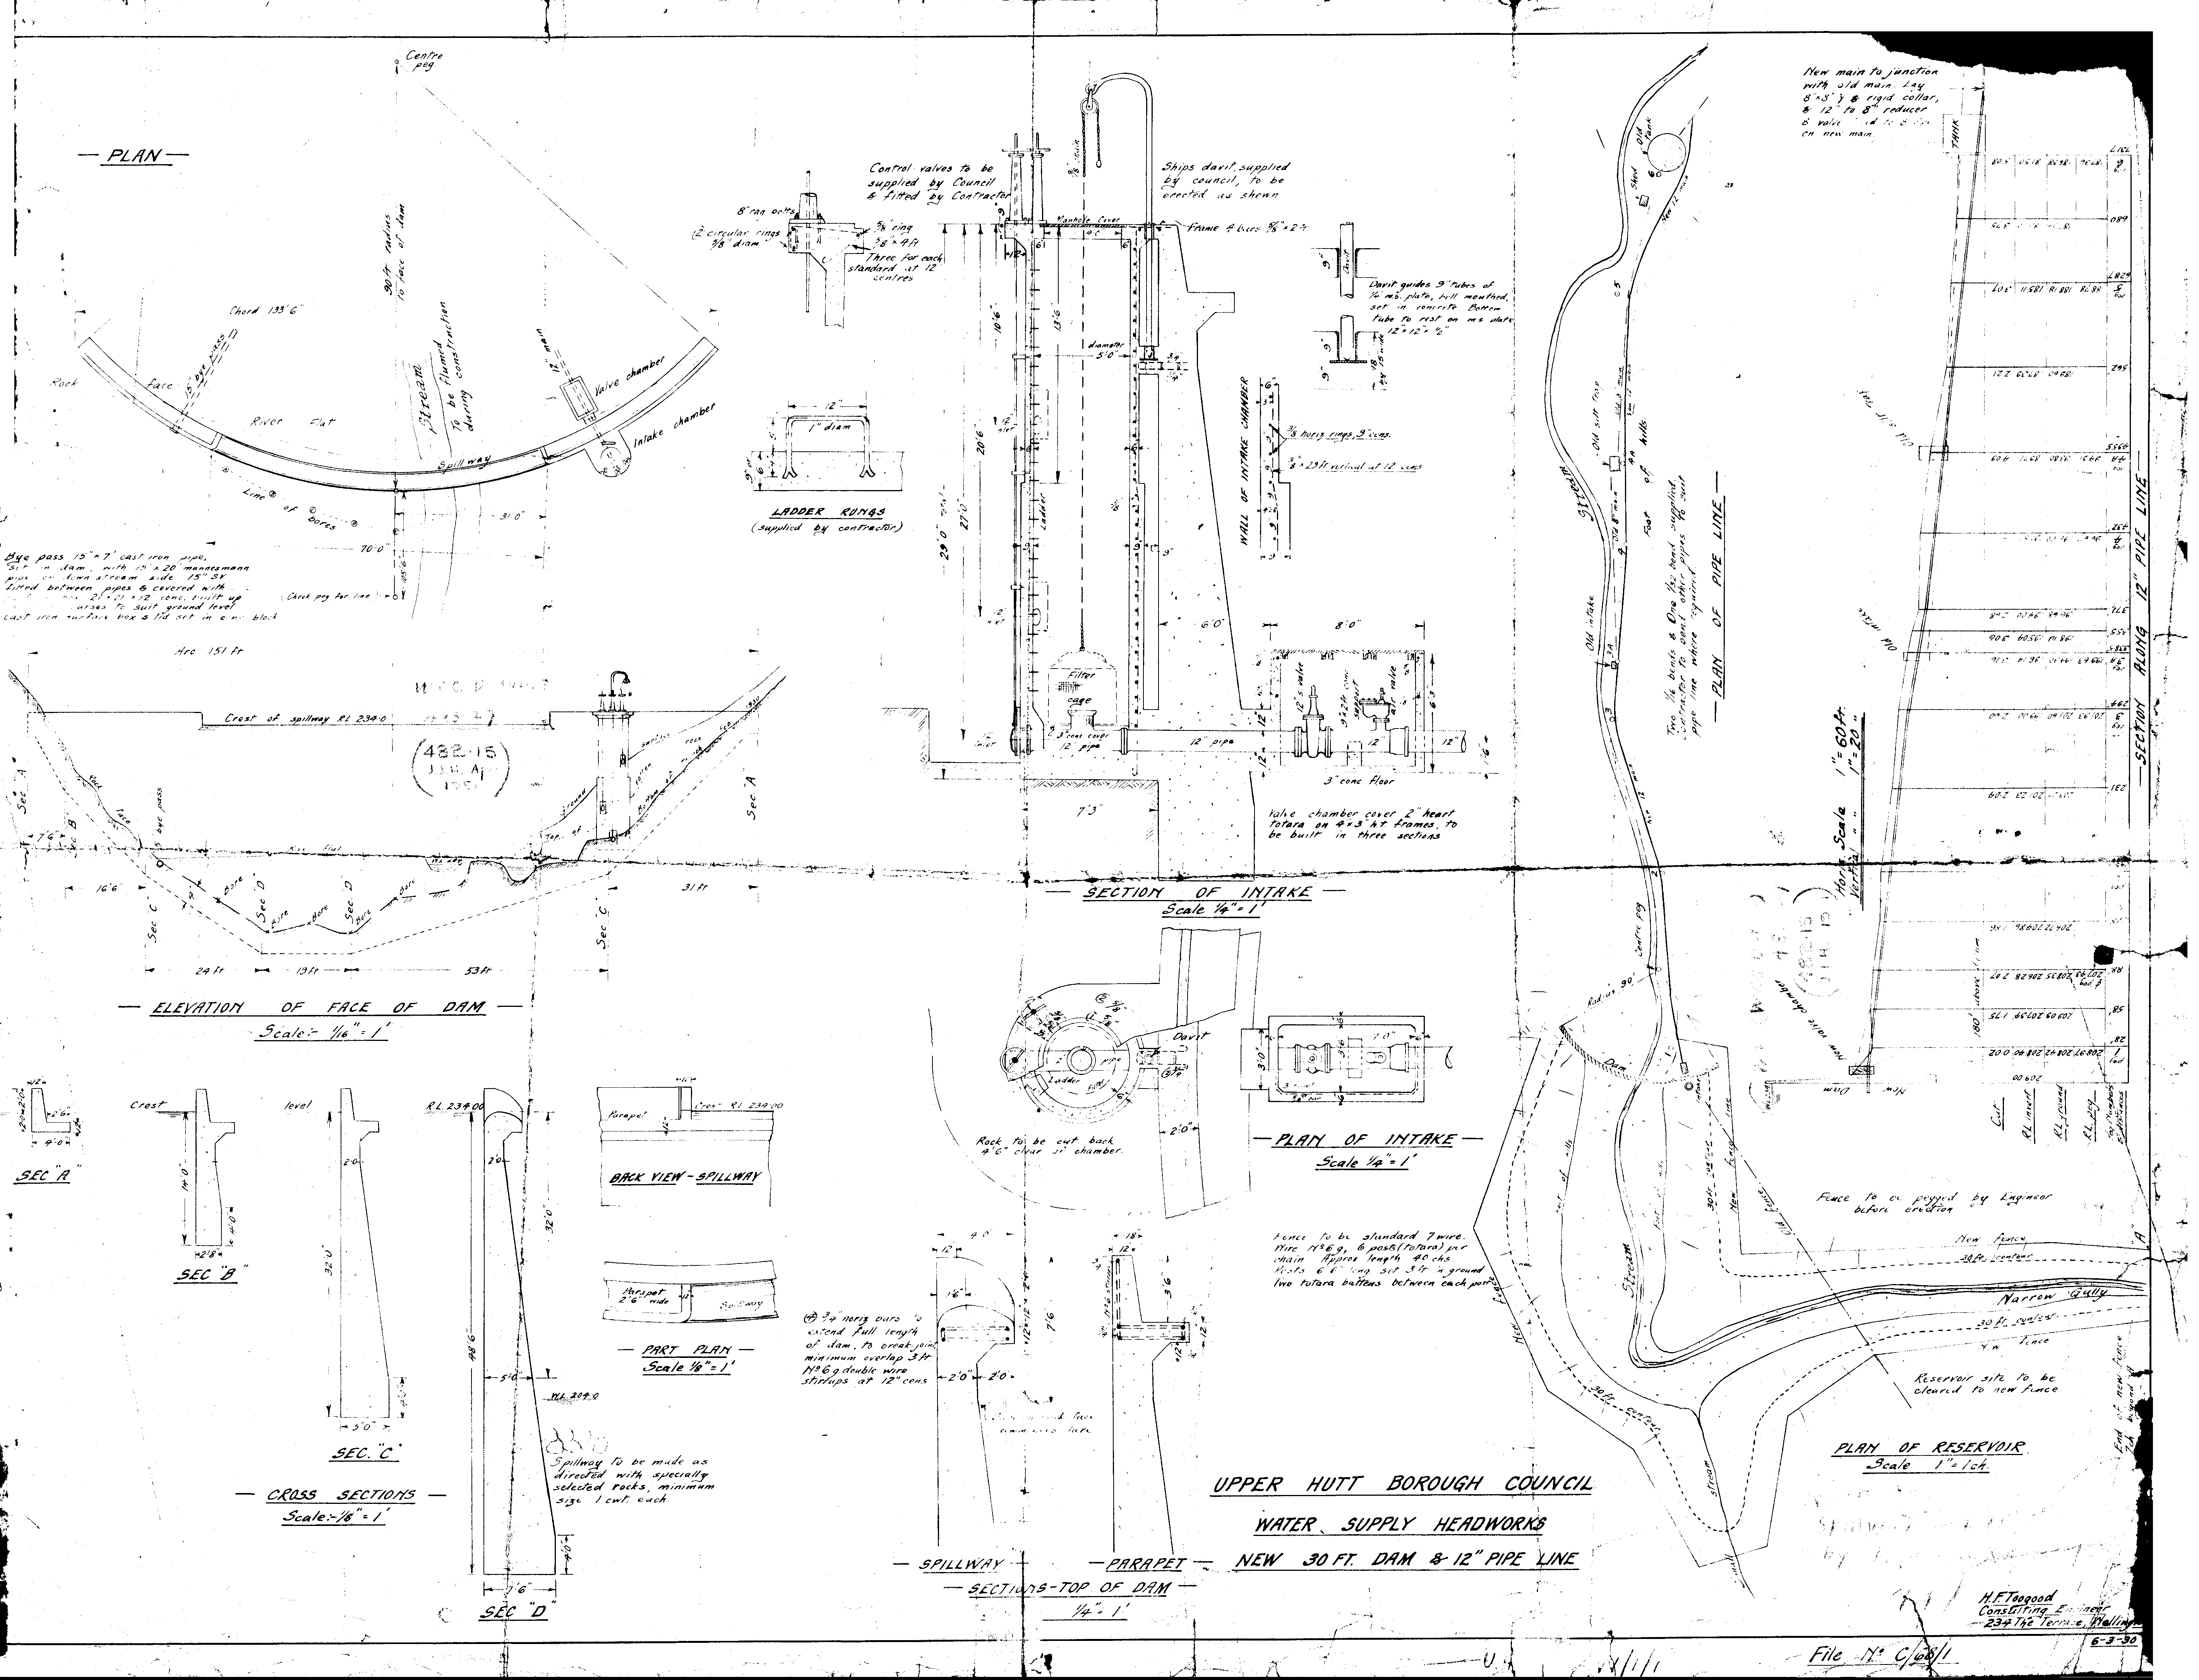
Greater Wel ington Regional Council (Parks)
Korokoro, Woollen Mills and Birchville Dams Safety Review 2013
Mar-13
APPENDIX B: PHOTOS FROM 2012 SAFETY REVIEW SITE INSPECTIONS
Damwatch Services Ltd
Job S1237 – Revision 0 for Client Comment March 2013
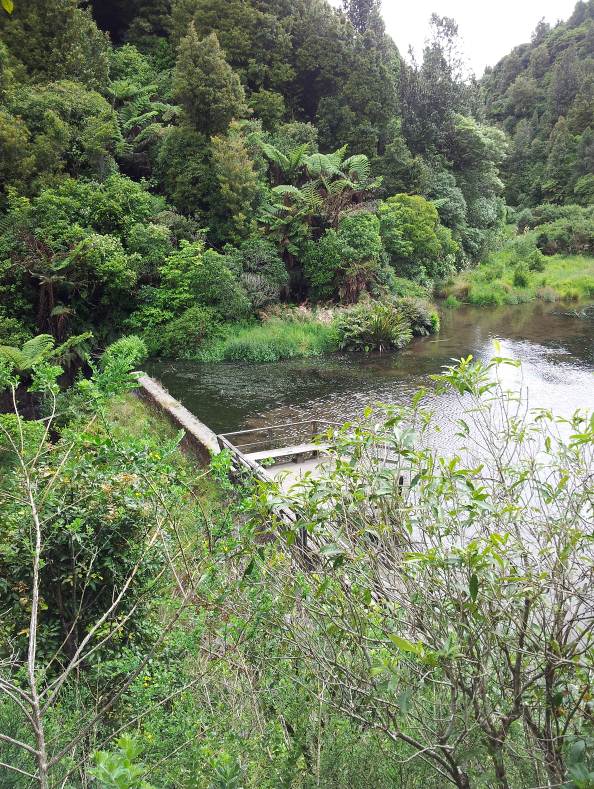
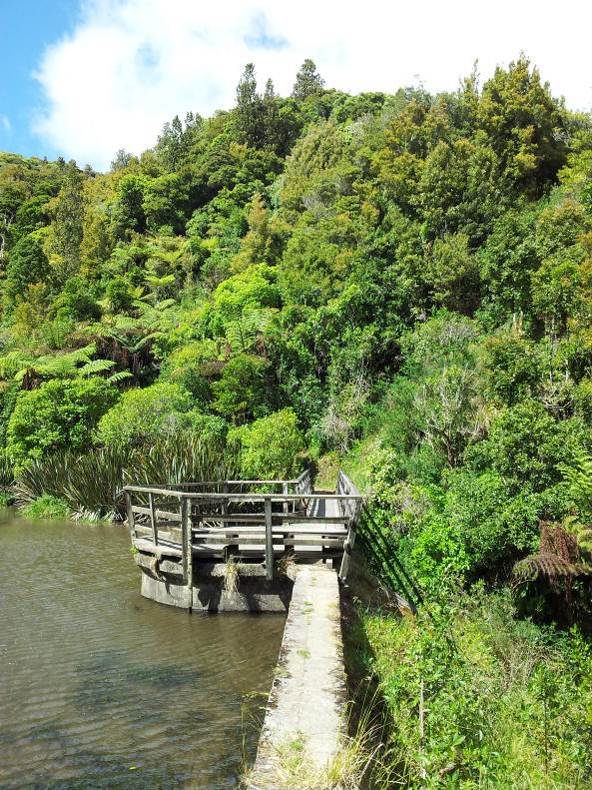
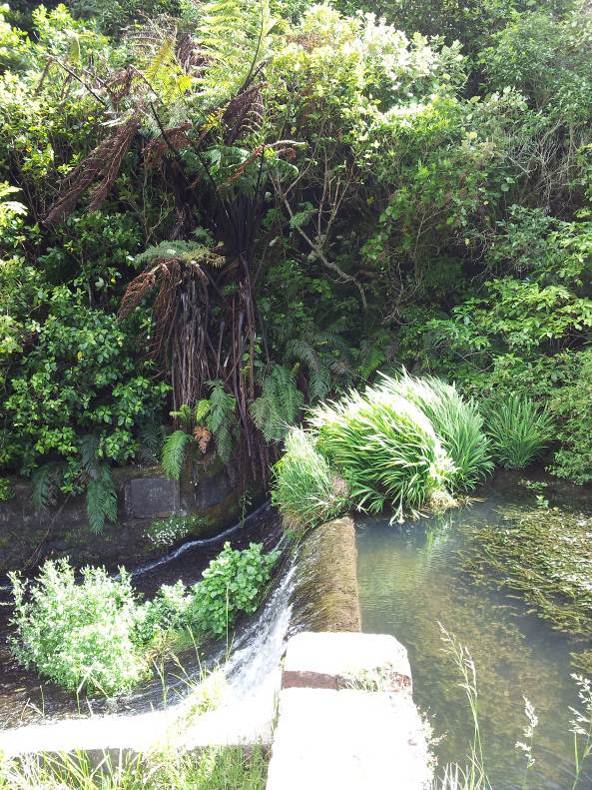
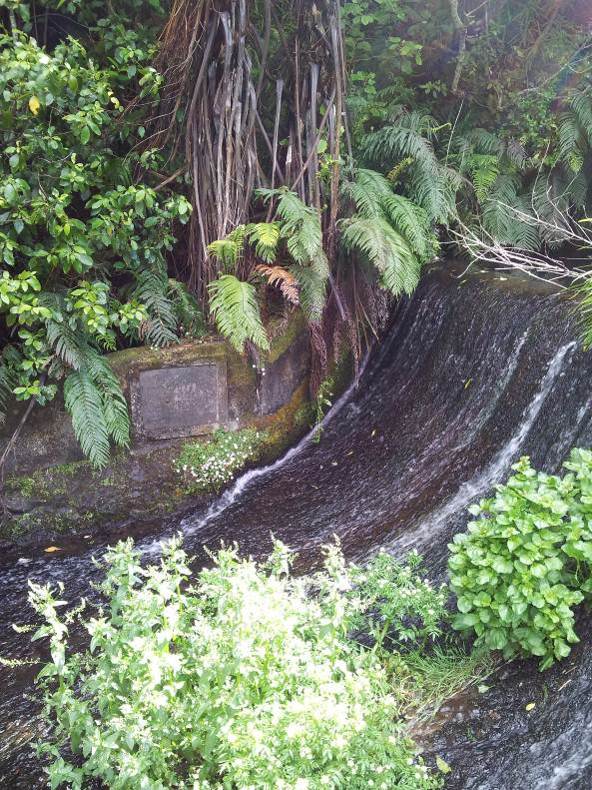
Greater Wel ington Regional Council (Parks)
Korokoro, Woollen Mills and Birchville Dams Safety Review 2013
Mar-13
KOROKORO DAM
Photo 1: Korokoro Dam looking upstream to
Photo 2: Korokoro Dam crest and left abutment.
head of reservoir. Spil way entrance in middle left.
Note vegetation on dam downstream face and groin.
Photo 3: Korokoro Dam spil way crest and right
Photo 4: Spil way crest and right abutment contact.
abutment. Note vegetation in spil way chute and on
abutment.
Damwatch Services Ltd
Job S1237 – Revision 0 for Client Comment March 2013
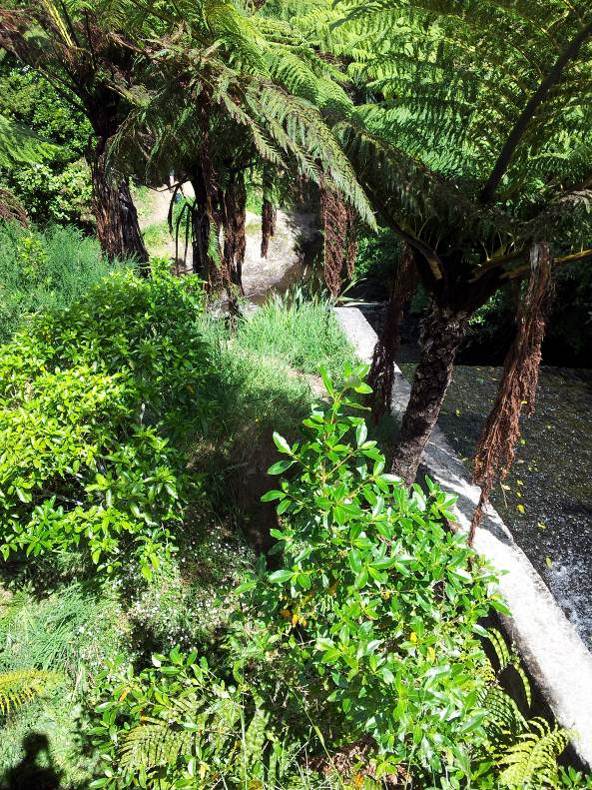
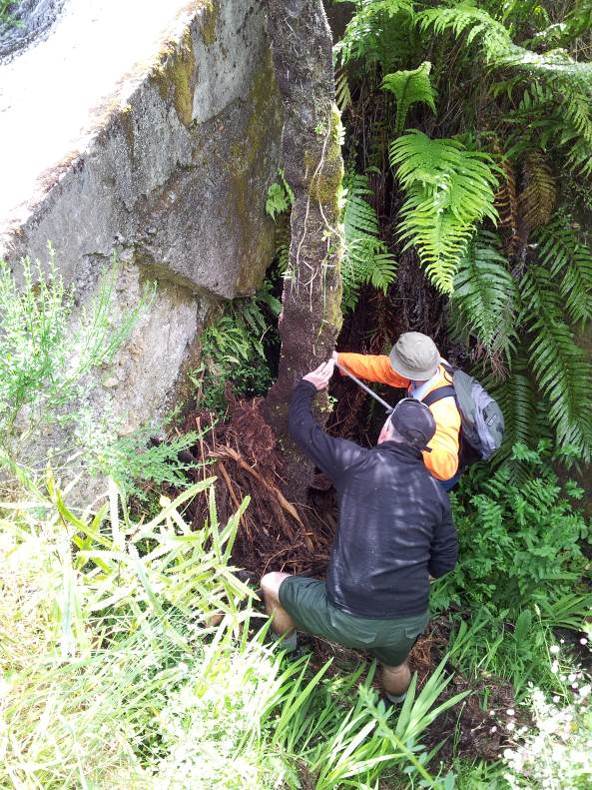
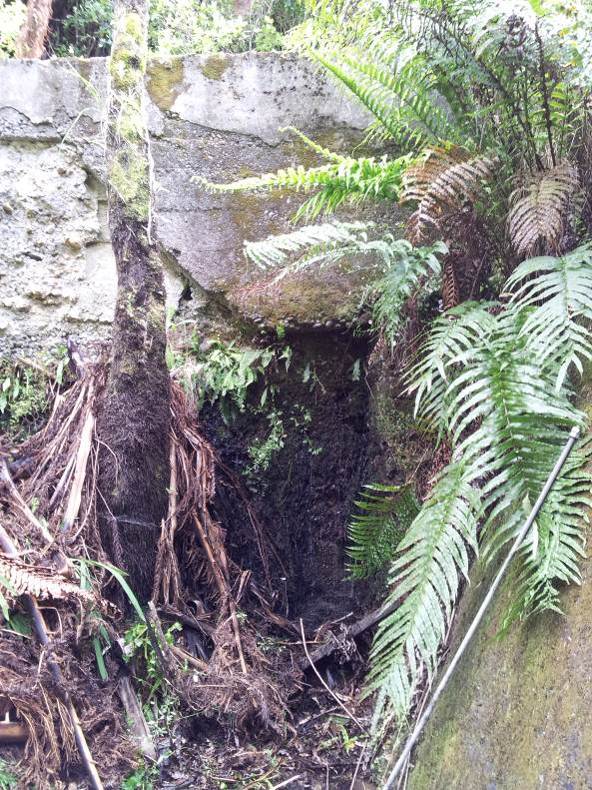
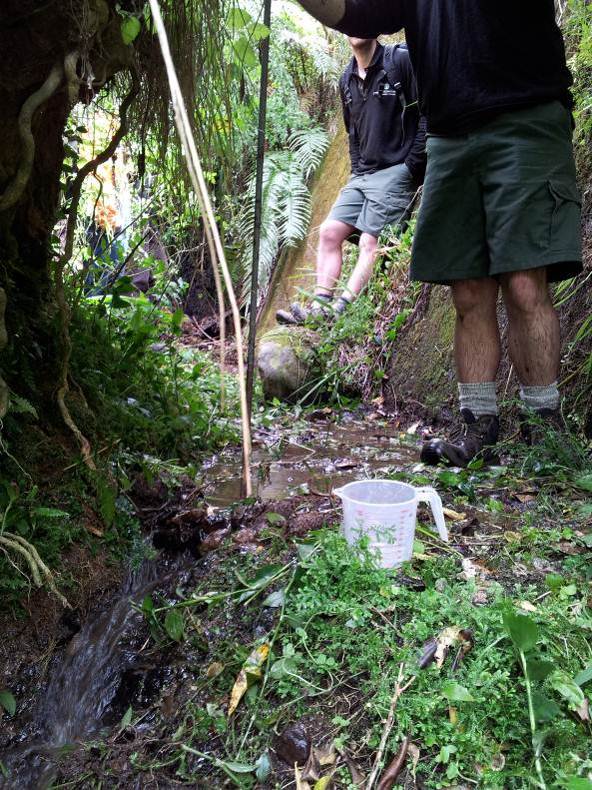
Greater Wel ington Regional Council (Parks)
Korokoro, Woollen Mills and Birchville Dams Safety Review 2013
Mar-13
Photo 5: Looking down spil way chute and adjacent
Photo 6: Seepage emerging from poor quality
to left wall.
concrete beneath spil way chute.
Photo 7: Seepage emerging from poor quality
Photo 8: Seepage flow from beneath spil way chute
concrete beneath spil way chute.
and dam toe approximately 12 litres per min.
Damwatch Services Ltd
Job S1237 – Revision 0 for Client Comment March 2013
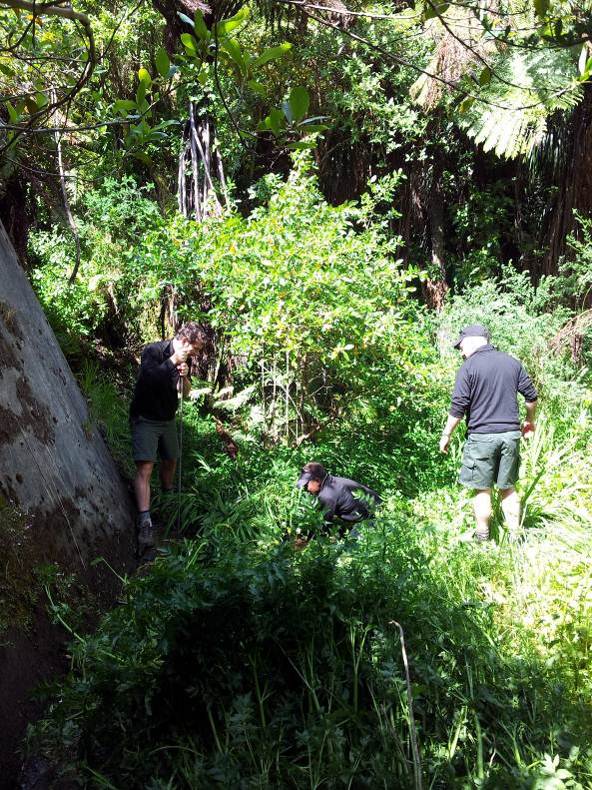
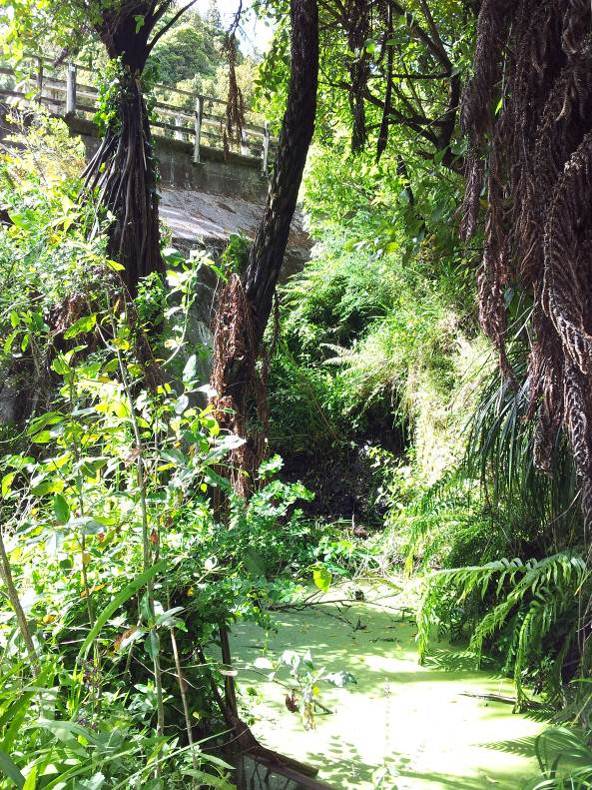

Greater Wel ington Regional Council (Parks)
Korokoro, Woollen Mills and Birchville Dams Safety Review 2013
Mar-13
Photo 9: Vegetation cover on dam toe looking toward Photo 10: Water ponded at left side toe.
left abutment.
Photo 11: Spil way chute, plunge pool and downstream toe. Outlet pipe amongst people standing right of
middle.
Damwatch Services Ltd
Job S1237 – Revision 0 for Client Comment March 2013
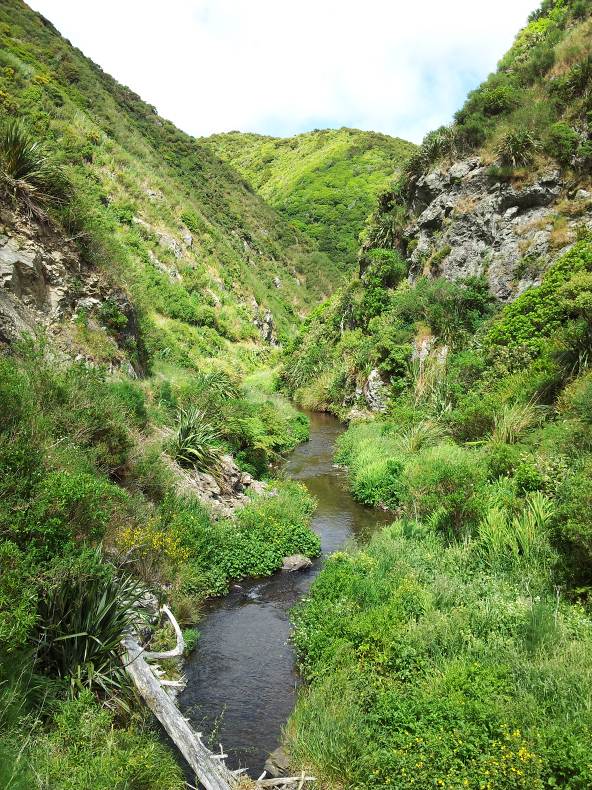
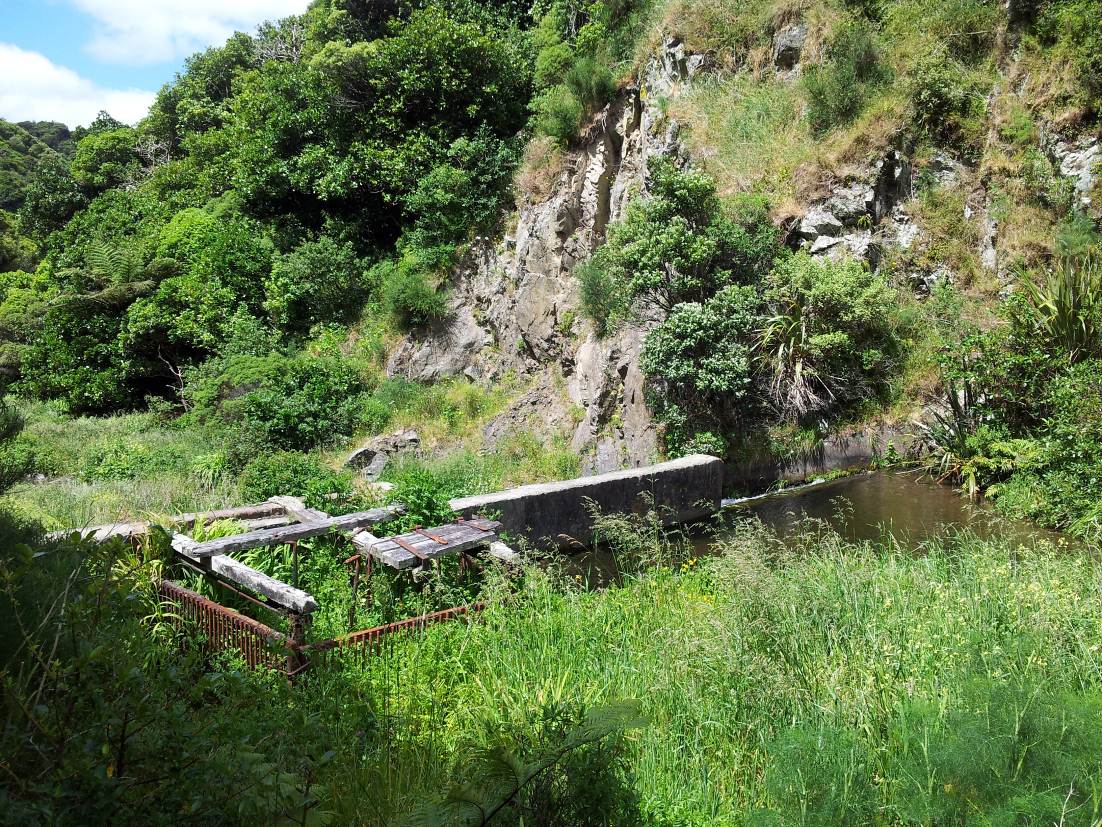
Greater Wel ington Regional Council (Parks)
Korokoro, Woollen Mills and Birchville Dams Safety Review 2013
Mar-13
WOOLLEN MILLS DAM
Photo 12: Typical valley profile downstream of
Korokoro Dam and upstream of Wool en Mil s Dam.
Photo taken in downstream direction.
Photo 13: Wool en Mil s dam and reservoir looking from upstream left abutment
toward downstream right abutment. Note that the impounded reservoir is very small.
Damwatch Services Ltd
Job S1237 – Revision 0 for Client Comment March 2013
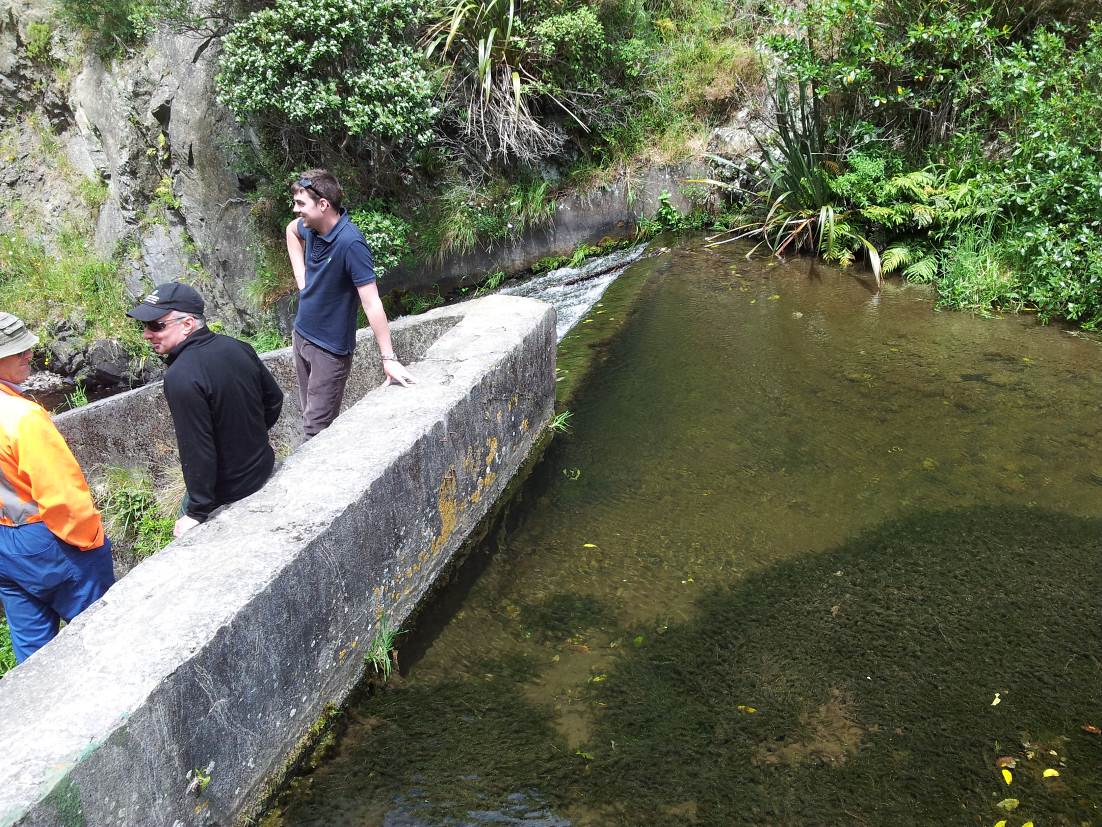
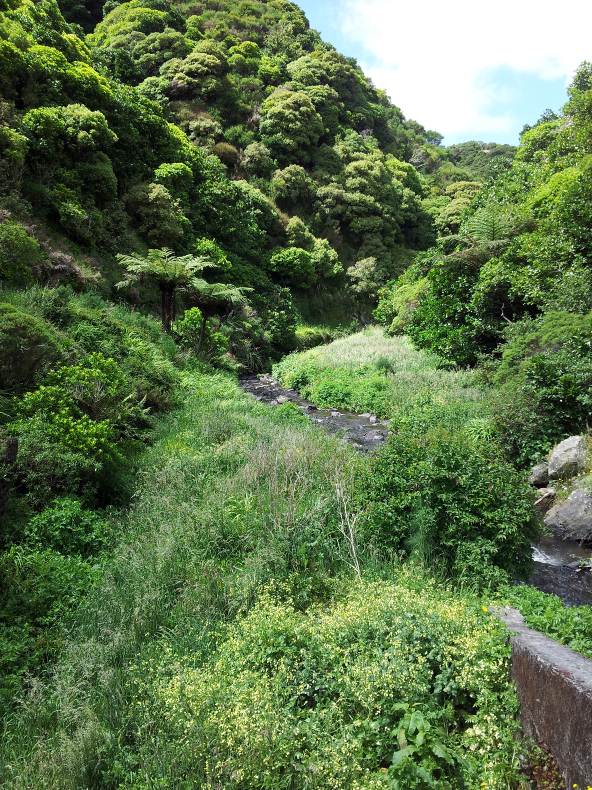
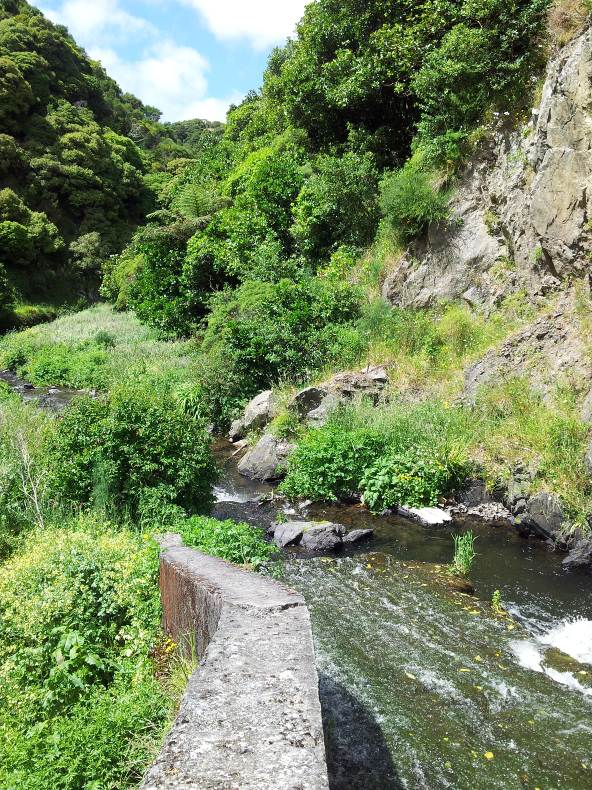
Greater Wel ington Regional Council (Parks)
Korokoro, Woollen Mills and Birchville Dams Safety Review 2013
Mar-13
Photo 14: Woollen Mills dam upstream face, spillway crest, and right abutment. Note shal ow
depth to impounded gravels (less than 0.5m).
Photo 15: Looking downstream between left
Photo 16: Woollen Mills spillway chute and wall
abutment and spil way chute wal .
looking downstream. Note rock-fall upper right in
photo.
Damwatch Services Ltd
Job S1237 – Revision 0 for Client Comment March 2013
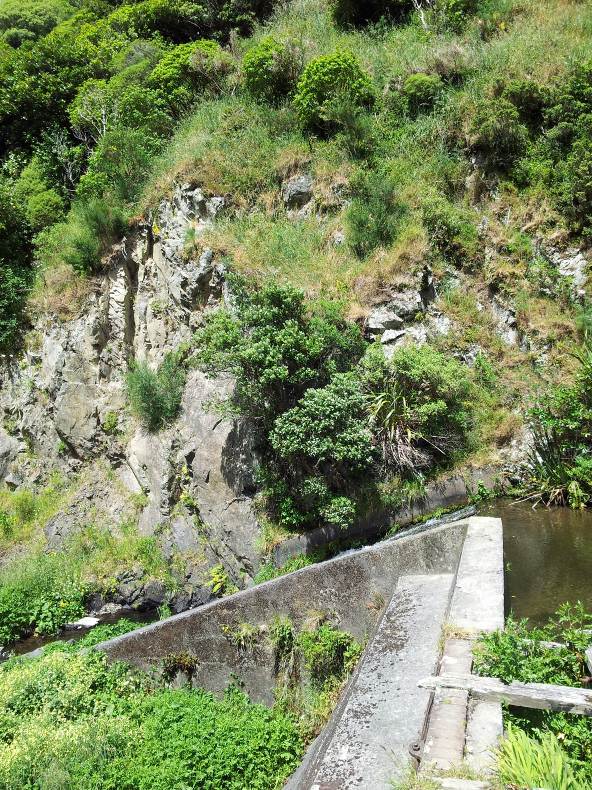
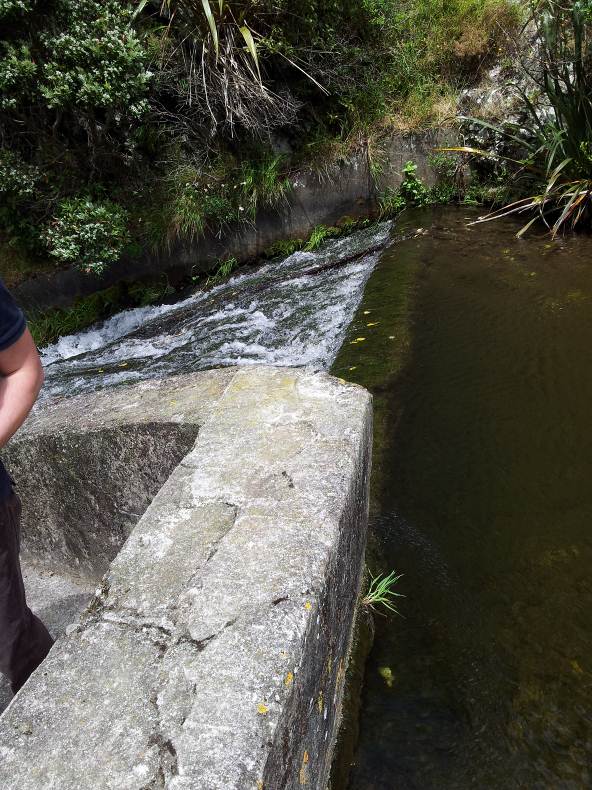
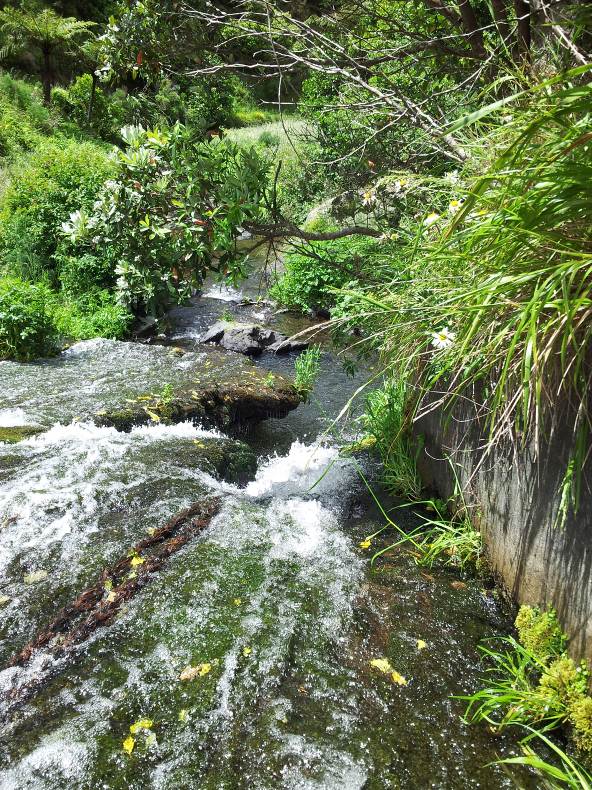

Greater Wel ington Regional Council (Parks)
Korokoro, Woollen Mills and Birchville Dams Safety Review 2013
Mar-13
Photo 17: Woollen Mills dam crest, spillway chute
Photo 18: Woollen Mills spillway crest and chute.
wall and right abutment. Note rock-fall middle left in Crack extends down spil way wal , across dam crest
photo.
wall and down upstream face toward spil way crest.
Photo 19: Spil way chute looking toward plunge
Photo 20: Spil way chute and chute wall. Dam toe
pool. Note chute damage and overhanging
obscured by vegetation.
vegetation.
Damwatch Services Ltd
Job S1237 – Revision 0 for Client Comment March 2013
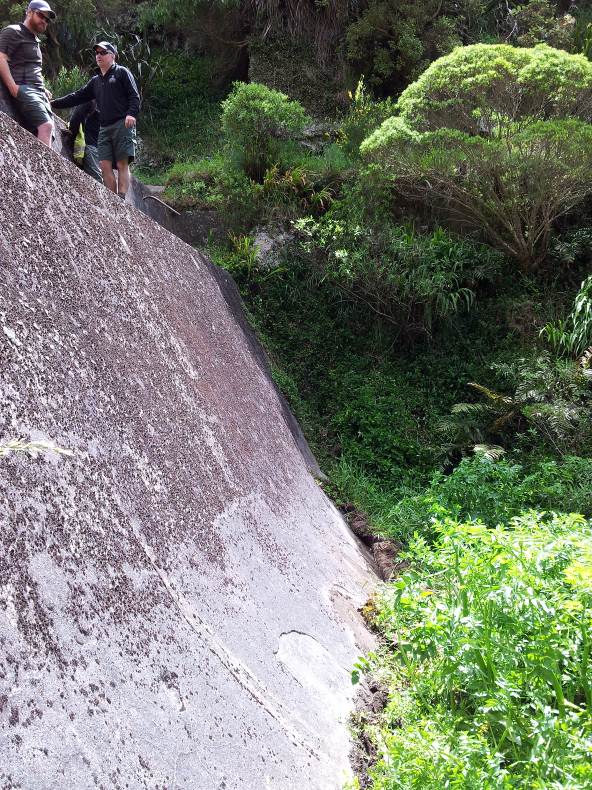
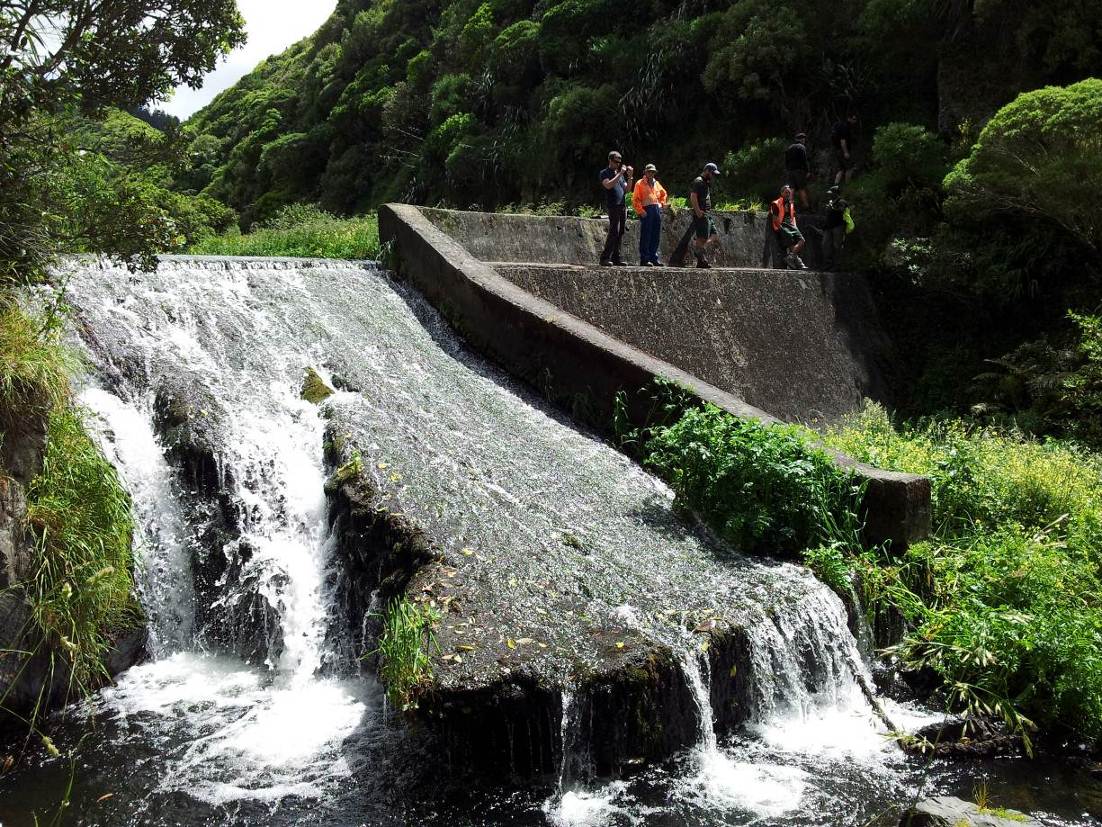
Greater Wel ington Regional Council (Parks)
Korokoro, Woollen Mills and Birchville Dams Safety Review 2013
Mar-13
Photo 21: Dam downstream face and left abutment
contact.
Photo 22: Wool en Mil s spil way and dam looking upstream from toe of rock-fall. Note damaged
spillway chute and major undermining. Probing with a long stick indicated a very large cavity under
the remaining chute slab in centre photo. Cavity horizontal extent approx. 1.5m and depth approx. 2m.
Damwatch Services Ltd
Job S1237 – Revision 0 for Client Comment March 2013
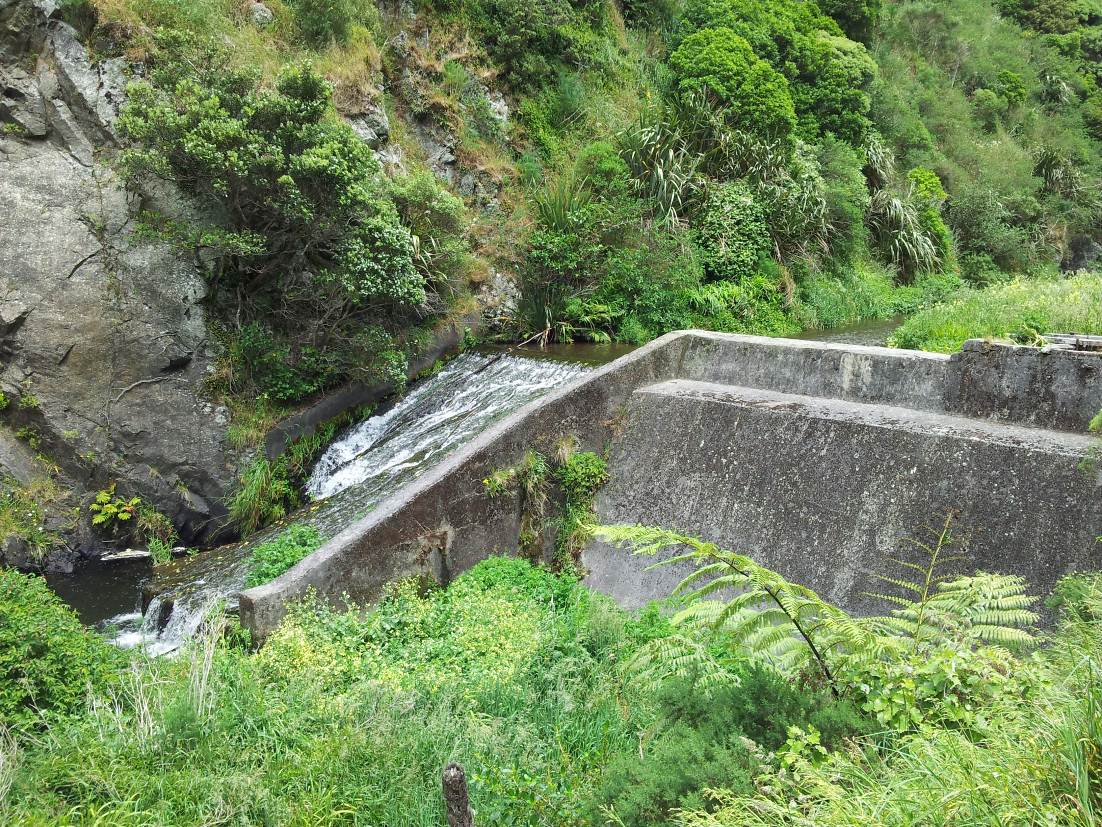
Greater Wel ington Regional Council (Parks)
Korokoro, Woollen Mills and Birchville Dams Safety Review 2013
Mar-13
Photo 23: Wool en Mil s spil way and dam looking upstream from downstream left abutment.
Note damaged spil way chute and visible extent of upstream regression.
Damwatch Services Ltd
Job S1237 – Revision 0 for Client Comment March 2013
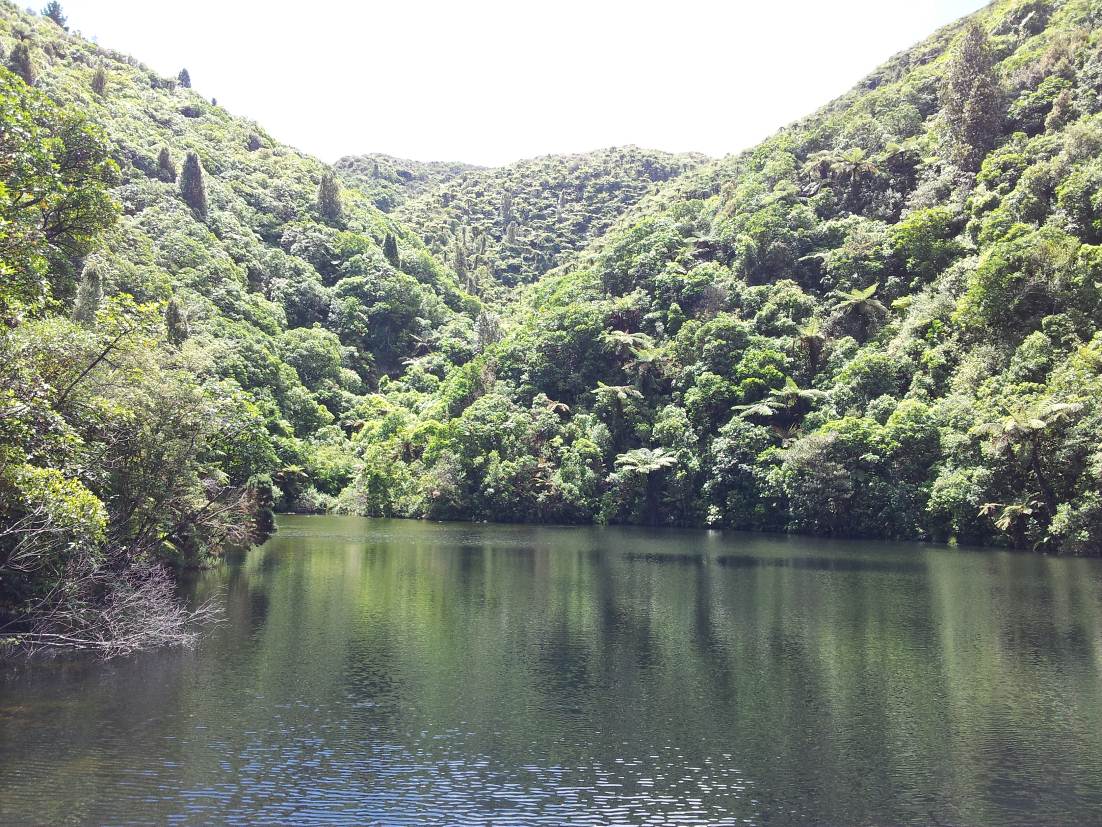
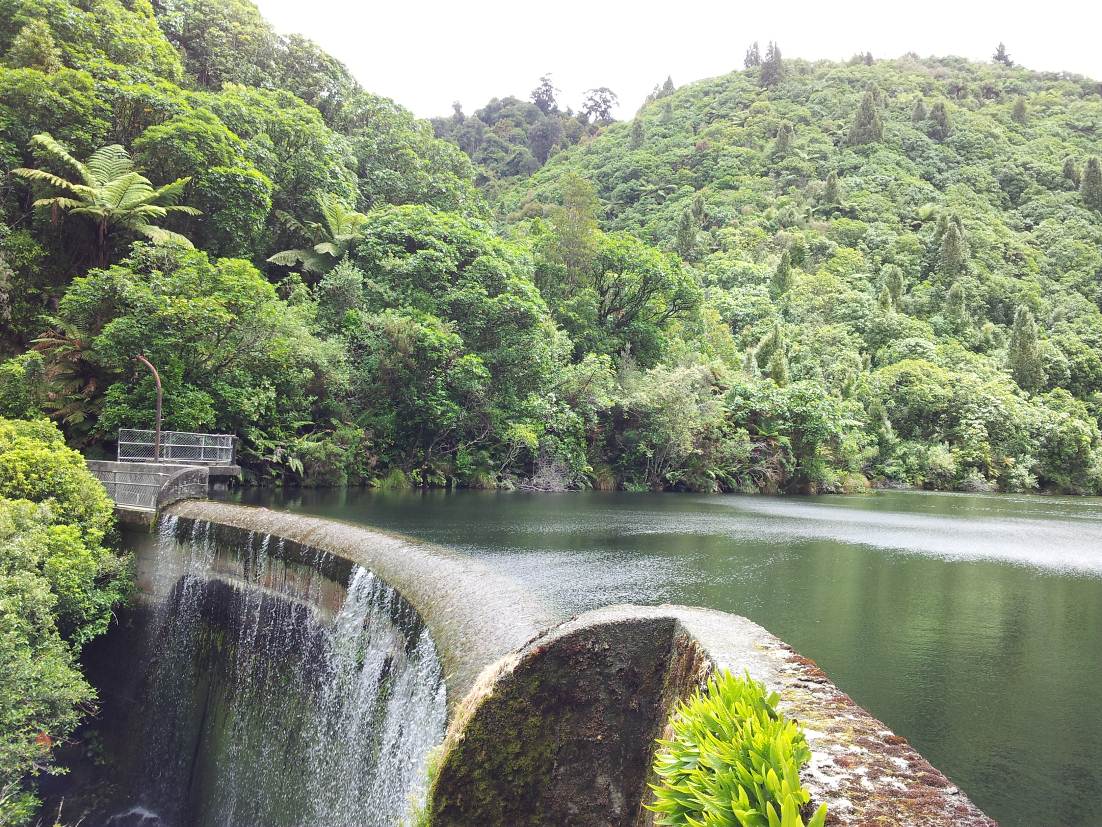
Greater Wel ington Regional Council (Parks)
Korokoro, Woollen Mills and Birchville Dams Safety Review 2013
Mar-13
BIRCHVILLE DAM
Photo 24: Birchville Dam reservoir
Photo 25: Birchvil e Dam spil way crest and right bank reservoir
Damwatch Services Ltd
Job S1237 – Revision 0 for Client Comment March 2013
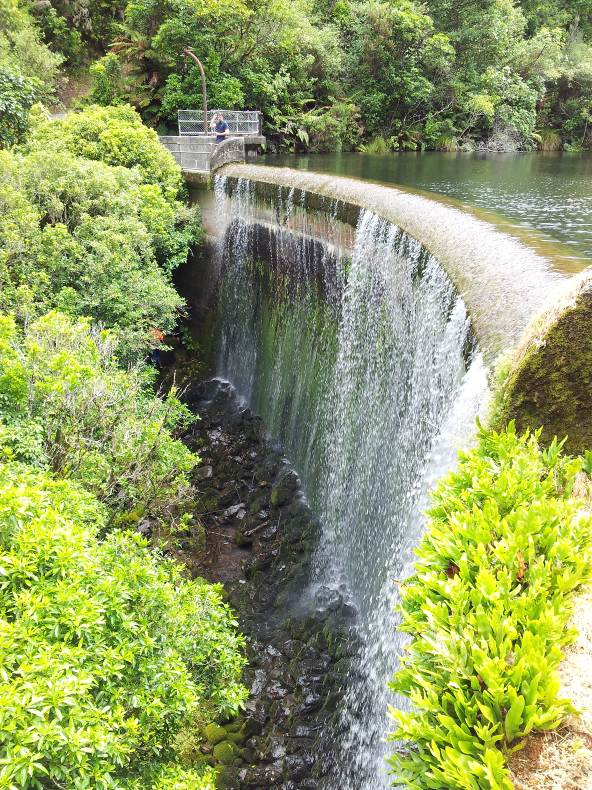
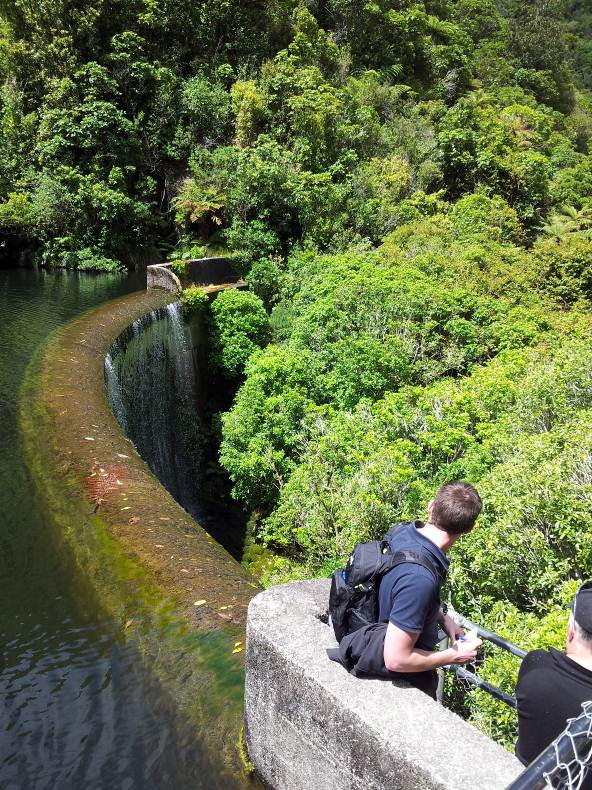
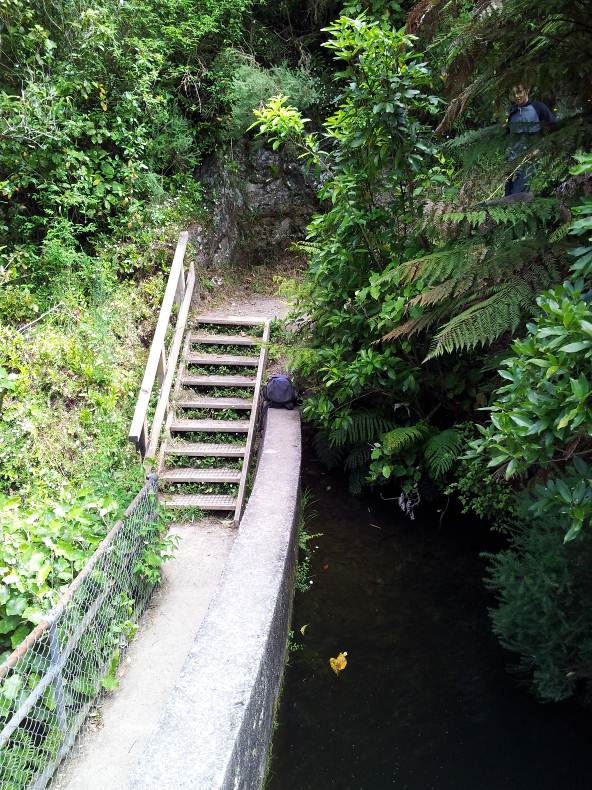
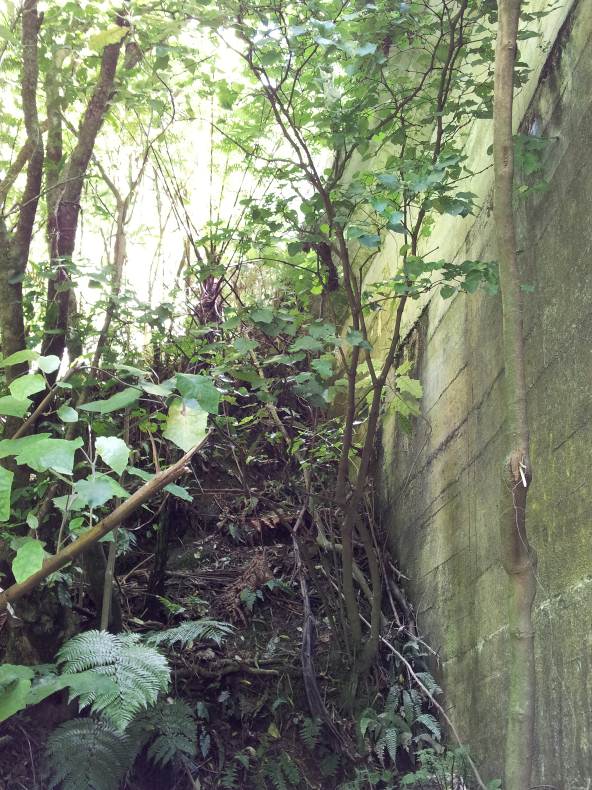
Greater Wel ington Regional Council (Parks)
Korokoro, Woollen Mills and Birchville Dams Safety Review 2013
Mar-13
Photo 26: Birchville Dam spil way crest and toe from Photo 27: Spil way crest and downstream left
left abutment.
abutment.
Photo 28: Dam contact with right abutment
Photo 29: Downstream contact with right abutment.
Damwatch Services Ltd
Job S1237 – Revision 0 for Client Comment March 2013
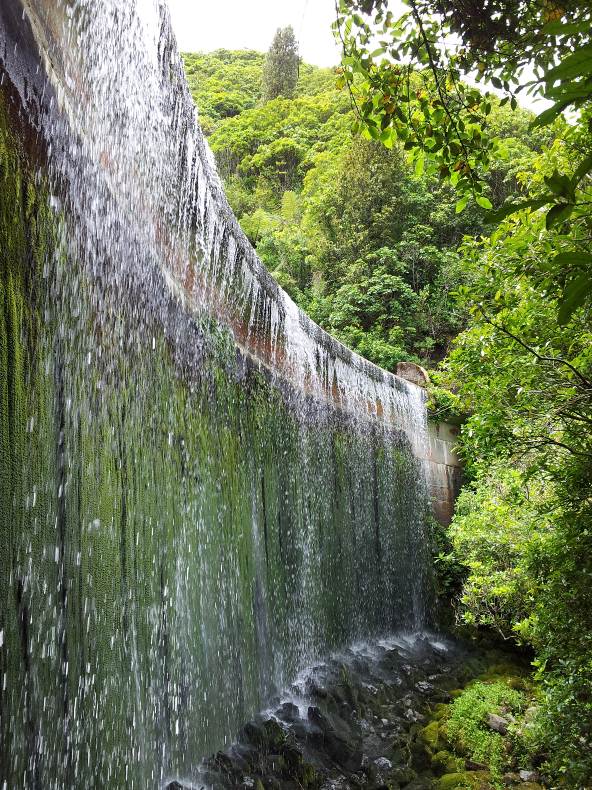
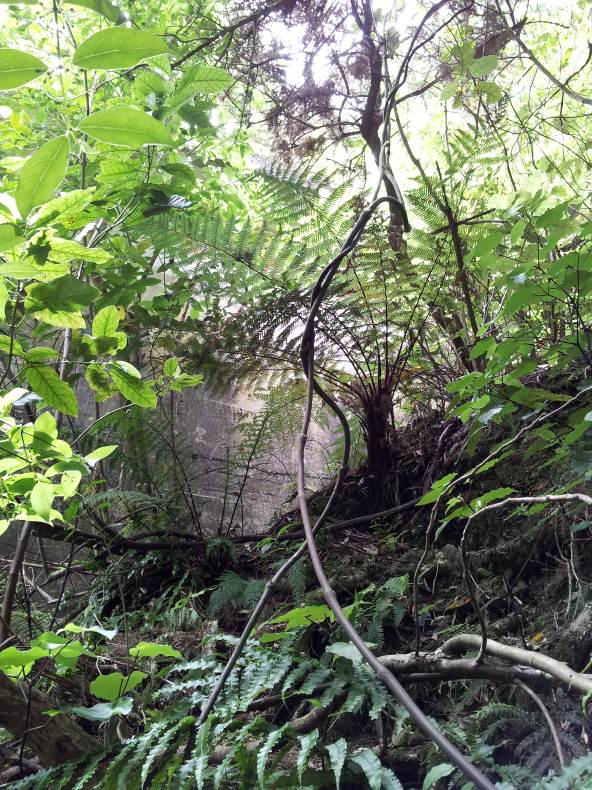
Greater Wel ington Regional Council (Parks)
Korokoro, Woollen Mills and Birchville Dams Safety Review 2013
Mar-13
Photo 30: Downstream toe looking towards left
Photo 31: Downstream contact with left abutment.
abutment.
Damwatch Services Ltd
Job S1237 – Revision 0 for Client Comment March 2013
Greater Wel ington Regional Council (Parks)
Korokoro, Woollen Mills and Birchville Dams Safety Review 2013
Mar-13
APPENDIX C: ROUTINE INSPECTION CHECKLISTS
Damwatch Services Ltd
Job S1237 – Revision 0 for Client Comment March 2013
Korokoro Dam Routine Inspection Checklist
Summary information:
Type
Concrete Gravity Dam
Height
8m
Storage volume
Approx 30,000 m3 (estimated in 2006).
Year constructed
1903
Key failure modes
FM1: Flood overtopping leading to uplift and/or undermining instability
FM2: Piping failure in the dam foundation under normal loading
FM3: Earthquake leading to significant structural damage
Special feature
Significant seepage at toe adjacent to spillway (FM2). Has increased
since safety review in 2006. Continue to monitor with numerical
measurement of seepage flow at collection point. Also monitor total
dam seepage adjacent to spillway plunge pool.
Inspected by:
Date and time of inspection:
Weather:
Inspection checklist:
Line Identifier
Item
Enter;
Comment if Changed or
0 for Ok/Normal,
other
1 for Changed, or
numerical value if
measurable.
1
KOROLAKE
Lake level in metres below (‐)
or above (+) spillway invert at
crest
2
KORO‐RES
Reservoir rim stability
3
KORO‐RABT
Right abutment stability
4
KORO‐LABT
Left abutment stability
5
KORO‐CREST
Crest of dam
6
KORO‐SPILL
Spillway
7
KORO‐PLUNGE
Spillway plunge pool
undermining.
8
KORO‐DSRABT
Downstream right abutment
stability and dryness
9
KOROFLOW1
Total dam seepage measured
adjacent to spillway plunge
pool. Time (seconds) to fill 1
litre.
10
KOROFLOW2
Seepage flow from dam toe
adjacent to spillway. Time
(seconds) to fill 1 litre.
11
KORO‐TOE
Dam toe dryness and
soundness
12
KORO‐DSLABT
Downstream left abutment
stability and dryness
GWRC Parks Dam Safety Routine Inspection Checklists
Damwatch Services Ltd, Jan 2013
Woollen Mills Dam Routine Inspection Checklist
Summary information:
Type
Concrete Gravity Dam
Height
6m
Storage volume
Approx <3,000 m3 (estimated in 2006).
Year constructed
1903
Key failure modes
FM1: Flood overtopping leading to uplift and/or undermining instability
FM2: Piping failure in the dam foundation under normal loading
FM3: Earthquake leading to significant structural damage
Special feature
Extensive undermining of lower spillway chute (FM1 & FM2).
Continue to monitor for gross worsening. Likely to require
remediation in future.
Inspected by:
Date and time of inspection:
Weather:
Inspection checklist:
Line Identifier
Item
Enter;
Comment if Changed or
0 for Ok/Normal,
other
1 for Changed, or
numerical value if
measurable.
1
WOOLLAKE
Lake level in metres below (‐)
or above (+) spillway invert at
crest
2
WOOL‐RES
Reservoir rim stability
3
WOOL‐RABT
Right abutment stability
4
WOOL‐LABT
Left abutment stability
5
WOOL‐CREST
Crest of dam
6
WOOL‐SPILL
Spillway
7
WOOL‐PLUNGE
Spillway plunge pool. Check
for worsening undermining.
8
WOOL‐DSRABT
Downstream right abutment
stability and dryness
9
WOOL‐TOE
Dam toe dryness and
soundness
10
WOOL‐DSLABT
Downstream left abutment
stability and dryness
GWRC Parks Dam Safety Routine Inspection Checklists
Damwatch Services Ltd, Jan 2013
Birchville Dam Routine Inspection Checklist
Summary information:
Type
Concrete Arch
Height
15m
Storage volume
Approx 20,000 m3
Year constructed
1930
Key failure modes
FM1: Abutment failure under normal loading
FM2: Earthquake leading to significant structural damage and/or
abutment failure
Special feature
Left abutment to be monitored for signs of seepage and instability
(FM1 & FM2). Surface weathering (e.g. scree) is ok.
Inspected by:
Date and time of inspection:
Weather:
Inspection checklist:
Line Identifier
Item
Enter;
Comment if Changed or
0 for Ok/Normal,
other
1 for Changed, or
numerical value if
measurable.
1
BRCHLAKE
Lake level in metres below (‐)
or above (+) spillway invert at
crest
2
BRCH‐RES
Reservoir rim stability
3
BRCH‐RABT
Right abutment stability
4
BRCH‐LABT
Left abutment stability
5
BRCH‐CREST
Crest of dam and spillway
6
BRCH‐DSRABT
Downstream right abutment
stability and dryness
7
BRCH‐TOE
Dam toe soundness (e.g.
erosion protection intact)
8
BRCH‐DSLABT
Downstream left abutment
stability and dryness.
GWRC Parks Dam Safety Routine Inspection Checklists
Damwatch Services Ltd, Jan 2013
Document Outline