 Suicide Facts
Deaths and intentional
self-harm hospitalisations
2012


Citation: Ministry of Health. 2015.
Suicide Facts: Deaths and intentional self-harm
hospitalisations 2012. Wellington: Ministry of Health.
Published in May 2015
by the Ministry of Health
PO Box 5013, Wellington 6145, New Zealand
ISBN: 978-0-478-44805-4 (online)
HP 6165
This document is available at www.health.govt.nz
This work is licensed under the Creative Commons Attribution 4.0 International licence. In essence, you are free
to: share ie, copy and redistribute the material in any medium or format; adapt ie, remix, transform and build upon the material.
Y ou must give appropriate credit, provide a link to the licence and indicate if changes were made.
Contents
Key points
vii
Suicide 2012
vii
Intentional self-harm hospitalisations 2012
viii
Introduction
1
Overview
1
Suicide deaths
2
Intentional self-harm hospitalisations
3
Data presentation
4
Suicide deaths in 2012
6
Age
8
Ethnicity
15
Deprivation
22
Urban and rural suicide rates
24
District health board region
26
Methods of suicide
29
International comparisons
34
Intentional self-harm hospitalisations in 2012
36
Overview
36
Sex
37
Age
38
Ethnicity
41
Deprivation
48
District health board regions
50
References
54
Appendices
55
Appendix 1: Technical notes
55
Appendix 2: Definitions
57
Appendix 3: Further tables
62
Further information
64
Suicide Facts: Deaths and intentional self-harm hospitalisations 2012
iii
List of Tables
Table 1: Suicide deaths and age-standardised rates, by sex, 2003–2012
6
Table 2: Suicide deaths, age-specific rates and suicides as a percentage of all deaths, by
five-year age group and sex, 2012
10
Table 3: Age-specific suicide rates, by life-stage age group, 2012
11
Table 4: Youth suicide age-specific rates, ages 15–24 years, by sex, 2003–2012
12
Table 5: Suicide deaths, by ethnicity, life-stage group and sex, 2012
15
Table 6: Suicide deaths and age-standardised rates, Māori and non-Māori, by sex, 2003–
2012
17
Table 7: Youth suicide deaths and age-specific rates, Māori and non-Māori, by sex, 2003–
2012
20
Table 8: Suicide deaths and age-standardised rates, by deprivation quintile and sex, 2012
22
Table 9: Suicide deaths and rates, by urban/rural profile, life-stage age group and sex,
2012
25
Table 10: Suicide age-standardised deaths, by DHB regions, 2008–2012
27
Table 11: Methods used for suicide deaths, 2003–2012
30
Table 12: Intentional self-harm hospitalisation numbers and age-standardised rates, by
sex, 2003–2012
37
Table 13: Intentional self-harm hospitalisation numbers and rates, by sex and five-year
age group, 2012
38
Table 14: Youth intentional self-harm hospitalisation numbers and age-specific rates, by
sex, 2003–2012
39
Table 15: Intentional self-harm hospitalisation numbers and rates, by ethnicity and sex,
2008–2012
42
Table 16: Intentional self-harm hospitalisations, by ethnicity, life-stage age group and sex,
2012
43
Table 17: Youth intentional self-harm hospitalisation numbers and age-specific rates,
Māori and non-Māori, by sex, 2003–2012
47
Table 18: Intentional self-harm hospitalisation numbers and age-standardised rates, by
deprivation quintile and sex, 2012
48
Table 19: Intentional self-harm hospitalisation age-standardised rates, by DHB of domicile
and sex, 2010–2012
50
Table A1: Intentional self-harm categories and ICD-10-AM codes
57
Table A2: The WHO World Standard Population
58
Table A3: Intentional self-harm short-stay emergency department hospitalisations, by
DHB of domicile, 2003–2012
62
Table A4: Intentional self-harm hospitalisations within two days of a previous intentional
self-harm hospitalisation, by DHB of domicile, 2003–2012
63
iv
Suicide Facts: Deaths and intentional self-harm hospitalisations 2012
List of Figures
Figure 1: Suicide age-standardised rates, 1948–2012
7
Figure 2: Suicide age-standardised rates, by sex, 1948–2012
7
Figure 3: Suicide as a percentage of all deaths, by age group and sex, 2012
8
Figure 4: Age-specific suicide rates, by five-year age group and sex, 2012
9
Figure 5: Age-specific suicide rates, by life-stage age group, 1948–2012
11
Figure 6: Age-specific suicide rates for youth, ages 15–24 years, by sex, 1948–2012
12
Figure 7: Age-specific suicide rates, ages 25–44 years, by sex, 1948–2012
13
Figure 8: Age-specific suicide rates, ages 45–64 years, by sex, 1948–2012
14
Figure 9: Age-specific suicide rates, ages 65 years and over, by sex, 1948–2012
14
Figure 10: Suicide rates, by ethnic group, 2008–2012
16
Figure 11: Age-standardised suicide rates, Māori and non-Māori, 2003–2012
18
Figure 12: Age-standardised suicide rates, Māori and non-Māori, by sex, 2003–2012
18
Figure 13: Youth age-specific suicide rates, by ethnic group, 2003–2012
21
Figure 14: Youth age-specific suicide rates, by ethnic group and sex, 2003–2012
21
Figure 15: Age-standardised suicide rates, by deprivation quintile, 2012
23
Figure 16: Age-standardised suicide rates, by deprivation quintile and sex, 2012
23
Figure 17: Suicides by deprivation quintile and life-stage age group, 2012
24
Figure 18: Suicide rates, by urban/rural profile and sex, 2012
24
Figure 19: Suicide rates, by urban/rural profile and life-stage age group, 2012
25
Figure 20: Age-standardised suicide rates, by DHB regions, 2008–2012
28
Figure 21: Youth age-specific suicide rates, by DHB regions, 2008–2012
28
Figure 22: Comparison of DHB region suicide rates with the national rate, 2008–2012
29
Figure 23: Methods used for suicide deaths, by sex, 2012
31
Figure 24: Methods used for suicide deaths, 2003–2012
31
Figure 25: Methods used for suicide deaths, by sex and life-stage age group, 2012
33
Figure 26: Suicide age-standardised rates for OECD countries, by sex
34
Figure 27: Youth (15–24 years) suicide age-specific rates for OECD countries, by sex
35
Figure 28: Intentional self-harm hospitalisation age-standardised rates, 2003–2012
36
Figure 29: Intentional self-harm hospitalisation age-standardised rates, by sex, 2003–
2012
37
Figure 30: Intentional self-harm hospitalisation age-specific rates, by age group and sex,
2012
39
Figure 31: Youth (15–24 years) intentional self-harm hospitalisation age-specific rates, by
sex, 2003–2012
40
Figure 32: Intentional self-harm hospitalisation age-standardised rates, by ethnic group,
2008–2012
42
Figure 33: Intentional self-harm hospitalisation age-standardised rates, Māori and non-
Māori, 2003–2012
44
Suicide Facts: Deaths and intentional self-harm hospitalisations 2012
v
Figure 34: Intentional self-harm hospitalisation age-standardised rates for Māori and
non-Māori, by sex, 2003–2012
45
Figure 35: Youth intentional self-harm hospitalisation age-specific rates, by ethnic group,
2003–2012
46
Figure 36: Youth intentional self-harm hospitalisation age-specific rates, by ethnic group
and sex, 2003–2012
46
Figure 37: Intentional self-harm hospitalisation age-standardised rates, by deprivation
quintile and sex, 2012
49
Figure 38: Intentional self-harm hospitalisation age-standardised rates, by DHB, 2010–
2012
51
Figure 39: Comparison of DHB region intentional self-harm hospitalisation rates with
national rate, 2010–2012
51
Figure 40: Intentional self-harm hospitalisation age-standardised rates for males, by DHB
and ethnic group, 2010–2012 (aggregated data)
52
Figure 41: Intentional self-harm hospitalisation age-standardised rates for females, by
DHB and ethnic group, 2010–2012 (aggregated data)
53
vi
Suicide Facts: Deaths and intentional self-harm hospitalisations 2012
Key points
Suicide 2012
Overview
A total of 549 people died by suicide in New Zealand in 2012. Almost 75% of these suicides
were male.
The age-standardised suicide rate decreased by 19.5% from the peak rate of 15.1 deaths per
100,000 population in 1998 to 12.2 deaths per 100,000 population in 2012.
Sex
There were 404 male suicides (18.1 per 100,000 males) and 145 female suicides (6.4 per
100,000 females) in 2012.
For every female suicide, there were 2.8 male suicides.
Since 1948, the suicide rate for females has remained relatively stable. The male suicide rate
for 2012 was 24.3% lower than its highest rate in 1995.
Age
The highest rate of suicide in 2012 was in the youth age group (15–24 years) at 23.4 per
100,000 youths.
Suicide rates decreased with age: the suicide rate for adults aged 25–44 years was 15.8 per
100,000 adults in that age group; the rate decreased to 12.9 per 100,000 adults aged
45–64 years.
Adults aged 65 years and over had the lowest suicide rate (9.3 per 100,000 adults aged
65+ years).
Youth (15–24 years)
In 2012, there were 107 male and 43 female youth suicides (32.3 and 13.8 per 100,000 males
and females respectively).
The Māori youth suicide rate was 2.8 times the non-Māori youth rate (48.0 per 100,000
Māori youths compared with 17.3 per 100,000 non-Māori youths).
Over the 10 years from 2003 to 2012, Māori youth suicide rates have been at least 1.7 times
the non-Māori youth suicide rates.
Ethnicity
There were 120 Māori and 429 non-Māori suicide deaths in 2012.
Māori had an age-standardised suicide rate of 17.8 per 100,000 Māori, compared with the
non-Māori rate of 10.6 per 100,000 non-Māori.
There were 30 suicide deaths among Pacific people and 23 among Asian people.
Over the 10 years from 2003 to 2012, Māori suicide rates have been at least 1.2 times non-
Māori suicide rates.
Suicide Facts: Deaths and intentional self-harm hospitalisations 2012
vii
Deprivation
In 2012, the suicide rate was highest among those who resided in deprivation quintile 4 and
lowest in quintile 1 (14.0 per 100,000 quintile 4 population compared with 6.6 per 100,000
quintile 1 population).
Suicide rates in both quintile 1 and 2 were significantly lower than suicide rates for those
residing in quintiles 3–5.
Urban/rural profile
The suicide rate was 14.6 per 100,000 population in rural areas and 12.0 per 100,000
population in urban areas.
District health board (DHB) region
Based on aggregated data for the five-year period 2008–2012, Bay of Plenty, South
Canterbury and Southern DHBs had significantly higher suicide rates than the national rate.
Waitemata, Auckland and Capital & Coast DHB regions had significantly lower suicide rates
than the national rate.
Intentional self-harm hospitalisations 2012
Overview
There were 3031 intentional self-harm hospitalisations in New Zealand in 2012. Two-thirds
of these were female.
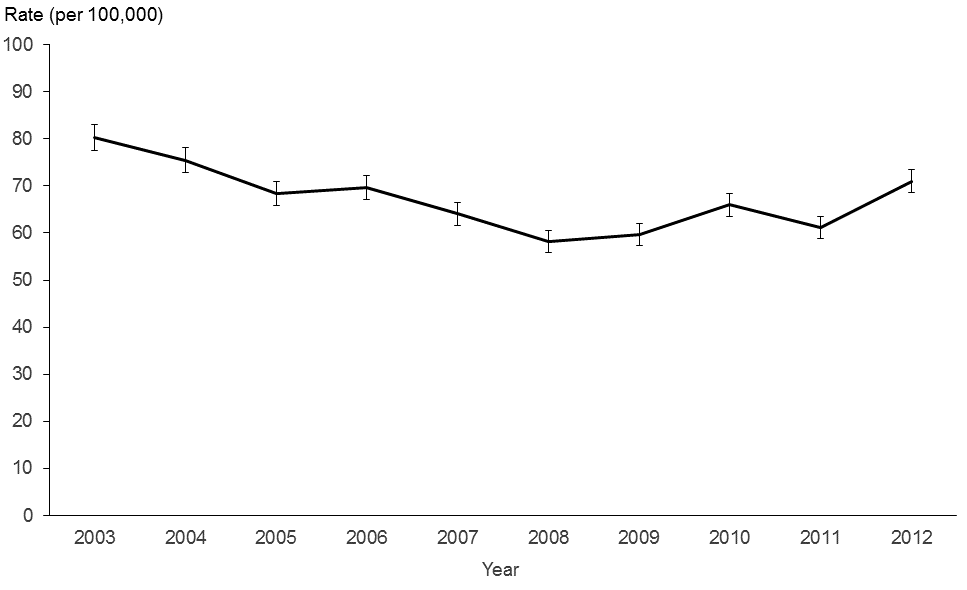
Over the 10-year period 2003–2012, the rate of self-harm hospitalisations decreased by 11.5%
from 80.3 per 100,000 population in 2003 to 71.0 per 100,000 population in 2012.
Sex
In 2012, the female rate of intentional self-harm hospitalisation was more than twice the
male rate (96.1 per 100,000 females compared with 46.4 per 100,000 males).
Between 2003 and 2012, the female rate of intentional self-harm hospitalisation remained at
least 1.7 times the male rate.
Age
In 2012, the highest rate of intentional self-harm hospitalisations for both males and females
was in the 15–19 years age group (103.1 per 100,000 15–19 years males and 279.5 per
100,000 15–19 years females).
Female rates were significantly higher than male rates for all five-year age groups except in
those aged 75+ years, where they were significantly lower.
Youth (15–24 years)
Youth accounted for 34.7% (1052) of all intentional self-harm hospitalisations in 2012.
The female rate of intentional self-harm hospitalisations was 2.4 times the male rate
(233.7 per 100,000 females and 98.4 per 100,000 males).
Ethnicity
In 2012, Māori accounted for nearly 20% (563) of all intentional self-harm hospitalisations.
viii
Suicide Facts: Deaths and intentional self-harm hospitalisations 2012
The age-standardised rate for Māori was 85.0 per 100,000 Māori compared with 68.0 per
100,000 non-Māori.
There were 101 intentional self-harm hospitalisations of Pacific people and 97 of Asian
people.
Deprivation
In 2012, intentional self-harm hospitalisation rates generally increased with deprivation; the
highest rate was in those residing in deprivation quintile 4 and the lowest in quintile 1
(90.9 per 100,000 quintile 4 population compared with 49.6 per 100,000 quintile 1
population).
For both males and females, rates in the least deprived quintile (1) were significantly lower
than rates in more deprived quintiles (3–5).
District health board (DHB) region
Based on aggregated data from 2010–2012, eight DHBS had significantly higher rates of
intentional self-harm hospitalisations than the national rate in 2012. Wairarapa DHB region
had the highest age-standardised rate of intentional self-harm hospitalisations (169.0 per
100,000 population).
Auckland, Counties Manukau, Hawke’s Bay and MidCentral DHB regions had significantly
lower rates of intentional self-harm hospitalisations than the national rate.
Suicide Facts: Deaths and intentional self-harm hospitalisations 2012
ix
Introduction
Suicide and suicidal behaviours continue to be a major public health issue in New Zealand.
Every year more than 500 New Zealanders take their lives and there are over 2,500 admissions1
to hospital for serious self-harm. These are not just numbers; they may be our friends, our
neighbours, our work colleagues or our family members. Every suicide or act of intentional self-
harm is an indication of profound emotional distress. The impact on family, friends and
communities can be devastating, far reaching and long lasting. But suicide is preventable.
The purpose of this report is to present numbers, trends and demographic profiles of people
who die by suicide or seriously harm themselves. Understanding this data is important for
policy makers, clinicians and others who work to prevent suicide and intentional self-harm.
It is important to recognise that the motivation for intentional self-harm varies, and therefore
hospitalisation data for self-harm is not a measure of suicide attempts.
Although this report provides statistical suicide and intentional self-harm hospitalisation data, it
does not attempt to explain causes of suicidal behaviour or causes of changes to suicide or
intentional self-harm hospitalisation rates. Nor does it discuss measures to reduce suicide or
intentional self-harm.
Numerous factors influence a person’s decision to take their own life or to self-harm. The
number of suicides and self-harm hospitalisations can also vary considerably from year to year.
It is therefore difficult to quantify the precise effect that programmes such as suicide
prevention-related initiatives and significant events, for instance the 2010 and 2011 earthquakes
in the Canterbury region, have on suicide and suicidal behaviour.
Suicide prevention in New Zealand is guided by the
New Zealand Suicide Prevention Strategy
2006–2016 (Associate Minister of Health 2006) and the
New Zealand Suicide Prevention
Action Plan 2013–2016 (Ministry of Health 2013).
Suicide Facts and other annual data updates
assist in monitoring and evaluating the progress and success of implementing the strategy and
action plan.
Overview
This report presents suicide data by sex, age (including in specific regard to youth aged
15–24 years), ethnicity, deprivation quintile, district health board (DHB) region of domicile and
urban/rural profile. It also provides some international comparisons.
Intentional self-harm hospitalisation data is presented by sex, age (including in specific regard
to youth aged 15–24 years), ethnicity, deprivation quintile and DHB region of domicile.
Definitions of these terms are provided in Appendix 2: Definitions.
The online tables that accompany this report provide the underlying data for some graphs
presented in the report as well as time-series data.
1 See Appendix 2: Definitions for an explanation of the term ‘admission’.
Suicide Facts: Deaths and intentional self-harm hospitalisations 2012
1
Suicide deaths
Data sources
All New Zealand suicide data in this report was extracted from the
Ministry of Health’s
Mortality Collection (MORT) on 1 October 2014. The data for other Organisation for Economic
Co-operation and Development (OECD) countries was sourced from the OECD.
MORT contains data on all deaths registered in New Zealand. Death and stillbirth registration
data is sent electronically to MORT monthly from Births, Deaths, Marriages and Citizenship. In
addition, the Ministry receives medical certificates of causes of death (completed by certifying
doctors) from funeral directors, as well as coronial findings relating to deaths from Coronial
Services of New Zealand (Ministry of Justice). Each death is then assigned an underlying cause
of death code by the Ministry of Health, using the International Statistical Classification of
Diseases and Related Health Problems, 10th Revision, Australian Modification (ICD-10-AM),
sixth Edition (National Centre for Classification in Health 2008).
Classification of a suicide death
In New Zealand, a death is only officially classified as suicide by the coroner on completion of
the coroner’s inquiry. In some cases, an inquest may be heard several years after the death,
particularly if there are factors relating to the death that need to be investigated first (for
example, a death in custody). Consequently, a provisional suicide classification may be made
before the coroner reaches a verdict.
The 2012 suicide data used in this report is provisional. There were 14 deaths registered in 2012
that were still subject to coroners’ findings with no provisional cause of death assigned to them
at the time of data extraction (1 October 2014). Although these deaths are not included in this
report, some may later be classified as suicide. For this reason, the number of provisionally
classified deaths from suicide in 2012 presented in this report may differ slightly from the
number, for the same year, presented in future reports, when the data has been finalised. The
Ministry will release the final data in the publication
Mortality and Demographic Data 2012.
The suicide data in this report is based on deaths that were registered in 2012 with Births,
Deaths, Marriages and Citizenship. While most deaths are registered in the year in which the
death occurred, a few deaths (approximately 2%) are registered in later years.
Comparisons with other statistical publications on suicide
The number of suicide deaths in this report differs from the number released by the Chief
Coroner. The Chief Coroner’s data includes all deaths initially identified at the coroner’s office as
self-inflicted. However, only those deaths determined as ‘intentional’ after investigation will
receive a final verdict of suicide. Some deaths provisionally coded as suicide may later be
determined not to be suicide.
The Ministry reports on those deaths determined to be suicide after a completed coronial
process or those provisionally coded as intentionally self-inflicted deaths before the final
coroner’s verdict. Furthermore, the Chief Coroner’s data relates to years ending 30 June rather
than the calendar years used in this report.
2
Suicide Facts: Deaths and intentional self-harm hospitalisations 2012
The Office of the Director of Mental Health releases an annual report that contains some
statistics on suicide that are not included in this report:
www.health.govt.nz/publication/office-director-mental-health-annual-report-2013
The data-filtering methods used in this report mean that the hospital data in this publication
cannot be compared with versions of this series preceding the 2006 report.
Intentional self-harm hospitalisations
Data source
Intentional self-harm hospitalisation data presented in this report was extracted from the
Ministry’
s National Minimum Dataset (NMDS) on 1 October 2014. The NMDS is a national
collection of public and private hospital discharge information, including clinical information,
for inpatients and day patients.
The NMDS is used for policy formation, performance monitoring, research and review. It
provides statistical information, reports and analyses of trends in delivering hospital inpatient
and day patient health services both nationally and on a provider basis. It is also used for
funding purposes.
Data has been submitted electronically in an agreed format by public hospitals since 1993.
Data exclusions
For data comparability purposes, the total number of self-harm hospitalisations excludes two
categories of patients:
1.
Patients discharged from an emergency department after a length of stay of one day or less
(Appendix 3, Table A3). It is evident from Table A3 that these events were reported very
differently across the individual DHBs between 2003 and 2012.
2.
Patients admitted for an intentional self-harm incident within two days of a previous
intentional self-harm hospitalisation (Appendix 3, Table A4). It is not unusual for patients
to be transferred between hospitals after an intentional self-harm event. DHBs record
these transfers as new admissions. Such admissions usually occur within two days of a
previous hospitalisation discharge, thereby artificially inflating the numbers of recorded
admissions.
These exclusions allow the best possible identification of real trends in intentional self-harm
behaviour within the New Zealand population, as well as optimal regional comparisons given
that DHBs differ in admission practices, which results in differences in the data reported. The
Ministry is endeavouring to address inconsistencies in data collection; however, filtering cannot
completely eliminate differences caused by different methods of managing patients and keeping
records.
Therefore the intentional self-harm hospitalisations data in this report does not represent the
total number of people receiving hospital treatment for intentional self-harm or treatment
events. Even once consistency issues between DHBs have been addressed, the total extent of
intentional self-harm will still be difficult to capture because many people who intentionally
self-harm do not seek hospital treatment.
Suicide Facts: Deaths and intentional self-harm hospitalisations 2012
3
It is important to note that hospitalisations for intentional self-harm represent individual events
of self-harm rather than individual people; that is, a single person can contribute multiple
unique intentional self-harm events to the data set or be hospitalised more than once for the
same self-harm event.
Data presentation
Numbers and rates
Data is presented primarily as numbers and rates. Two rates are presented: age-specific and
age-standardised. Age-specific rates are calculated to measure the frequency of suicide or self-
harm hospitalisation for specific age groups (eg, five-year age group and life-stage age group).
Age-standardised rates are calculated to measure the frequency of suicide or self-harm
hospitalisations in a group and are adjusted to take account of differences in age distribution of
the population over time or between groups.
Rates for specific groups (eg, Māori, residents of quintile 3, females, and populations in DHB
regions) are calculated using the best available population for that specific group. More
information about populations used in this report can be found in Appendix 1: Technical notes.
All percentage calculations comparing numbers or rates between years have been undertaken
using the raw data. Due to rounding, this may mean the resultant information is slightly
different to any calculations based on tabular data supplied in this report.
Time trends
Publication
Suicide data is presented either from 1948 to 2012 (comparable data first became available in
1948) or from 2003 to 2012 (to provide a 10-year time trend). Where Asian age-standardised
rates are presented, the data is restricted to 2008 to 2012.
Intentional self-harm hospitalisation data is presented from 2003 to 2012 to provide a 10-year
time trend.
Online tables
The accompanying suicide tables include data from 1948 to 2012 for major breakdowns and
from 1996 to 2012 for Māori and non-Māori breakdowns. Intentional self-harm hospitalisation
data is presented from 1996 to 2012. Hospitalisation data can only be compared consistently
back to 1996 because of changes in the recording and reporting of ethnicity data from July 1995.
District health board region
Age-standardised rates were calculated for each district health board (DHB) region of domicile.
The suicide data for DHB regions was aggregated over five years (2008–2012), and the
intentional self-harm hospitalisation data was aggregated over three years (2010–2012) since
rates can vary considerably from year to year for each DHB.
When interpreting regional differences in hospitalisation rates for intentional self-harm among
DHBs, it should be noted that DHBs differ in their reporting and patient management practices.
4
Suicide Facts: Deaths and intentional self-harm hospitalisations 2012
The figures also provide 99% confidence intervals to aid interpretation. Where a DHB region’s
confidence interval crosses the national rate, this means that the DHB region’s suicide or
intentional self-harm hospitalisation rate was not statistically significantly different from the
national rate. Previous versions of
Suicide Facts presented information on Southland and Otago
DHBs. In 2010, these merged to form Southern DHB, therefore
Suicide Facts 2012 presents
information for Southern DHB.
Suicide Facts: Deaths and intentional self-harm hospitalisations 2012
5
Suicide deaths in 2012
A total of 549 people died in New Zealand by suicide in 2012. This equates to an age-
standardised rate of 12.2 suicide deaths per 100,000 population (Table 1).
Comparable data first became available in 1948. Since then, the suicide rate for the whole
population reached its highest in 1998. The rate generally declined between 1998 and 2012,
decreasing overall by 19.5% (Figure 1).
Sex
In 2012, a total of 404 males and 145 females died by suicide, which equates to rates of
18.1 deaths per 100,000 male population and 6.4 deaths per 100,000 female population.
Since records began in 1948, the female rate has remained relatively unchanged, but the male
rate has fluctuated. In 2012, the male rate was 24.3% lower than its highest rate in 1995. Over
time, the male suicide rate has been consistently higher than the female suicide rate; in 2012,
there were 2.8 male suicides for every female suicide (Table 1, Figure 2).
Groups with high suicide rates
In 2012 markedly higher rates of suicide were recorded in males, particularly youth (aged 15–24
years) and those aged 40–44 years, and Māori (compared with non-Māori). Māori males and
Māori youth showed especially high suicide rates. Further data for these groups is presented in
later sections of this report.
Table 1: Suicide deaths and age-standardised rates, by sex, 2003–2012
Year
Male
Female
Total
Sex rate ratio
(Male:Female)
Number
Rate
Number
Rate
Number
Rate
2003
376
18.4
141
6.6
517
12.4
2.8
2004
379
18.6
109
5.2
488
11.7
3.6
2005
380
18.6
131
6.0
511
12.2
3.1
2006
388
18.6
138
6.3
526
12.2
3.0
2007
371
17.4
116
5.0
487
11.0
3.5
2008
381
17.6
139
6.2
520
11.8
2.8
2009
393
17.9
117
5.0
510
11.3
3.6
2010
386
17.3
149
6.6
535
11.8
2.6
2011
377
17.0
116
5.1
493
10.9
3.4
20121
404
18.1
145
6.4
549
12.2
2.8
Source: New Zealand Mortality Collection
Note: rates are expressed per 100,000 population and age-standardised to the World Health Organization (WHO)
World Standard population.
1
Provisional (see Appendix 2: Definitions).
6
Suicide Facts: Deaths and intentional self-harm hospitalisations 2012
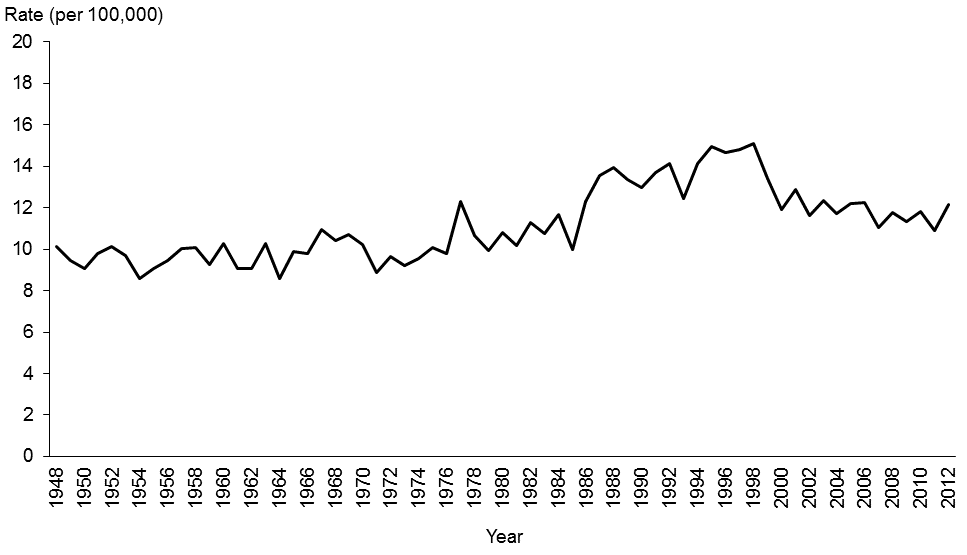
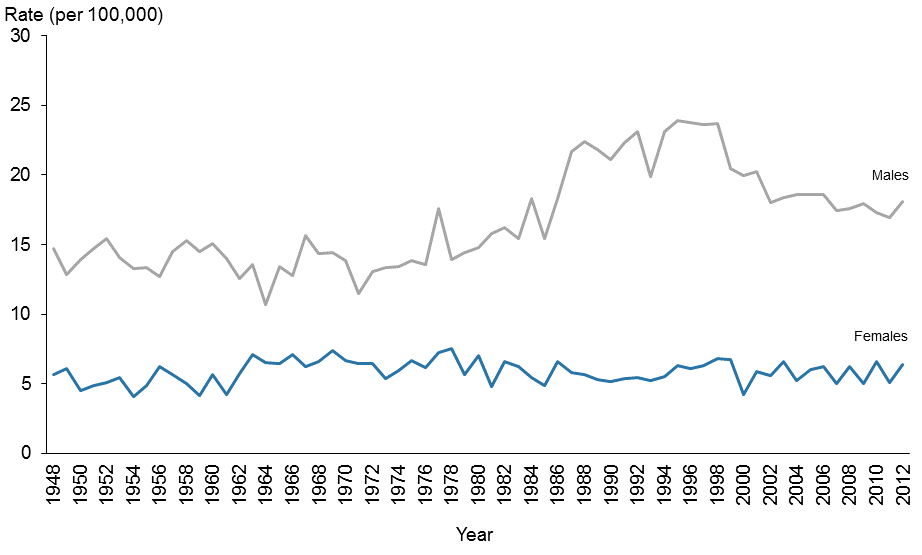 Figure 1: Suicide age-standardised rates, 1948–2012
Source: New Zealand Mortality Collection
Note: rates are expressed per 100,000 population and age-standardised to the WHO
World Standard population.
Figure 2: Suicide age-standardised rates, by sex, 1948–2012
Source: New Zealand Mortality Collection
Note: rates are expressed per 100,000 population and age-standardised to the WHO
World Standard population.
Suicide Facts: Deaths and intentional self-harm hospitalisations 2012
7
 Age
Age
This section focuses on suicides by five-year age groups for 2012 and broader life-stage age
groups to show trends over time.
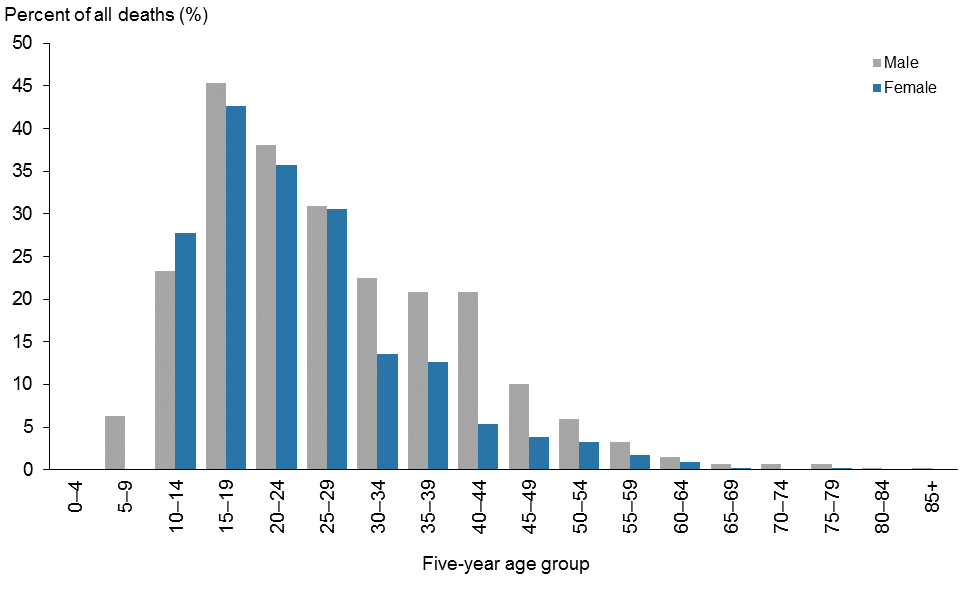
Suicide accounted for 1.8% of all deaths in 2012. Suicide was the cause of death for about 45% of
males and females aged 15–19 years. Approximately one in three deaths in males and females
aged 5–24 years were due to suicide in 2012 (Figure 3).
Figure 3: Suicide as a percentage of all deaths, by age group and sex, 2012
Source: New Zealand Mortality Collection
8
Suicide Facts: Deaths and intentional self-harm hospitalisations 2012
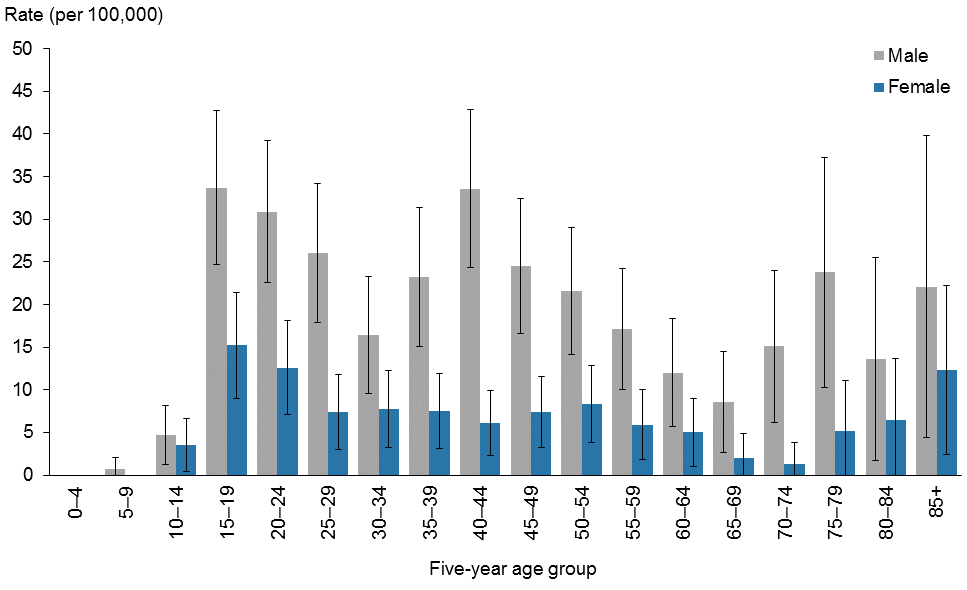 Suicide by five-year age group
Males had higher rates of suicide than females for every age group. The highest rates for males
were for those aged 15–19 and 40–44 years. The highest rate for females was in those aged
15–19 years (Figure 4, Table 2).
Figure 4: Age-specific suicide rates, by five-year age group and sex, 2012
Source: New Zealand Mortality Collection
Notes:
Rates are expressed as deaths per 100,000 population.
95% confidence intervals.
Suicide Facts: Deaths and intentional self-harm hospitalisations 2012
9
Table 2: Suicide deaths, age-specific rates and suicides as a percentage of all deaths, by
five-year age group and sex, 2012
Age
Male
Female
Total
group
% of all
% of all
% of all
(years)
Number
Rate
Number
Rate
Number
Rate
deaths
deaths
deaths
0–4
0
0.0
0.0
0
0.0
0.0
0
0.0
0.0
5–9
1
0.7
6.3
0
0.0
0.0
1
0.3
3.3
10–14
7
4.7
23.3
5
3.5
27.8
12
4.2
25.0
15–19
54
33.7
45.4
23
15.2
42.6
77
24.7
44.5
20–24
53
30.9
38.1
20
12.6
35.7
73
22.1
37.4
25–29
39
26.0
31.0
11
7.4
30.6
50
16.7
30.9
30–34
22
16.4
22.4
11
7.7
13.6
33
11.9
18.4
35–39
31
23.2
20.8
11
7.5
12.6
42
15.0
17.8
40–44
50
33.6
20.8
10
6.1
5.4
60
19.2
14.1
45–49
37
24.5
10.1
12
7.4
3.9
49
15.6
7.2
50–54
32
21.6
6.0
13
8.3
3.2
45
14.8
4.8
55–59
22
17.1
3.2
8
5.9
1.8
30
11.4
2.6
60–64
14
12.0
1.5
6
5.0
0.9
20
8.4
1.2
65–69
8
8.6
0.6
2
2.0
0.2
10
5.2
0.5
70–74
11
15.1
0.7
1
1.3
0.1
12
7.9
0.4
75–79
12
23.8
0.6
3
5.2
0.2
15
13.8
0.4
80–84
5
13.6
0.2
3
6.4
0.1
8
9.6
0.2
85+
6
22.1
0.1
6
12.3
0.1
12
15.9
0.1
Total
404
18.1
2.7
145
6.4
1.0
549
12.2
1.8
Source: New Zealand Mortality Collection
Notes:
Rates are expressed as deaths per 100,000 population.
Percentages are calculated using provisional 2012 mortality data.
Suicide by life-stage age group
This section focuses on suicide deaths by four life-stage age groups: 15–24 years (youth), 25–44
years, 45–64 years and 65 years and over.
In 2012, the suicide rate decreased with age. Youth (15–24 years) had the highest suicide rate of
23.4 per 100,000 population, and those aged 65 years and over had the lowest suicide rate
represented at 9.3 per 100,000 population (Table 3).
New Zealand’s suicide rates by life-stage group have varied over time. In 1948, the differences
between the four life-stage age groups were distinct, with the suicide rate increasing with age. By
the early 1990s, this trend had almost reversed, with youth showing the highest rates of suicide
and those aged 65 years and over having the lowest rates. In more recent years, those aged
65 years and over have continued to show the lowest rates, while rates for those aged between
25 and 64 years have started to converge (Figure 5).
10
Suicide Facts: Deaths and intentional self-harm hospitalisations 2012
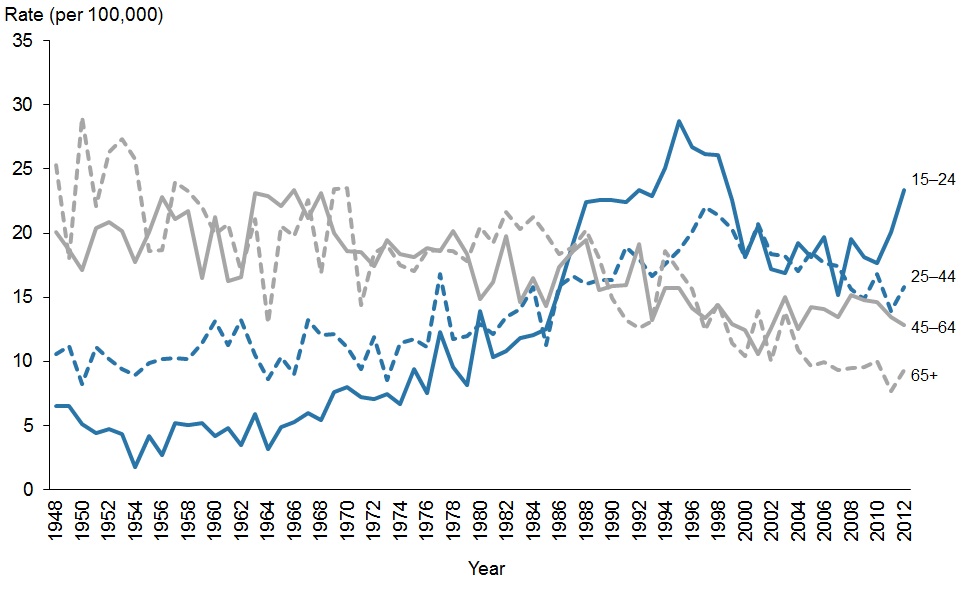 Table 3: Age-specific suicide rates, by life-stage age group, 2012
Age group
Male
Female
Total
(years)
Number
Rate
Number
Rate
Number
Rate
Table 3: Age-specific suicide rates, by life-stage age group, 2012
Age group
Male
Female
Total
(years)
Number
Rate
Number
Rate
Number
Rate
15–24
107
32.3
43
13.8
150
23.4
25–44
142
25.0
43
7.1
185
15.8
45–64
105
19.3
39
6.8
144
12.9
65+
42
15.0
15
4.5
57
9.3
Source: New Zealand Mortality Collection
Note: rates are expressed as deaths per 100,000 population.
Figure 5: Age-specific suicide rates, by life-stage age group, 1948–2012
Source: New Zealand Mortality Collection
Notes:
Rates are expressed as deaths per 100,000 population.
Rates have not been provided for the 0–4 and 5–14 years age groups because the small number of deaths by
suicide in these age groups makes it difficult to draw meaningful conclusions about changes over time.
Youth aged 15–24 years
In 2012, the youth suicide rate was 23.4 deaths per 100,000 population aged 15–24 years
(Table 3). Rates were significantly higher among male youth than female youth; in 2012, the
male youth suicide rate was nearly 2.3 times that of the female youth suicide rate (32.3 per
100,000 males compared with 13.8 per 100,000 females) (Table 4).
Suicide was the most common cause of death for youth (150 deaths), accounting for over one-
third of all youth deaths in 2012 (37.4% of all male youth deaths and 31.9% of female youth
deaths).2 The next most common cause of death for this age group was motor vehicle accidents
(70 deaths). This equates to youth mortality rates of 23.4 per 100,000 for suicide and 10.9 per
100,000 for motor vehicle accidents.
2 These percentages have been calculated from unpublished provisional New Zealand Mortality Collection 2012
data.
Suicide Facts: Deaths and intentional self-harm hospitalisations 2012
11
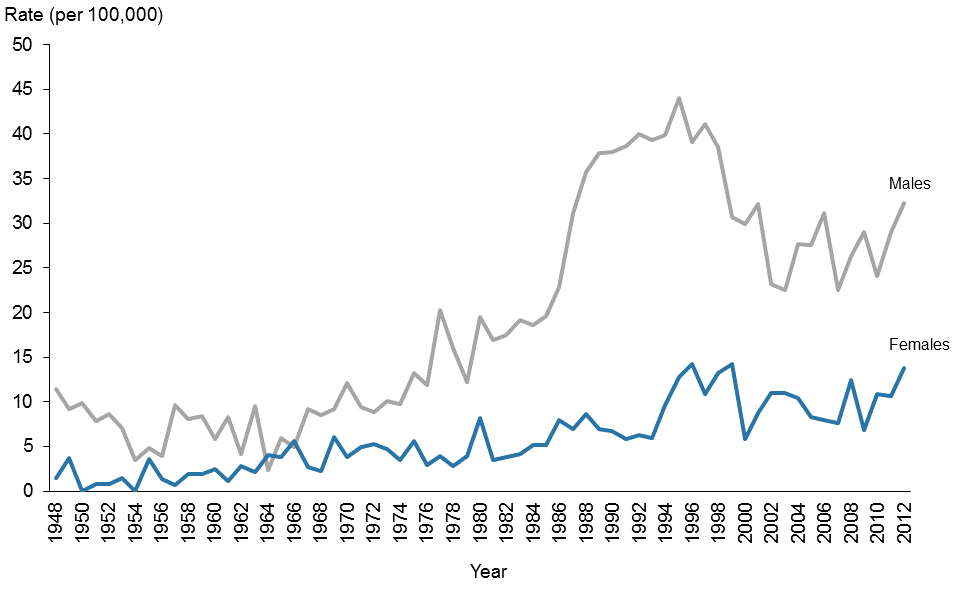
The youth suicide rate has decreased since its peak in 1995. In 2012, the youth rate was 18.6%
lower than in 1995 (Figure 5).
Male youth suicide rates began to rise noticeably in the early 1970s, then rose sharply from the
mid-1980s, reaching a peak of 44.1 suicides per 100,000 population in 1995. Since then, the rate
has trended downwards; the 2012 rate was 26.7% lower than the peak in 1995. Female youth
suicide rates also showed a general increase over time and peaked in 1996. The rates have
remained variable since then (Figure 6).
Table 4: Youth suicide age-specific rates, ages 15–24 years, by sex, 2003–2012
Year
Male
Female
Total
Number
Rate
Number
Rate
Number
Rate
2003
66
22.5
31
11.0
97
16.9
2004
83
27.7
30
10.5
113
19.3
2005
84
27.6
24
8.2
108
18.1
2006
95
31.1
24
8.0
119
19.7
2007
70
22.5
23
7.6
93
15.2
2008
83
26.4
38
12.5
121
19.5
2009
93
29.0
21
6.8
114
18.1
2010
79
24.1
34
10.9
113
17.7
2011
96
29.0
33
10.6
129
20.1
20121
107
32.3
43
13.8
150
23.4
Source: New Zealand Mortality Collection
Notes: rates are expressed as deaths per 100,000 population.
1
Provisional (see Appendix 2: Definitions).
Figure 6: Age-specific suicide rates for youth, ages 15–24 years, by sex, 1948–2012
Source: New Zealand Mortality Collection
Note: rates are expressed as deaths per 100,000 population.
12
Suicide Facts: Deaths and intentional self-harm hospitalisations 2012
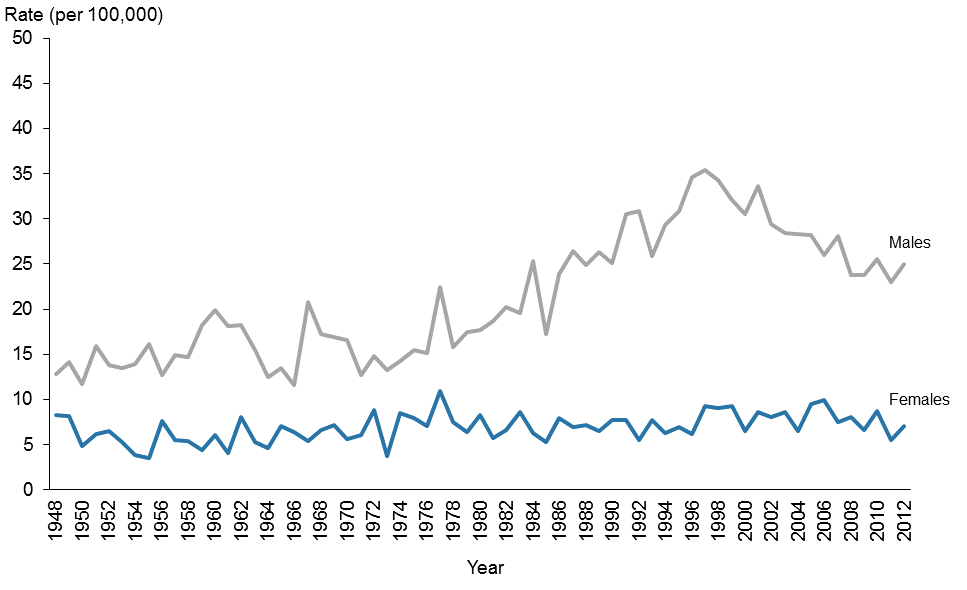 Adults aged 25–44 years
In 2012, the suicide rate for adults aged 25–44 years was 15.8 per 100,000 population in this
age group. The male rate was 25.0 per 100,000 males in this age group, which was 3.5 times the
female rate of 7.1 per 100,000 (Table 3).
Since the peak in 1997, suicide rates for males aged 25–44 years have fallen by 29.3%. In
contrast, the female rate has remained relatively constant since official records began in 1948
(Figure 7).
Figure 7: Age-specific suicide rates, ages 25–44 years, by sex, 1948–2012
Source: New Zealand Mortality Collection
Note: rates are expressed as deaths per 100,000 population.
Adults aged 45–64 years
In 2012, the suicide rate for adults aged 45–64 years was 12.9 per 100,000 population in this
age group. The male and female rates were 19.3 and 6.8 per 100,000 population in this age
group respectively (Table 3).
Over time, suicide rates for males aged 45–64 years have remained variable, although an overall
downward trend is evident with a decrease of 35.4% between 1948 and 2012.
Female rates for this age group were variable between 1948 and 1994, after which rates were
more stable (Figure 8).
Suicide Facts: Deaths and intentional self-harm hospitalisations 2012
13
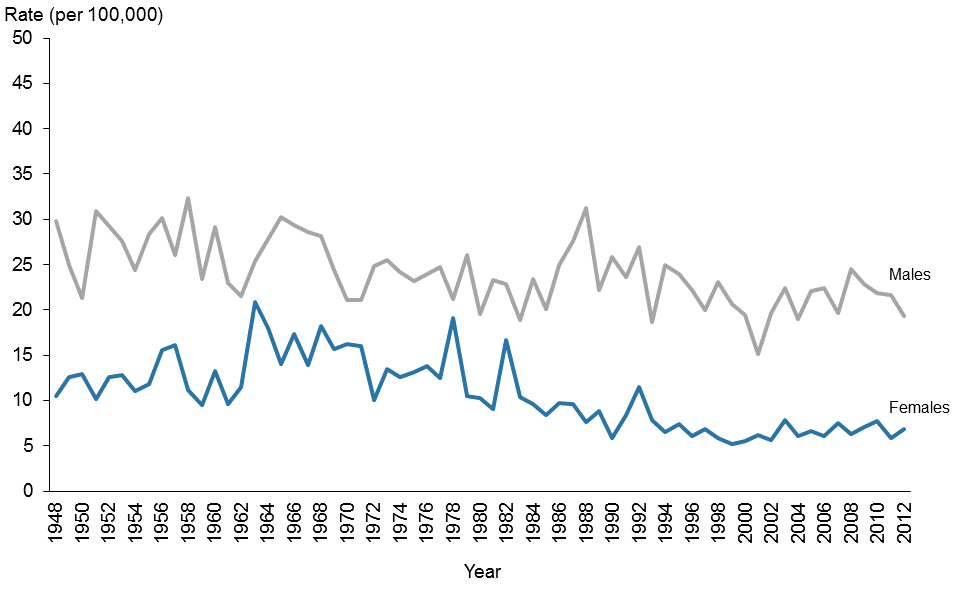
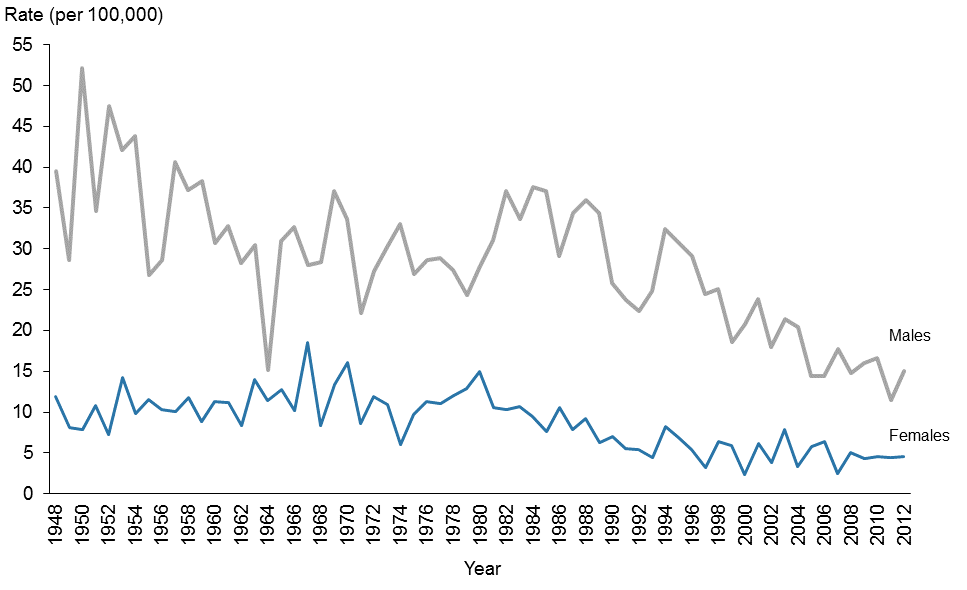 Figure 8: Age-specific suicide rates, ages 45–64 years, by sex, 1948–2012
Source: New Zealand Mortality Collection
Note: rates are expressed as deaths per 100,000 population.
Adults aged 65 years and over
In 2012, the suicide rate for those aged 65 years and over was the lowest of the four life-stage
age groups, with 9.3 per 100,000 population in this age group (Table 3). The rate has decreased
by 67.9% since its highest rate in 1950 (Figure 5). The 2012 male and female rates were 15.0 and
4.5 per 100,000 population in this age group respectively (Table 3).
The male rate was variable between 1948 and 2012, although a substantial downward trend was
evident with a decrease of 71.3% from the peak rate in 1950. The female rate also showed a
downward trend, falling by 75.5% between 1967 (when it peaked) and 2012 (Figure 9).
Figure 9: Age-specific suicide rates, ages 65 years and over, by sex, 1948–2012
Source: New Zealand Mortality Collection
Note: rates are expressed as deaths per 100,000 population.
14
Suicide Facts: Deaths and intentional self-harm hospitalisations 2012
Ethnicity
Overview
There were 120 Māori suicides in 2012, accounting for 21.9% of all suicide deaths (17.8 per
100,000 population). There were 429 non-Māori suicide deaths (10.6 per 100,000 population).
Non-Māori suicides comprised 30 Pacific people, 23 Asian and 376 European & Other (Table 5).
There were 287 European & Other male suicides and 89 female suicides in 2012. There were
20 male and 10 female suicide deaths among Pacific people and 14 male and 9 female suicide
deaths among Asian people in 2012.
It is difficult to draw conclusions about changes in suicide rates over time for different ethnic
groups; not only are the numbers of suicides in certain ethnic groups small, but also the
population of Asian people in New Zealand increased markedly between 1996 and 2012.
Age-standardised rates for the ethnic group breakdown of Māori, Pacific peoples, Asian and
European & Other were calculated for the five years 2008–2012. The small number of Pacific
peoples and Asian suicides means rates are variable, and any trends should be interpreted
cautiously (Figure 10).
Table 5: Suicide deaths, by ethnicity, life-stage group and sex, 2012
Ethnicity
Sex
Life-stage age group
Rate
<15
15–24
25–44
45–64
65+
Total
Māori
Male
6
37
30
9
1
83
Female
3
24
9
1
0
37
Total
9
61
39
10
1
120
17.8
Pacific
Male
0
7
7
5
1
20
peoples
Female
2
6
1
1
0
10
Total
2
13
8
6
1
30
10.2
Asian
Male
0
4
5
5
0
14
Female
0
2
1
4
2
9
Total
0
6
6
9
2
23
4.2
European
Male
2
59
100
86
40
287
& Other
Female
0
11
32
33
13
89
Total
2
70
132
119
53
376
12.0
All ethnicities
Male
8
107
142
105
42
404
Female
5
43
43
39
15
145
Total
13
150
185
144
57
549
12.2
Source: New Zealand Mortality Collection
Note: rates are expressed per 100,000 population and are age-standardised to the WHO World Standard population.
Suicide Facts: Deaths and intentional self-harm hospitalisations 2012
15
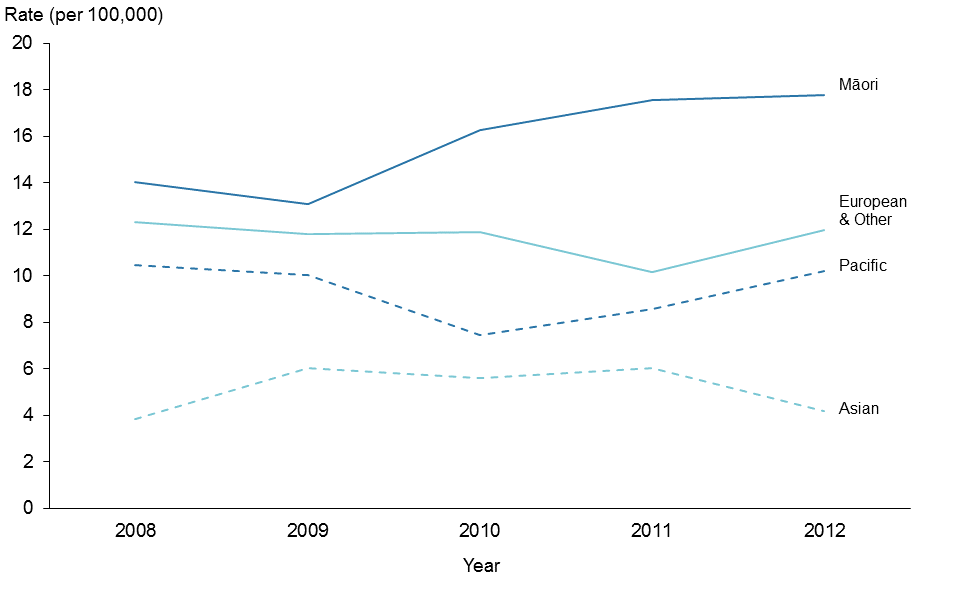 Figure 10: Suicide rates, by ethnic group, 2008–2012
Source: New Zealand Mortality Collection
Note: rates are expressed per 100,000 population and are age-standardised to the
WHO World Standard population.
Māori and non-Māori comparison
In 2012, the age-standardised suicide rate for Māori was 1.7 times higher than that for non-
Māori (17.8 per 100,000 Māori population compared with 10.6 per 100,000 non-Māori
population) (Table 6).
Over the 10-year period from 2003 to 2012, Māori suicide rates were variable but were at least
1.2 times the suicide rate for non-Māori. The non-Māori suicide rates were generally stable over
the same period (Figure 11).
Sex
The rate of suicide for Māori males was 25.6 per 100,000 population in 2012, compared with
16.3 per 100,000 for non-Māori males. The rate ratio of Māori male suicides to non-Māori male
suicides was 1.6 to 1. Māori females had double the suicide rate for non-Māori females in 2012
(10.5 per 100,000 compared with 5.2 per 100,000) (Table 6).
Between 2003 and 2012, Māori male suicide rates were highly variable, while Māori female
suicide rates trended upward slightly. Non-Māori male and female suicide rates were relatively
stable (Figure 12).
16
Suicide Facts: Deaths and intentional self-harm hospitalisations 2012
Table 6: Suicide deaths and age-standardised rates, Māori and non-Māori, by sex, 2003–2012
Year
Māori
Non-Māori
Rate ratio
Male
Female
Total
Male
Female
Total
Māori:non-Māori
Number
Rate
Number
Rate
Number
Rate
Number
Rate
Number
Rate
Number
Rate
Male
Female
Total
2003
67
22.7
20
6.4
87
14.2
309
17.0
121
6.4
430
11.6
1.3
1.0
1.2
2004
82
29.0
27
8.4
109
18.3
297
16.5
82
4.5
379
10.4
1.8
1.9
1.8
2005
78
26.9
26
8.3
104
17.2
302
16.8
105
5.4
407
11.0
1.6
1.5
1.6
2006
75
25.9
33
10.7
108
18.0
313
17.0
105
5.3
418
11.0
1.5
2.0
1.6
2007
74
25.9
23
7.3
97
16.1
297
15.7
93
4.4
390
9.9
1.6
1.6
1.6
2008
56
19.8
31
8.9
87
14.0
325
17.0
108
5.4
433
11.1
1.2
1.6
1.3
2009
58
19.3
25
7.4
83
13.1
335
17.4
92
4.4
427
10.7
1.1
1.7
1.2
2010
74
23.9
32
9.4
106
16.3
312
15.7
117
5.9
429
10.7
1.5
1.6
1.5
2011
82
26.3
32
9.5
114
17.5
295
14.9
84
4.0
379
9.4
1.8
2.4
1.9
20121
83
25.6
37
10.5
120
17.8
321
16.3
108
5.2
429
10.6
1.6
2.0
1.7
Source: New Zealand Mortality Collection
Notes: rates are expressed per 100,000 population and are age-standardised to the WHO World Standard population.
1
Provisional
Suicide Facts: Deaths and intentional self-harm hospitalisations 2012
17
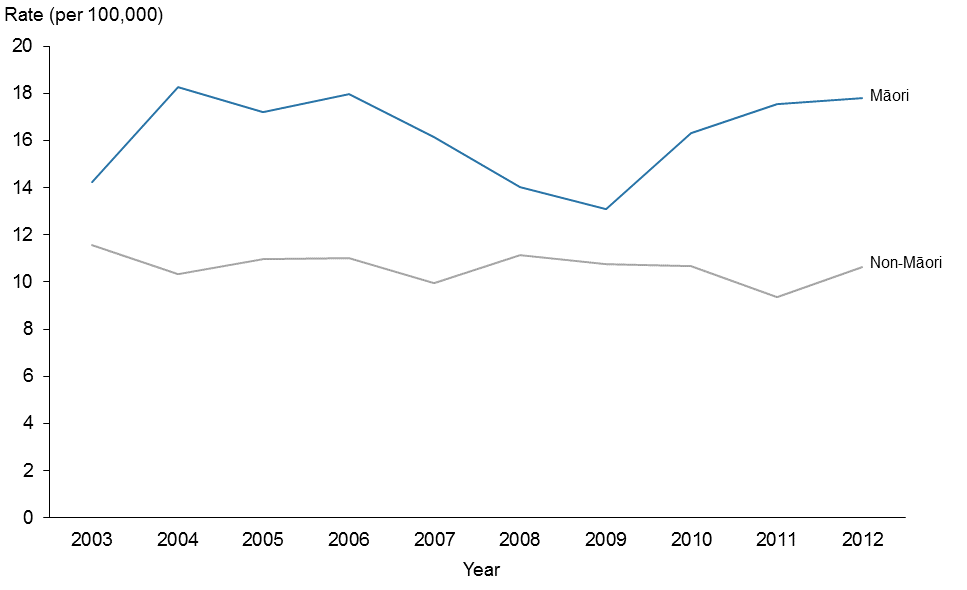
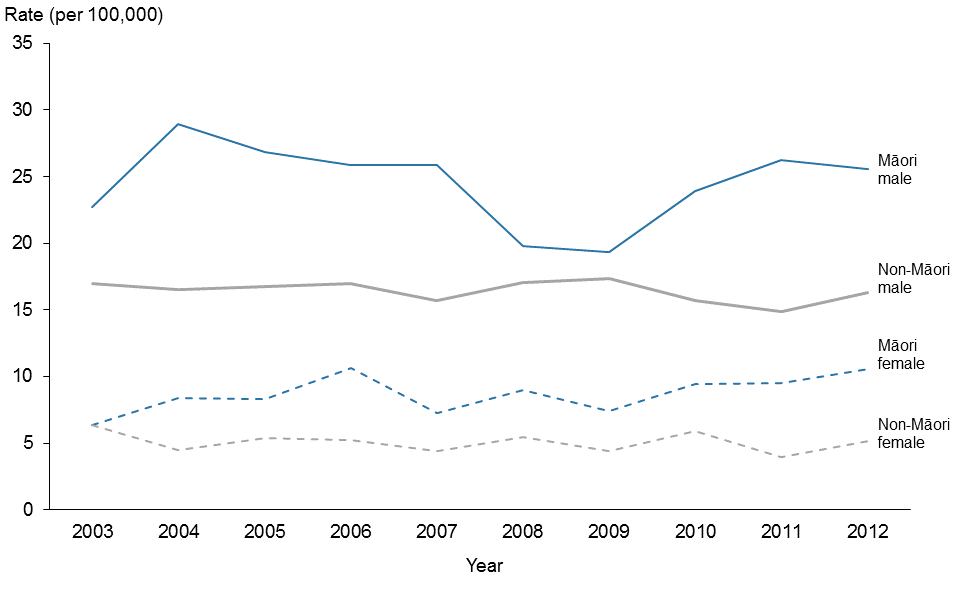 Figure 11: Age-standardised suicide rates, Māori and non-Māori, 2003–2012
Source: New Zealand Mortality Collection
Note: rates are expressed per 100,000 population and are age-standardised to the
WHO World Standard population.
Figure 12: Age-standardised suicide rates, Māori and non-Māori, by sex, 2003–2012
Source: New Zealand Mortality Collection
Note: rates are expressed per 100,000 population and are age-standardised to the
WHO World Standard population.
18
Suicide Facts: Deaths and intentional self-harm hospitalisations 2012
Māori and non-Māori comparison among youth (15–24 years)
In 2012, the Māori youth suicide rate was 2.8 times the rate for non-Māori youth (48.0 per 100,000
Māori youth population compared with 17.3 per 100,000 non-Māori youth population) (Table 7).
This is the greatest difference between Māori and non-Māori youth in the 10 years from 2003.
Over those 10 years, total Māori youth suicide rates were consistently higher (at least 1.7 times)
than total non-Māori youth suicide rates (Figure 13). By sex, Māori male and female suicide
rates were also consistently higher than non-Māori male and female suicide rates respectively
over the same period (Figure 14).
Suicide Facts: Deaths and intentional self-harm hospitalisations 2012
19
Table 7: Youth suicide deaths and age-specific rates, Māori and non-Māori, by sex, 2003–2012
Year
Māori
Non-Māori
Rate ratio
Male
Female
Total
Male
Female
Total
Māori:non-Māori
Number
Rate
Number
Rate
Number
Rate
Number
Rate
Number
Rate
Number
Rate
Male
Female
Total
2003
20
37.1
11
20.2
31
28.6
46
19.3
20
8.8
66
14.2
1.9
2.3
2.0
2004
28
50.5
13
23.3
41
36.9
55
22.5
17
7.3
72
15.1
2.2
3.2
2.4
2005
29
50.5
10
17.4
39
34.0
55
22.2
14
6.0
69
14.3
2.3
2.9
2.4
2006
29
50.6
8
13.5
37
31.8
66
26.6
16
6.6
82
16.8
1.9
2.0
1.9
2007
23
39.5
10
16.8
33
28.1
47
18.6
13
5.3
60
12.1
2.1
3.2
2.3
2008
17
28.6
18
30.0
35
29.3
66
25.8
20
8.2
86
17.2
1.1
3.7
1.7
2009
24
39.2
11
18.1
35
28.7
69
26.6
10
4.1
79
15.6
1.5
4.5
1.8
2010
29
46.1
15
24.3
44
35.3
50
18.9
19
7.6
69
13.4
2.4
3.2
2.6
2011
33
51.5
16
25.7
49
38.8
63
23.6
17
6.8
80
15.5
2.2
3.8
2.5
20121
37
57.2
24
38.4
61
48.0
70
26.2
19
7.7
89
17.3
2.2
5.0
2.8
Source: New Zealand Mortality Collection
Notes: rates are expressed as deaths per 100,000 population.
1
Provisional
20
Suicide Facts: Deaths and intentional self-harm hospitalisations 2012

 Figure 13: Youth age-specific suicide rates, by ethnic group, 2003–2012
Source: New Zealand Mortality Collection
Note: rates are expressed as deaths per 100,000 population.
Figure 14: Youth age-specific suicide rates, by ethnic group and sex, 2003–2012
Source: New Zealand Mortality Collection
Note: rates are expressed as deaths per 100,000 population.
Suicide Facts: Deaths and intentional self-harm hospitalisations 2012
21
Deprivation
Deprivation quintiles are used to represent the level of deprivation of the area of residence.
Deprivation quintile 1 represents the least deprived and quintile 5 represents the most deprived,
according to the New Zealand Deprivation Index 2006 (NZDep 2006).
In 2012, the suicide rate was highest among those who resided in deprivation quintile 4
(16.2 per 100,000), followed by quintile 3 (15.0 per 100,000). The lowest suicide rate was seen
among those who resided in the least deprived quintile, quintile 1 (6.6 per 100,000) (Table 8).
Suicide rates in both quintiles 1 and 2 were significantly lower than suicide rates in quintiles 3–5
(Figure 15).
When separated by sex for each deprivation quintile, female suicide rates increased with the
level of deprivation. Male suicide rates were the highest in quintiles 3 and 4, which were both
significantly higher than the male suicide rates in quintiles 1 and 2 (Figure 16).
The relationship between deprivation level and suicide is more apparent in the youth population
when suicides by life-stage age group are presented by deprivation quintile. For youth aged
15–24 years, there were at least 3.5 times the number of suicides in deprivation quintiles 3–5
compared with quintiles 1 and 2. The same trend was not seen in older age groups (Figure 17).
Table 8: Suicide deaths and age-standardised rates, by deprivation quintile and sex, 2012
Deprivation quintile
Male
Female
Total
Number
Rate
Number
Rate
Number
Rate
1 (least deprived)
47
10.1
14
3.0
61
6.6
2
68
14.7
18
4.1
86
9.3
3
104
23.4
32
6.6
136
15.0
4
102
24.1
39
8.7
141
16.2
5 (most deprived)
82
19.1
41
8.9
123
13.8
Source: New Zealand Mortality Collection
Notes:
Rates are expressed per 100,000 population and are age-standardised to the WHO World Standard population.
There were two suicide deaths unable to be assigned a deprivation score.
22
Suicide Facts: Deaths and intentional self-harm hospitalisations 2012
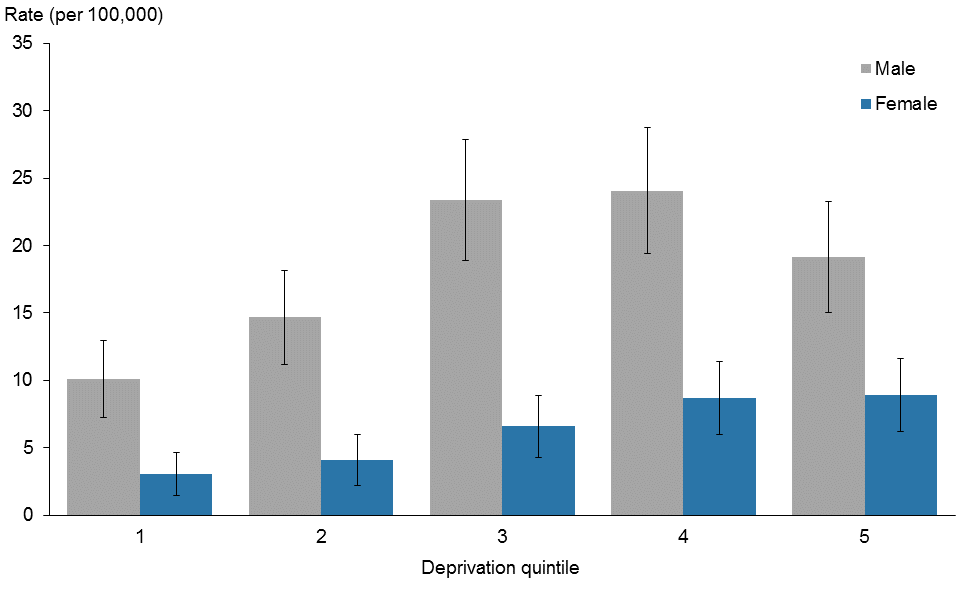 Figure 15: Age-standardised suicide rates, by deprivation quintile, 2012
Source: New Zealand Mortality Collection
Note: rates are expressed per 100,000 population and age-standardised to the WHO
World Standard population.
Figure 16: Age-standardised suicide rates, by deprivation quintile and sex, 2012
Source: New Zealand Mortality Collection
Note: rates are expressed per 100,000 population and age-standardised to the WHO
World Standard population.
Suicide Facts: Deaths and intentional self-harm hospitalisations 2012
23
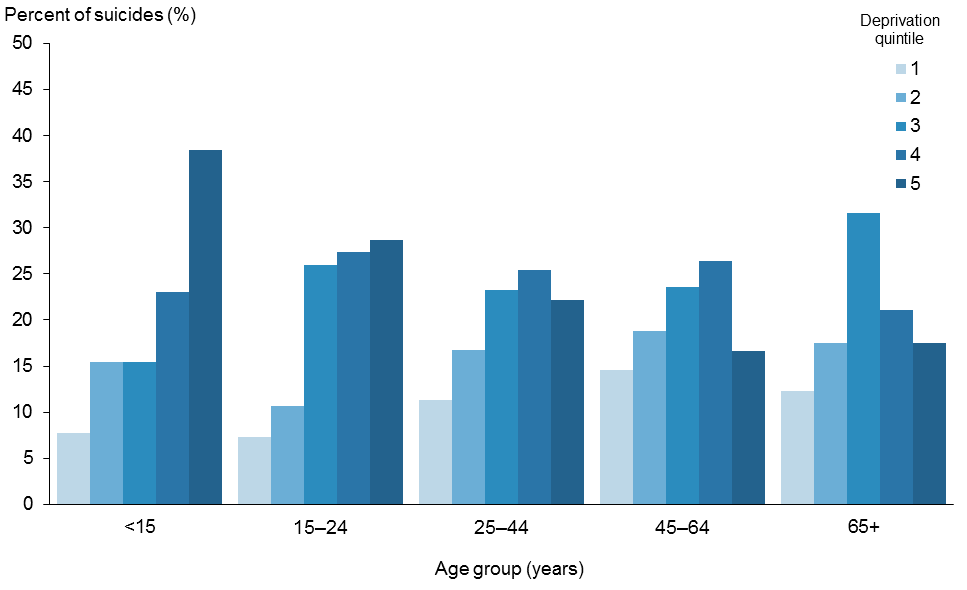
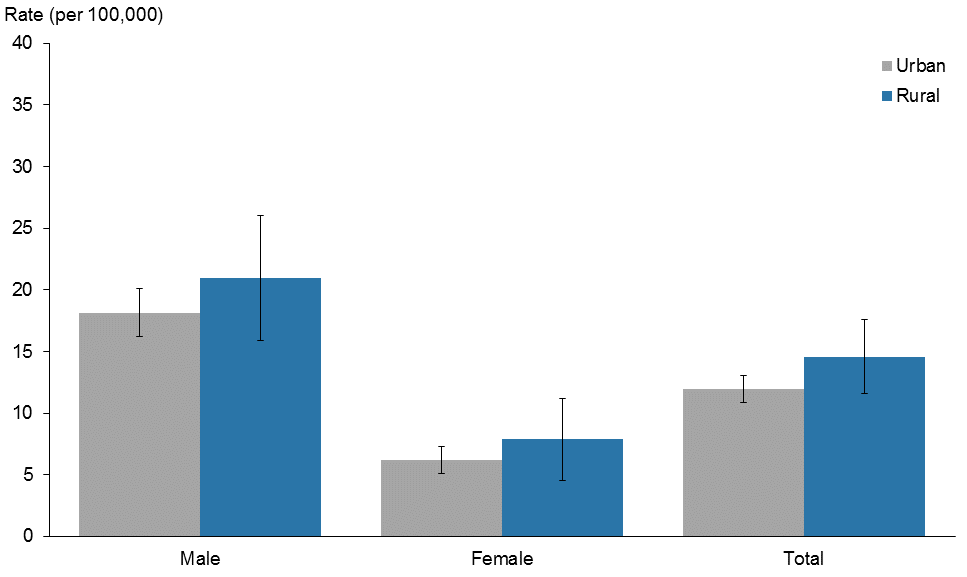 Figure 17: Suicides by deprivation quintile and life-stage age group, 2012
Source: New Zealand Mortality Collection
Note: rates are expressed per 100,000 population and age-standardised to the WHO
World Standard population.
Urban and rural suicide rates
The suicide rate for those residing in rural areas was 14.6 per 100,000 population compared
with 12.0 per 100,000 population for those living in urban areas. This difference was not
statistically significant. In all, 15.8% of people who died by suicide lived in rural areas.
Sex
In both rural and urban areas, males had a significantly higher rate of suicide than females. For
males and females, the suicide rate was higher in rural areas than urban areas. Neither of these
differences was statistically significant (Figure 18).
Figure 18: Suicide rates, by urban/rural profile and sex, 2012
Source: New Zealand Mortality Collection
Note: rates are expressed per 100,000 population and age-standardised to the WHO
World Standard population.
24
Suicide Facts: Deaths and intentional self-harm hospitalisations 2012
 Life-stage age group
The highest rate of suicide was seen in the 15–24 years life-stage age group in both rural and
urban areas. The rural rates of suicide were higher than the urban rates for all life-stage age
groups except for those aged 65 years and over (Figure 19).
The life-stage age group with the highest rural rate of suicide was males aged 15–24 years
(29.1 per 100,000), although this was not significantly different from any of the male rural rates
for other age groups, or from the urban rate for males aged 15–24 years (Table 9).
Figure 19: Suicide rates, by urban/rural profile and life-stage age group, 2012
Source: New Zealand Mortality Collection
Note: rates are expressed per 100,000 population and age-standardised to the WHO
World Standard population.
Table 9: Suicide deaths and rates, by urban/rural profile, life-stage age group and sex, 2012
Number
Rate
Life-stage age group
Life-stage age group
5–14
15–24 25–44 45–64
65+
Total
5–14
15–24 25–44 45–64
65+
Total
Urban
Male
4
96
124
77
36
337
1.6
34.5
26.0
17.2
15.4
18.1
Female
4
36
35
33
15
123
1.6
13.1
6.7
6.8
5.2
6.2
Total
8
132
159
110
51
460
1.6
23.9
15.9
11.8
9.8
12.0
Rural
Male
4
11
17
27
6
65
8.4
29.1
24.0
27.0
13.7
20.8
Female
1
7
7
6
0
21
2.2
21.4
9.5
6.2
0.0
7.8
Total
5
18
24
33
6
86
5.4
25.5
16.6
16.7
7.3
14.4
Total
13
150
183
143
57
546
2.0
23.4
15.8
12.9
9.3
12.2
Source: New Zealand Mortality Collection
Notes:
There were three suicide deaths whose meshblock was unable to be assigned an urban/rural classification.
Rates are age-specific, expressed as deaths per 100,000 population. The total suicide rate is expressed per 100,000
population and age-standardised to the WHO World Standard population.
Suicide Facts: Deaths and intentional self-harm hospitalisations 2012
25
District health board region
This section presents the rates of suicide, aggregated over a five-year period (2008–2012), for
each DHB. Rates have been aggregated as some DHBs have a very small number of suicide
deaths each year. Raw numbers are not presented as the size of the population varies widely
across DHBs and comparing raw numbers of suicide deaths across DHBs can be misleading.
The average number of suicides per DHB over the period 2008–2012 can be found in the online
tables that accompany this report.
All ages
For this period, the national suicide rate was 11.6 deaths per 100,000 population (Table 10).
Three DHB regions had significantly higher suicide rates than the national suicide rate: Bay of
Plenty, South Canterbury and Southern, and three had significantly lower suicide rates than the
national rate: Waitemata, Auckland and Capital & Coast DHB regions (Figures 20 and 22).
Youth (15–24 years)
The national youth suicide rate was 19.8 suicides per 100,000 youth population (Table 10).
South Canterbury DHB was the only DHB region with a significantly higher youth suicide rate
than the national youth suicide rate. Waitemata and Capital & Coast DHBs had significantly
lower suicide rates than the national youth suicide rate (Figures 21 and 22).
26
Suicide Facts: Deaths and intentional self-harm hospitalisations 2012
Table 10: Suicide age-standardised deaths, by DHB regions, 2008–2012
DHB region
Total rate1
CI
Youth rate2
CI
Northland
13.7
(10.1–17.3)
29.8
(15.5–44.1)
Waitemata
9.4
(7.9–10.9)
13.7
(8.8–18.6)
Auckland
8.9
(7.3–10.5)
14.6
(9.4–19.8)
Counties Manukau
10.2
(8.5–11.9)
22.2
(16.0–28.4)
Waikato
11.6
(9.6–13.6)
19.3
(12.4–26.2)
Lakes
16.1
(11.4–20.8)
27.6
(11.3–43.9)
Bay of Plenty
14.9
(11.7–18.1)
30.1
(17.7–42.5)
Tairawhiti
17.7
(10.3–25.1)
40.3
(11.5–69.1)
Hawke’s Bay
14.8
(11.2–18.4)
26.0
(12.9–39.1)
Taranaki
13.4
(9.4–17.4)
15.5
(3.4–27.6)
MidCentral
14.8
(11.4–18.2)
26.4
(14.9–37.9)
Whanganui
15.3
(9.5–21.1)
18.6
(1.6–35.6)
Capital & Coast
7.8
(6.0–9.6)
12.2
(6.2–18.2)
Hutt Valley
10.8
(7.7–13.9)
18.6
(7.6–29.6)
Wairarapa
20.0
(10.8–29.2)
38.9
(5.5–72.3)
Nelson Marlborough
11.0
(7.9–14.1)
14.9
(3.8–26.0)
West Coast
11.6
(4.9–18.3)
0.0
Canterbury
11.8
(10.1–13.5)
17.3
(11.7–22.9)
South Canterbury
20.6
(13.0–28.2)
60.8
(25.8–95.8)
Southern
14.3
(11.8–16.8)
21.2
(13.6–28.8)
National
11.6
(11.0–12.2)
19.8
(17.8–21.8)
Source: New Zealand Mortality Collection
Notes:
Rates were calculated based on the total number of suicides between 2008 and 2012. The denominator population
for the national suicide rate is the aggregated estimated national resident population for 2008–2012.
Confidence intervals (CI) are for 99% confidence.
1
Rates are expressed per 100,000 population and age-standardised to the WHO World Standard population.
2
Rates are age-specific, expressed as deaths per 100,000 population.
Suicide Facts: Deaths and intentional self-harm hospitalisations 2012
27
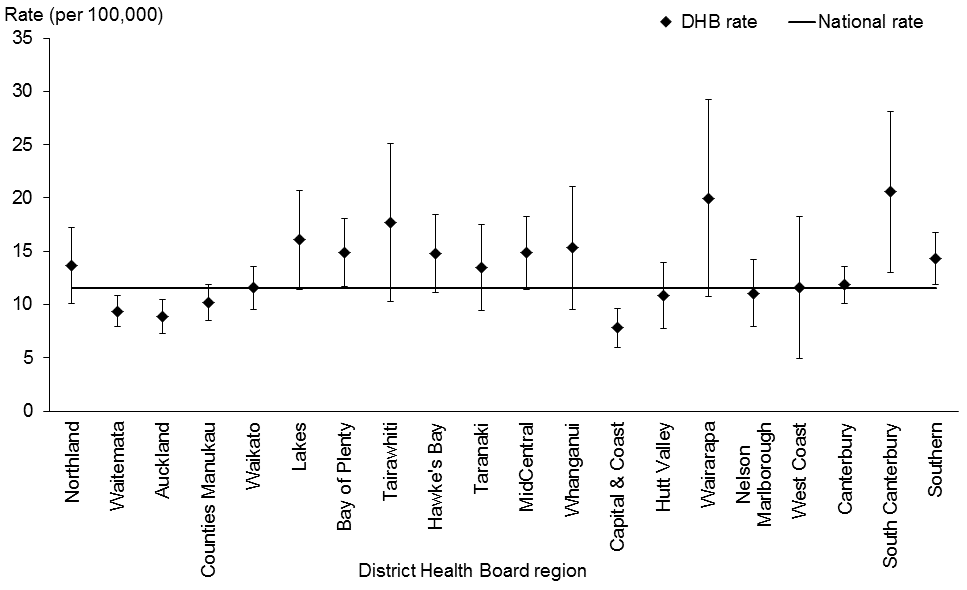
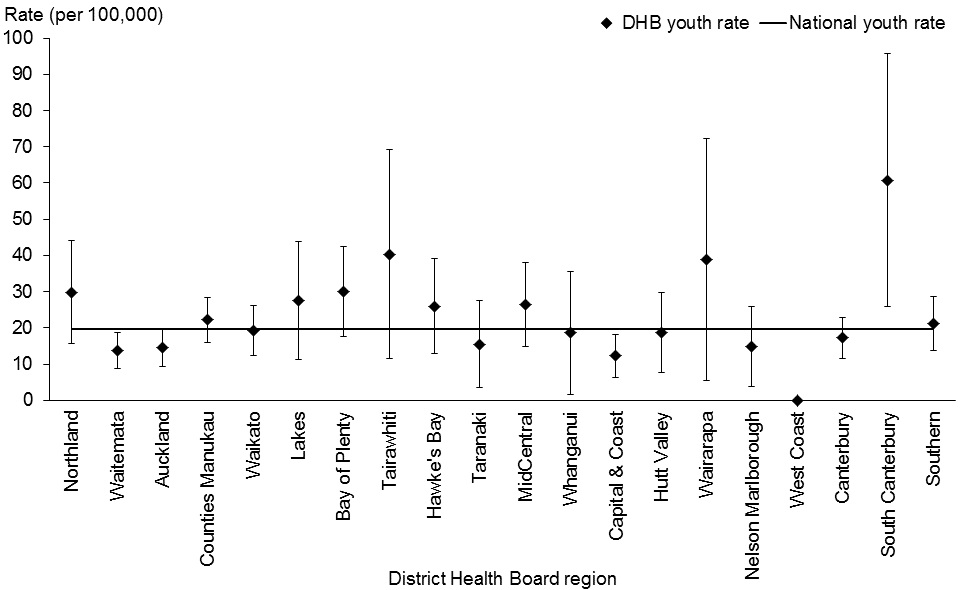 Figure 20: Age-standardised suicide rates, by DHB regions, 2008–2012
Source: New Zealand Mortality Collection
Notes:
Rates are expressed per 100,000 population and age-standardised to the WHO
World Standard population.
Confidence intervals are for 99% confidence.
If a DHB region’s confidence interval does not cross the national suicide rate, the
DHB rate is either statistically significantly higher or lower than the national rate.
Figure 21: Youth age-specific suicide rates, by DHB regions, 2008–2012
Source: New Zealand Mortality Collection
Notes:
Rates are age-specific, expressed as deaths per 100,000 population.
Confidence intervals are for 99% confidence.
If a DHB region’s confidence interval does not cross the national suicide rate, the
DHB rate is either statistically significantly higher or lower than the national rate.
28
Suicide Facts: Deaths and intentional self-harm hospitalisations 2012
Figure 22: Comparison of DHB region suicide rates with the national rate, 2008–2012
Waitemata
Waitemata
All ages
Youth
Auckland
Bay of Plenty
Capital & Coast
Capital & Coast
South Canterbury
South Canterbury
Difference from the
Southern
national rate of suicide
significantly lower
not significantly different
significantly higher
Source: New Zealand Mortality Collection
Notes:
Suicide rates for all ages are expressed per 100,000 population and age-standardised to the WHO World Standard
population.
Youth rates are age-specific, expressed as deaths per 100,000 population.
Methods of suicide
In 2012, hanging, strangulation and suffocation as a group was the most common method3 of
suicide, being used in 62.8% of all suicide deaths. Poisoning by solids and liquids was the second
most common method, which was used in 10.6% of suicides, followed by poisoning by firearms
and explosives (8.4%) and gases and vapours (8.2%) (Table 11).
Hanging, strangulation and suffocation was the most common method of suicide for both males
and females (63.4% and 61.4% respectively). The second most common method of suicide was
firearms and explosives for males (10.9%) and poisoning by solids and liquids for females
(22.8%) (Figure 23).
Between 2003 and 2012, there was an increase in the proportion of suicide deaths by hanging,
strangulation and suffocation from 47.8% in 2003 to 62.8% in 2012. Over the same period,
suicides from poisoning by gases and vapours decreased from 20.1% to 8.2%. The use of all
other methods of suicide remained relatively stable over this time period (Table 11, Figure 24).
3 See Table A1 in Appendix 2: Definitions for the ICD-10-AM codes linked to each method. There is possibly some
ambiguity as to the codes used to distinguish between poisoning methods.
Suicide Facts: Deaths and intentional self-harm hospitalisations 2012
29
Table 11: Methods used for suicide deaths, 2003–2012
Year
Poisoning – solids
Poisoning – gases
Hanging, strangulation
Submersion
Firearms and
Other2
Total
and liquids
and vapours
and suffocation
(drowning)
explosives
Number
%
Number
%
Number
%
Number
%
Number
%
Number
%
Number
%
2003
58
11.2
104
20.1
247
47.8
14
2.7
41
7.9
53
10.3
517
100.0
2004
47
9.6
93
19.1
268
54.9
12
2.5
38
7.8
30
6.1
488
100.0
2005
50
9.8
110
21.5
255
49.9
13
2.5
44
8.6
39
7.6
511
100.0
2006
49
9.3
87
16.5
286
54.4
9
1.7
50
9.5
45
8.6
526
100.0
2007
44
9.0
67
13.8
282
57.9
11
2.3
47
9.7
36
7.4
487
100.0
2008
56
10.8
75
14.4
289
55.6
8
1.5
43
8.3
49
9.4
520
100.0
2009
56
11.0
50
9.8
304
59.6
5
1.0
53
10.4
42
8.2
510
100.0
2010
67
12.5
60
11.2
317
59.3
9
1.7
42
7.9
40
7.5
535
100.0
2011
58
11.8
47
9.5
301
61.1
14
2.8
36
7.3
37
7.5
493
100.0
20121
58
10.6
45
8.2
345
62.8
5
0.9
46
8.4
50
9.1
549
100.0
Source: New Zealand Mortality Collection
Notes:
1
Provisional data.
2
See Appendix 2: Definitions for information about the methods included in the ‘Other’ category.
30
Suicide Facts: Deaths and intentional self-harm hospitalisations 2012
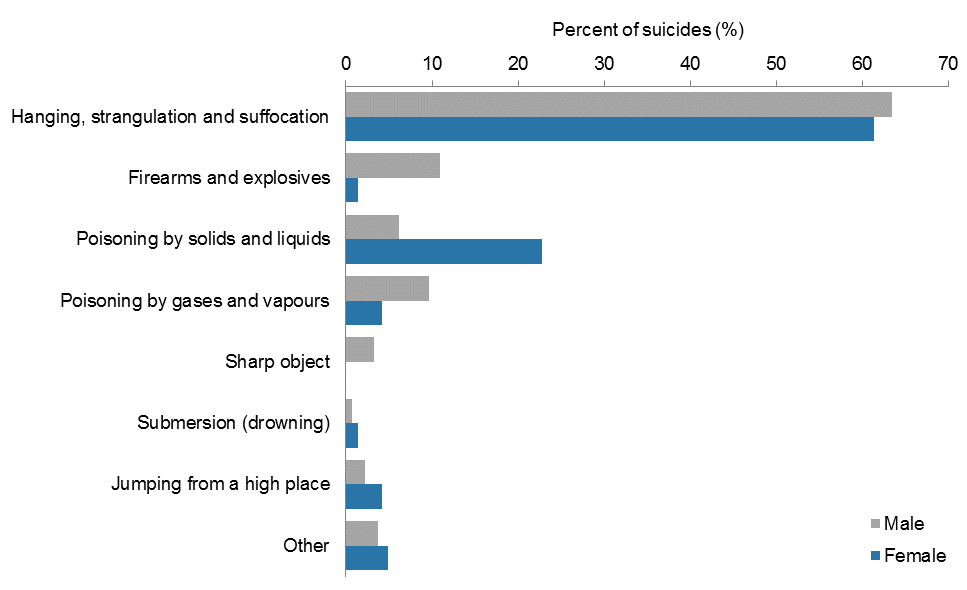
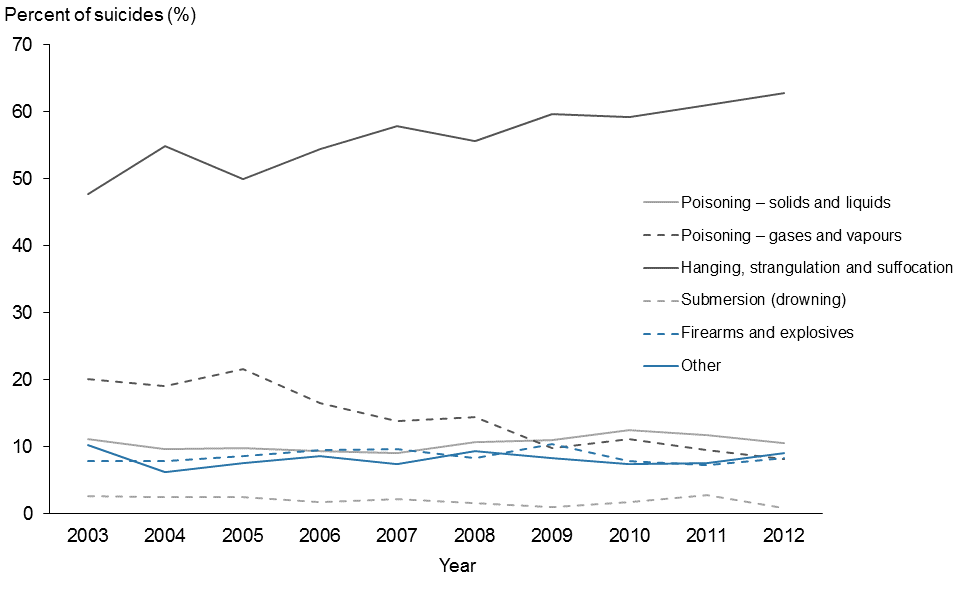 Figure 23: Methods used for suicide deaths, by sex, 2012
Source: New Zealand Mortality Collection
Note: see Appendix 2: Definitions for information about the methods included in the
‘Other’ category.
Figure 24: Methods used for suicide deaths, 2003–2012
Source: New Zealand Mortality Collection
Note: see Appendix 2: Definitions for information about the methods included in the
‘Other’ category.
Suicide Facts: Deaths and intentional self-harm hospitalisations 2012
31
Methods of suicide by life-stage age group
Hanging, strangulation and suffocation collectively was the predominant method used for
suicide by both male and females in all life-stage age groups in 2012 (Figure 25).
Youth were more likely to die by hanging, strangulation and suffocation than older people – use
of these suicide methods decreased with age for both sexes, especially for females (Figure 25).
Poisonings generally increased with age, particularly for female suicides. With increasing age,
the proportion of females who used poisoning by solid and liquids to commit suicide increased
to nearly the same proportion as hanging, strangulation and suffocation (Figure 25).
A greater proportion of males aged 45 years and over used firearms and explosives compared
with those aged less than 45 years. Males were generally more likely to employ firearms and
explosives than females (Figure 25).
32
Suicide Facts: Deaths and intentional self-harm hospitalisations 2012
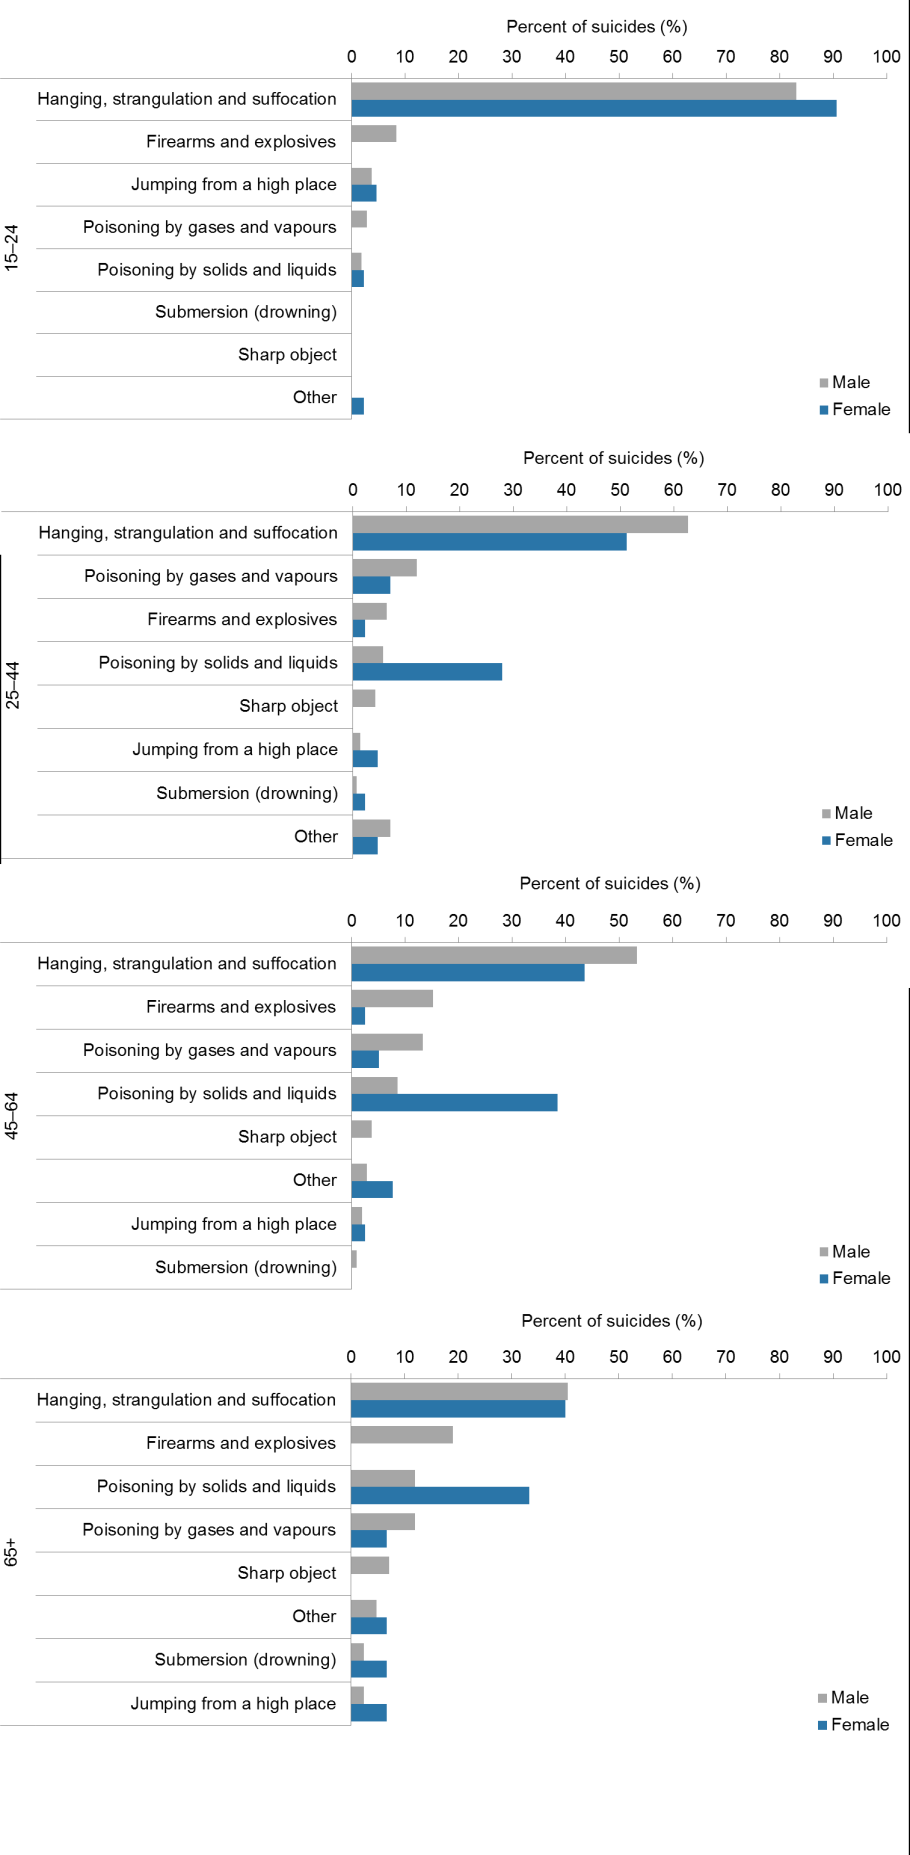 Figure 25: Methods used for suicide deaths, by sex and life-stage age group, 2012
Source: New Zealand Mortality Collection
Note: see Appendix 2: Definitions for information about the methods included in the
‘Other’ category.
Suicide Facts: Deaths and intentional self-harm hospitalisations 2012
33
 International comparisons
This section compares New Zealand suicide rates with those from other countries in the
Organisation for Economic Co-operation and Development (OECD). The countries presented in
this report were members of the OECD in 2012. In general, OECD countries are considered to
produce reliable data collections and have similar economic statuses to New Zealand, and so
their health and social statistics are often used for comparison with New Zealand’s health and
social statistics.
A cautious approach is recommended when comparing international suicide statistics because
many factors affect the recording and classification of suicide in different countries, including
the level of proof required for a verdict of suicide; the stigma associated with suicide; the
religion, social class or occupation of suicide victims; and confidentiality (Andriessen 2006). As
a result, deaths classified as suicide in some countries may be classified as accidental or of
undetermined intent in others.
The international figures cited here (except New Zealand) are the latest available from the
OECD and cover various years. Therefore New Zealand rates for 2012 are compared with data
from earlier years for some countries in which different social and/or economic conditions may
have applied.
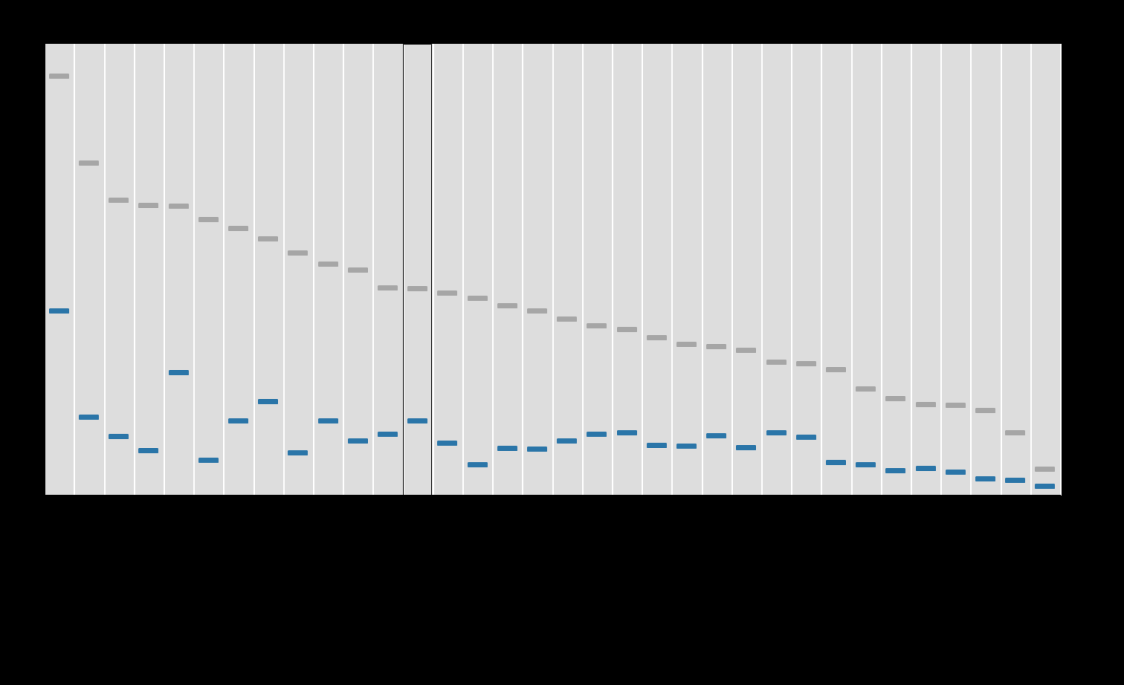
Sex
New Zealand suicide rates for both the male and female populations are slightly above the
median for the OECD countries presented. All OECD countries had higher suicide rates for
males than females (Figure 26).
Figure 26: Suicide age-standardised rates for OECD countries, by sex
Source: OECD (nd)
Note: rates are expressed per 100,000 population and age standardised to the WHO World Standard population.
Youth aged 15–24 years
New Zealand male and female suicide rates were the highest of the OECD countries covered in
this report. The New Zealand male youth suicide rate (2012) was 32.3 per 100,000 male youth
34
Suicide Facts: Deaths and intentional self-harm hospitalisations 2012
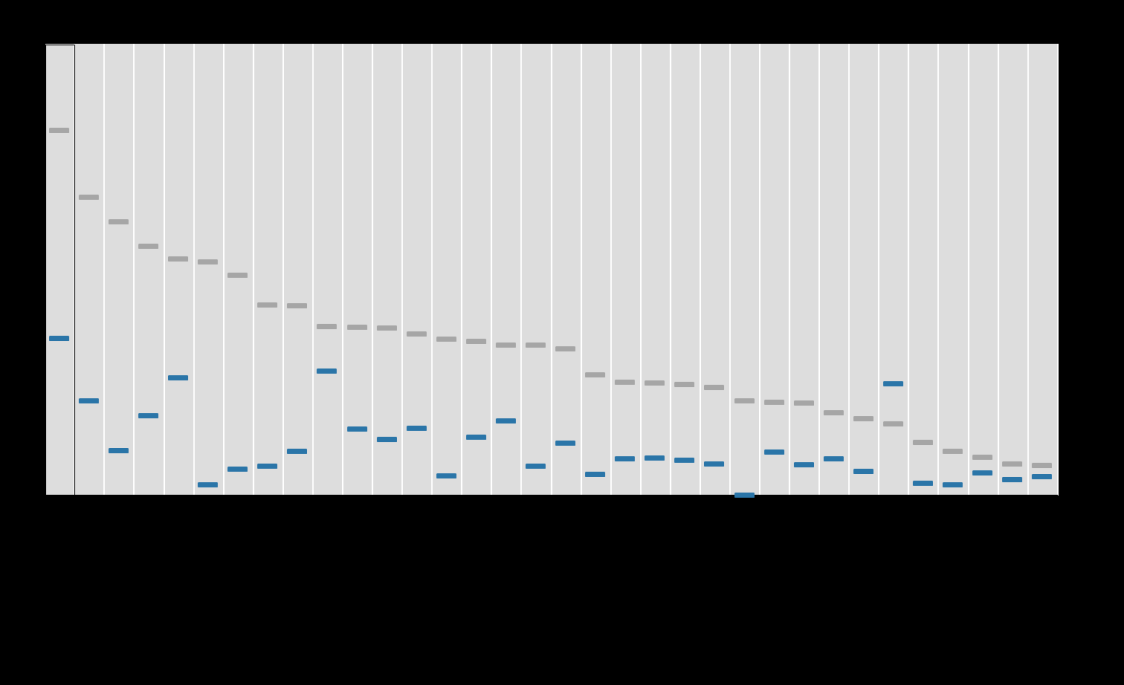
population, followed by Finland (2011) with 26.4 suicides per 100,000 population (Figure 27).
New Zealand’s female youth suicide rate (2012) was 13.8 suicides per 100,000 female youth
population, followed by the Republic of Korea (2011) with 11.0 per 100,000 population
(Figure 27).
Figure 27: Youth (15–24 years) suicide age-specific rates for OECD countries, by sex
Source: OECD (nd)
Note: rates are age-specific, expressed as deaths per 100,000 population.
Suicide Facts: Deaths and intentional self-harm hospitalisations 2012
35
 Intentional self-harm
hospitalisations in 2012
This section presents data on intentional self-harm hospitalisations by sex, age, ethnicity,
deprivation and DHB region of domicile.
The motivation for intentional self-harm varies; note that data on hospitalisations for
intentional self-harm does not provide a measure of suicide attempts. To allow the best possible
identification of trends, approximately 60% of all 2012 self-harm hospitalisations data has been
excluded from this analysis (due to inconsistencies in the way DHBs report data). For more
information about the exclusions, see the Introduction and tables A3 and A4 in Appendix 3:
Further tables.
Overview
Over the 10-year period 2003–2012, the rate of intentional self-harm hospitalisations decreased
by 11.5% from 80.3 per 100,000 in 2003 to 71.0 per 100,000 population in 2012 (Figure 28,
Table 12).
The actual number of self-harm hospitalisations decreased from 3141 in 2003 to 3031 in 2012
(Table 12). Caution is advised when interpreting the decline in self-harm hospitalisations as this
decline could have been caused by changes in clinical practices and administration instead of
real change in behaviour.
Figure 28: Intentional self-harm hospitalisation age-standardised rates, 2003–2012
Source: New Zealand National Minimum Dataset
Note: rates are expressed per 100,000 population and age-standardised to the WHO
World Standard population.
36
Suicide Facts: Deaths and intentional self-harm hospitalisations 2012
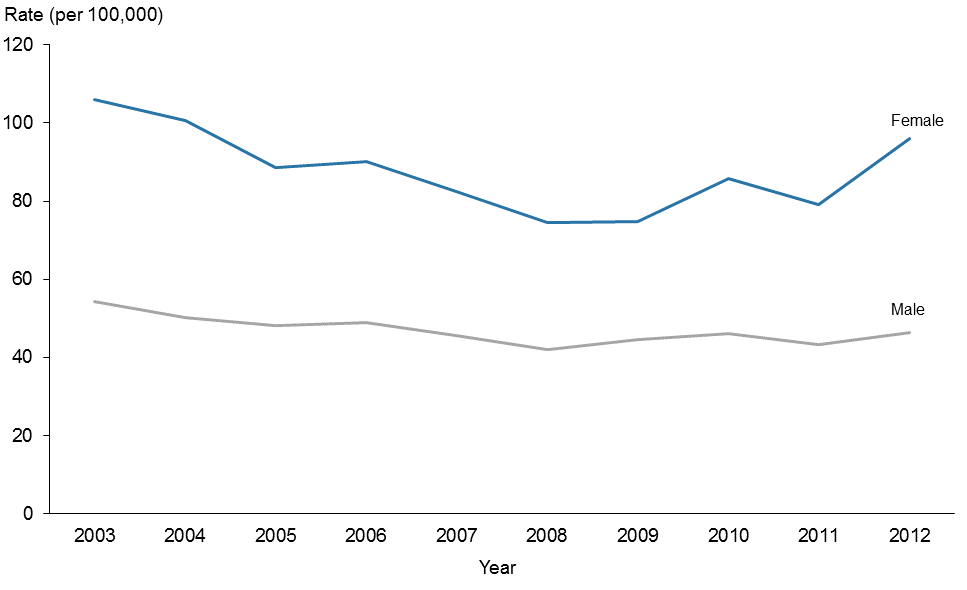 Sex
Sex
In 2012, the female rate of hospitalisation for intentional self-harm was more than twice the
male rate (96.1 per 100,000 females compared with 46.4 per 100,000 males) (Table 12).
Over the 10 years from 2003 to 2012, the female rate of intentional self-harm hospitalisation
was more variable than the male rate but remained at least 1.7 times greater than the male rate
(Figure 29). It is well documented that females are more likely to be hospitalised for intentional
self-harm than males (Berry and Harrison 2006).
Table 12: Intentional self-harm hospitalisation numbers and age-standardised rates, by
sex, 2003–2012
Year
Male
Female
Total
Sex rate ratio
(F:M)
Number
Rate
Number
Rate
Number
Rate
2003
1048
54.3
2093
106.0
3141
80.3
2.0
2004
982
50.1
2018
100.7
3000
75.5
2.0
2005
953
48.0
1790
88.7
2743
68.3
1.8
2006
991
48.8
1878
90.2
2869
69.6
1.8
2007
940
45.6
1746
82.4
2686
64.0
1.8
2008
877
41.9
1591
74.5
2468
58.2
1.8
2009
947
44.6
1592
74.7
2539
59.6
1.7
2010
990
46.1
1835
85.9
2825
66.0
1.9
2011
940
43.2
1708
79.0
2648
61.1
1.8
2012
1011
46.4
2020
96.1
3031
71.0
2.1
Source: New Zealand National Minimum Dataset
Note: rates are expressed per 100,000 population and age-standardised to the WHO World Standard population.
Figure 29: Intentional self-harm hospitalisation age-standardised rates, by sex, 2003–2012
Source: New Zealand National Minimum Dataset
Note: rates are expressed per 100,000 population and age-standardised to the WHO
World Standard population.
Suicide Facts: Deaths and intentional self-harm hospitalisations 2012
37
Age
This section discusses intentional self-harm hospitalisations by five-year age groups and then
focuses specifically on the group youth aged 15–24 years.
All ages
In 2012, the 15–19 year age group had the highest rate of intentional self-harm hospitalisations
for both males (103.1 per 100,000 population) and females (279.5 per 100,000 population)
(Table 13).
Female rates of intentional self-harm hospitalisation were significantly higher than male rates
for each five-year age group between the ages of 10 and 74 years. In those aged 75 years and
over, male rates were significantly higher than female rates (Figure 30). The lowest male rates of
intentional self-harm hospitalisations were in those aged 10–14 years followed by 65–69 years.
In females, the lowest rates of intentional self-harm hospitalisations were in those aged 70–74
years (Table 13).
Table 13: Intentional self-harm hospitalisation numbers and rates, by sex and five-year age
group, 2012
Age group
Male
Female
Total
(years)
Number
Rate
Number
Rate
Number
Rate
10–14
17
11.5
121
85.8
138
47.8
15–19
165
103.1
423
279.5
588
188.8
20–24
161
93.9
303
190.2
464
140.3
25–29
78
52.0
202
135.7
280
93.7
30–34
88
65.4
141
98.3
229
82.4
35–39
80
59.9
156
106.3
236
84.2
40–44
96
64.5
189
115.4
285
91.1
45–49
96
63.5
149
91.8
245
78.1
50–54
72
48.6
122
77.8
194
63.6
55–59
53
41.1
67
49.7
120
45.5
60–64
33
28.3
57
47.1
90
37.9
65–69
14
15.0
28
28.6
42
21.9
70–74
11
15.1
20
25.2
31
20.4
75–79
14
27.8
15
25.8
29
26.8
80–84
16
43.5
13
27.8
29
34.7
85+
17
62.7
14
28.8
31
41.0
Total
1011
46.4
2020
96.1
3031
71.0
Source: New Zealand National Minimum Dataset
Notes:
The rates for five-year age groups in this table are age-specific rates, expressed as deaths per 100,000 population.
The total rates are expressed per 100,000 population and age-standardised to the WHO World Standard population.
There were no intentional self-harm hospitalisations in the 0–4 years or 5–9 years age groups.
38
Suicide Facts: Deaths and intentional self-harm hospitalisations 2012
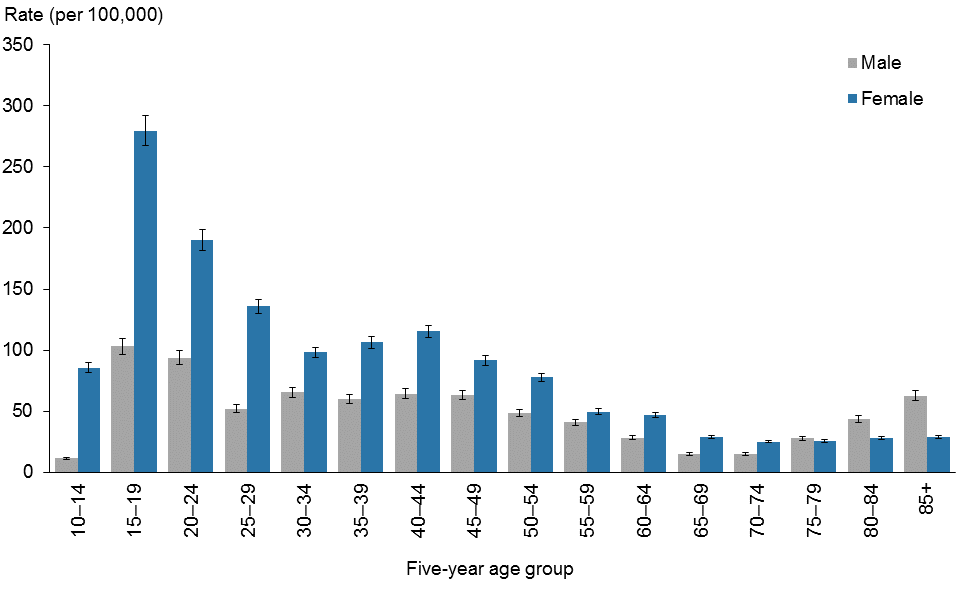 Figure 30: Intentional self-harm hospitalisation age-specific rates, by age group and sex,
2012
Figure 30: Intentional self-harm hospitalisation age-specific rates, by age group and sex,
2012
Source: New Zealand National Minimum Dataset
Note: rates are age-specific, expressed as deaths per 100,000 population.
Youth (15–24 years)
In 2012, the female rate of intentional self-harm hospitalisations was 2.4 times the male rate
(233.7 and 98.4 per 100,000 female and male populations respectively) (Table 14).
Over the 10-year period of 2003–2012, youth hospitalisation rates for intentional self-harm
varied. Female rates were consistently at least 2.1 times greater than males. The rates in 2012
were the highest during this period (Figure 31).
Table 14: Youth intentional self-harm hospitalisation numbers and age-specific rates, by
sex, 2003–2012
Year
Male
Female
Total
Sex rate ratio
(F:M)
Number
Rate
Number
Rate
Number
Rate
2003
275
93.9
622
221.2
897
156.2
2.4
2004
278
92.7
580
202.1
858
146.2
2.2
2005
224
73.5
503
172.8
727
122.0
2.3
2006
247
80.9
573
191.1
820
135.5
2.4
2007
219
70.5
520
171.6
739
120.4
2.4
2008
214
68.0
485
159.0
699
112.8
2.3
2009
240
74.8
489
159.0
729
116.0
2.1
2010
262
80.0
565
181.7
827
129.6
2.3
2011
262
79.1
572
183.3
834
129.7
2.3
2012
326
98.4
726
233.7
1052
163.8
2.4
Source: New Zealand National Minimum Dataset
Note: rates are expressed as deaths per 100,000 population.
Suicide Facts: Deaths and intentional self-harm hospitalisations 2012
39
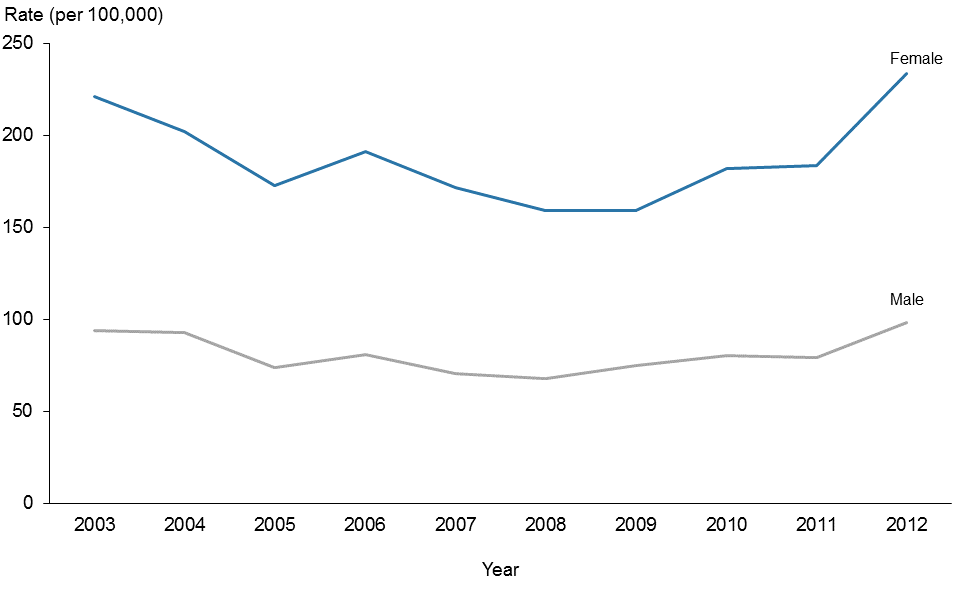 Figure 31: Youth (15–24 years) intentional self-harm hospitalisation age-specific rates, by
sex, 2003–2012
Figure 31: Youth (15–24 years) intentional self-harm hospitalisation age-specific rates, by
sex, 2003–2012
Source: New Zealand National Minimum Dataset
Note: rates are expressed as deaths per 100,000 population.
40
Suicide Facts: Deaths and intentional self-harm hospitalisations 2012
Ethnicity
Rates of intentional self-harm hospitalisations in 2012 for each ethnic group are as follows:
a)
Māori – 85.0 per 100,000 population
b)
Pacific peoples – 34.0 per 100,000 population
c)
European & Other – 82.8 per 100,000 population
d)
Asian – 18.0 per 100,000 population (Table 15).
Over the five-year period of 2008–2012, Māori rates of hospitalisations for intentional self-
harm were the highest followed by European & Other. During this period, Māori rates were at
least more than twice those of the Pacific peoples and Asian populations (Figure 32).
Māori
In 2012, there were 563 intentional self-harm hospitalisations of Māori (18.6% of total
intentional self-harm hospitalisations) (Table 15). The most common age group for both Māori
males and females to be hospitalised for intentional self-harm was youth (15–24 years) closely
followed by the 25–44 years age group. There were 88 hospitalisations for male youth, equating
to 136.0 per 100,000 population, and 138 hospitalisations for female youth, equating to 221.0
per 100,000 population (Table 16).
Pacific peoples
In 2012, there were 101 Pacific people hospitalised for intentional self-harm (3.3% of total
intentional self-harm hospitalisations), equating to an age-standardised rate of 34.0 per
100,000 Pacific population (Table 15). Half of these were in youths aged 15–24 years (Table 16).
Asian
In 2012, there were 97 intentional self-harm hospitalisations of Asian people (3.2% of total
intentional self-harm hospitalisations), equating to an age-standardised rate of 18.0 per
100,000 Asian population (Table 15). Youth (15–24 years) accounted for nearly 30% of all Asian
intentional self-harm hospitalisations (Table 16).
European & Other
There were 2270 intentional self-harm hospitalisations for people of ethnicities classified as
‘European & Other’ in 2012 (74.9% of total intentional self-harm hospitalisations). Females
accounted for 68.0% of intentional self-harm hospitalisations in this group (Table 15).
Youth (15–24 years) were the most common age group to be hospitalised for intentional self-
harm (198 males and 549 females) (Table 16).
Suicide Facts: Deaths and intentional self-harm hospitalisations 2012
41
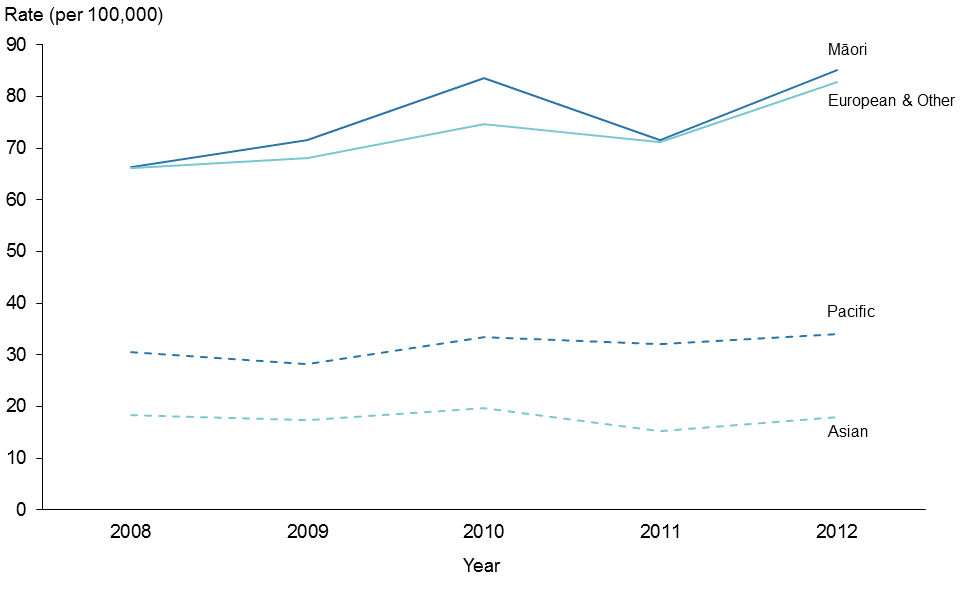 Table 15: Intentional self-harm hospitalisation numbers and rates, by ethnicity and sex,
2008–2012
Sex
Year
Māori
Pacific peoples
Asian
European & Other
Number
Rate
Number
Rate
Number
Rate
Number
Rate
Male
2008
152
52.3
47
35.1
33
16.0
645
44.1
2009
176
59.7
35
27.0
36
15.7
700
48.6
2010
223
75.2
46
32.2
34
13.6
687
47.0
2011
186
59.8
35
24.5
23
8.9
696
47.2
2012
204
64.0
50
34.0
31
11.2
726
49.6
Female
2008
262
79.8
36
26.2
51
21.0
1242
88.8
2009
281
83.7
42
29.7
51
19.4
1219
87.7
2010
312
92.5
50
34.8
65
25.6
1409
102.6
2011
277
82.6
57
39.5
56
21.2
1318
95.6
2012
359
105.4
51
34.0
66
24.6
1544
117.2
Total
2008
414
66.3
83
30.6
84
18.4
1887
66.2
2009
457
71.6
77
28.2
87
17.4
1919
68.0
2010
535
83.6
96
33.5
99
19.7
2096
74.6
2011
463
71.5
92
32.1
79
15.2
2014
71.1
2012
563
85.0
101
34.0
97
18.0
2270
82.8
Source: New Zealand National Minimum Dataset
Notes:
Rates are expressed per 100,000 population and age-standardised to the WHO World Standard population.
Numbers and rates for 1996–2012 are presented in the online tables for Māori, Pacific peoples and European &
Other.
Figure 32: Intentional self-harm hospitalisation age-standardised rates, by ethnic group,
2008–2012
Source: New Zealand National Minimum Dataset
Note: rates are expressed per 100,000 population and age-standardised to the WHO
World Standard population.
42
Suicide Facts: Deaths and intentional self-harm hospitalisations 2012
Table 16: Intentional self-harm hospitalisations, by ethnicity, life-stage age group and sex,
2012
Ethnicity
Sex
Life-stage age group (years)
Total
<15
15–24
25–44
45–64
65+
Māori
Male
7
88
78
31
0
204
Female
44
138
129
46
2
359
Total
51
226
207
77
2
563
Pacific
Male
2
30
14
3
1
50
peoples
Female
7
20
19
5
0
51
Total
9
50
33
8
1
101
Asian
Male
0
10
12
7
2
31
Female
3
19
32
6
6
66
Total
3
29
44
13
8
97
European & Male
8
198
238
213
69
726
Other
Female
67
549
508
338
82
1544
Total
75
747
746
551
151
2270
All
Male
17
326
342
254
72
1011
ethnicities
Female
121
726
688
395
90
2020
Total
138
1052
1030
649
162
3031
Source: New Zealand National Minimum Dataset
Suicide Facts: Deaths and intentional self-harm hospitalisations 2012
43
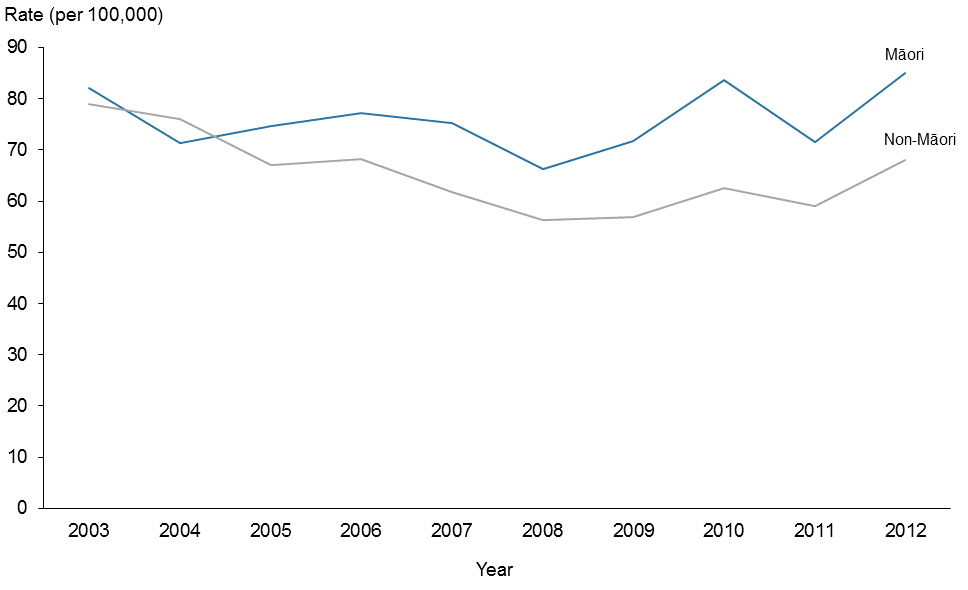 Māori and non-Māori comparison
In 2012, the Māori rate of intentional self-harm hospitalisations was 25% higher than the
non-Māori rate (85.0 per 100,000 and 68.0 per 100,000, respectively). This difference was
statistically significant.
Between 2003 and 2012, rates for Māori were variable and showed no real trend. Rates for non-
Māori showed a general downward trend (Figure 33).
Figure 33: Intentional self-harm hospitalisation age-standardised rates, Māori and non-
Māori, 2003–2012
Source: New Zealand National Minimum Dataset
Note: rates are expressed per 100,000 population and age-standardised to the WHO
World Standard population.
44
Suicide Facts: Deaths and intentional self-harm hospitalisations 2012
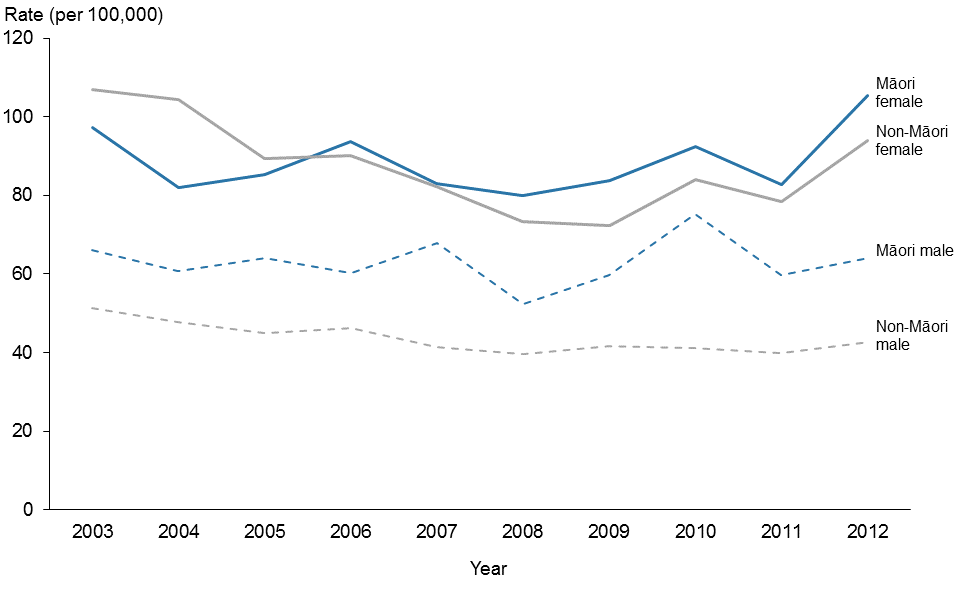 Sex
Sex
The rates for male Māori and non-Māori intentional self-harm hospitalisations continued to be
lower than the rates for female Māori and non-Māori in 2012.
Between 2003 and 2012, rates for non-Māori males showed a downward trend and were
significantly lower than Māori male rates. Māori male rates remained variable.
Non-Māori female rates for intentional self-harm hospitalisations showed a downward trend
between 2003 and 2008, after which rates increased. The rate for Māori females was more
variable throughout the whole period (Figure 34).
Figure 34: Intentional self-harm hospitalisation age-standardised rates for Māori and non-
Māori, by sex, 2003–2012
Source: New Zealand National Minimum Dataset
Note: rates are expressed per 100,000 population and age-standardised to the WHO
World Standard population.
Suicide Facts: Deaths and intentional self-harm hospitalisations 2012
45
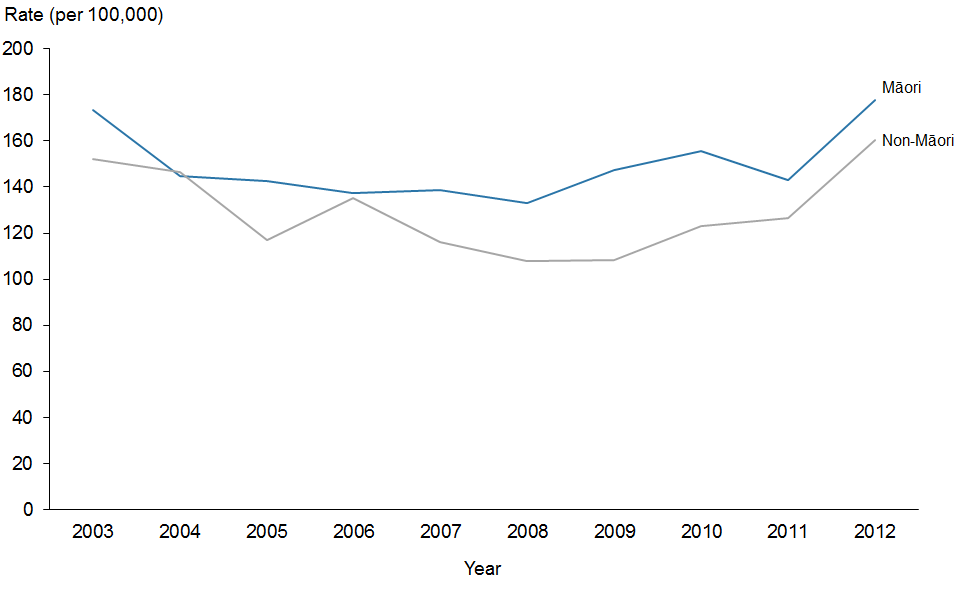
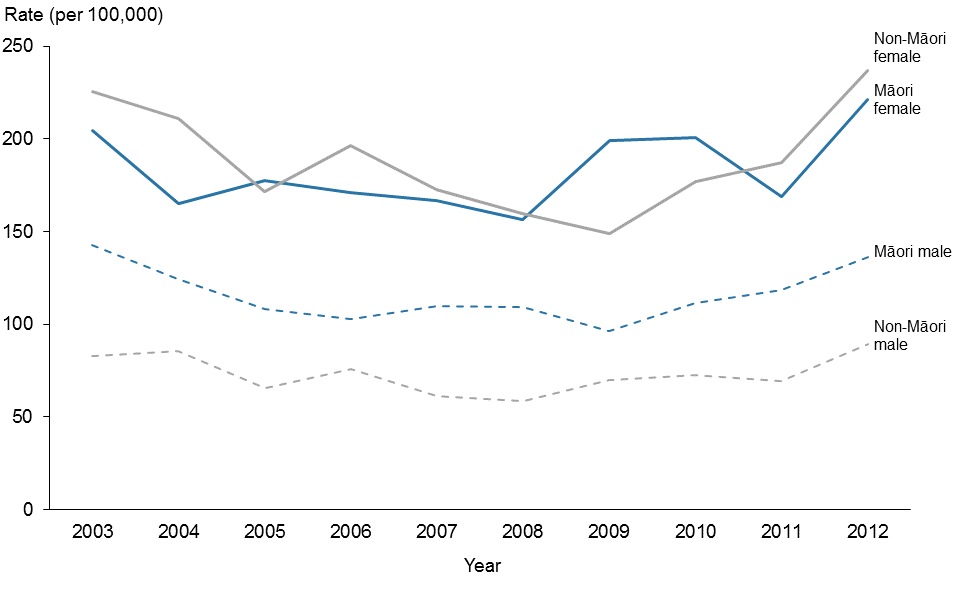 Youth (15–24 years)
In 2012, both Māori and non-Māori youth self-harm hospitalisation rates were the highest
recorded in the 10 years from 2003 to 2012. The difference between Māori and non-Māori youth
rates in 2012 was not statistically significant (Figure 35, Table 17).
Between 2003 and 2012, Māori male youth rates of intentional self-harm hospitalisation were at
least 1.4 times the non-Māori male youth rate. In contrast, the ethnic disparity was less defined
for female youth (Figure 36).
Figure 35: Youth intentional self-harm hospitalisation age-specific rates, by ethnic group,
2003–2012
Source: New Zealand National Minimum Dataset
Note: rates are expressed as deaths per 100,000 population.
Figure 36: Youth intentional self-harm hospitalisation age-specific rates, by ethnic group
and sex, 2003–2012
Source: New Zealand National Minimum Dataset
Note: rates are expressed as deaths per 100,000 population.
46
Suicide Facts: Deaths and intentional self-harm hospitalisations 2012
Table 17: Youth intentional self-harm hospitalisation numbers and age-specific rates, Māori and non-Māori, by sex, 2003–2012
Year
Māori
Non-Māori
Male
Female
Total
Male
Female
Total
Number
Rate
Number
Rate
Number
Rate
Number
Rate
Number
Rate
Number
Rate
2003
77
142.7
111
204.2
188
173.6
198
82.9
511
225.2
709
152.2
2004
69
124.3
92
165.1
161
144.8
209
85.5
488
211.0
697
146.5
2005
62
107.9
102
177.6
164
142.8
162
65.5
401
171.6
563
117.1
2006
59
102.9
101
170.8
160
137.4
188
75.7
472
196.1
660
135.0
2007
64
110.0
99
166.8
163
138.7
155
61.4
421
172.7
576
116.1
2008
65
109.2
94
156.7
159
133.0
149
58.4
391
159.6
540
107.9
2009
59
96.4
121
199.0
180
147.5
181
69.7
368
149.1
549
108.4
2010
70
111.4
124
200.9
194
155.7
192
72.6
441
176.9
633
123.2
2011
76
118.5
105
168.6
181
143.2
185
69.3
468
187.4
653
126.3
2012
88
136.0
138
221.0
226
177.7
238
89.2
588
236.8
826
160.4
Source: New Zealand National Minimum Dataset
Note: rates are expressed as deaths per 100,000 population.
Suicide Facts: Deaths and intentional self-harm hospitalisations 2011
47
Deprivation
Deprivation quintiles are used to represent the level of deprivation of the area of residence.
Deprivation quintile 1 represents the least deprived areas, and quintile 5 represents the most
deprived areas, according to the 2006 New Zealand Deprivation Index (NZDep 2006).
In 2012, the highest rate of intentional self-harm hospitalisations was among those residing in
deprivation quintile 4. The rate in quintile 4 was 1.8 times the rate for those in quintile 1
(90.9 per 100,000 population compared with 49.6 per 100,000 population) (Table 18).
For males, the rates for quintiles 3–5 were significantly higher than the rates for quintiles 1
and 2. The rate in quintile 4 was 2.5 times the rate in the least deprived quintile (66.0 per
100,000 population compared with 26.8 per 100,000 population).
In 2012, the female intentional self-harm hospitalisations rate was highest in quintile 4
(116.3 per 100,000 population); this rate was 1.6 times higher than the rate in the least deprived
quintile (quintile 1, at 73.3 per 100,000 population) (Table 18). Female rates in the three most
deprived quintiles (3–5) were significantly higher than female rates in the least deprived
quintile (Figure 37).
Table 18: Intentional self-harm hospitalisation numbers and age-standardised rates, by
deprivation quintile and sex, 2012
Deprivation
Male
Female
Total
quintile
Number
Rate
Number
Rate
Number
Rate
1 (least)
117
26.8
287
73.3
404
49.6
2
137
31.9
345
87.1
482
58.6
3
193
44.7
427
102.6
620
73.3
4
284
66.0
494
116.3
778
90.9
5 (most)
270
63.1
462
107.3
732
85.7
Source: New Zealand National Minimum Dataset
Note: rates are expressed per 100,000 population and age-standardised to the WHO World Standard population.
48
Suicide Facts: Deaths and intentional self-harm hospitalisations 2012
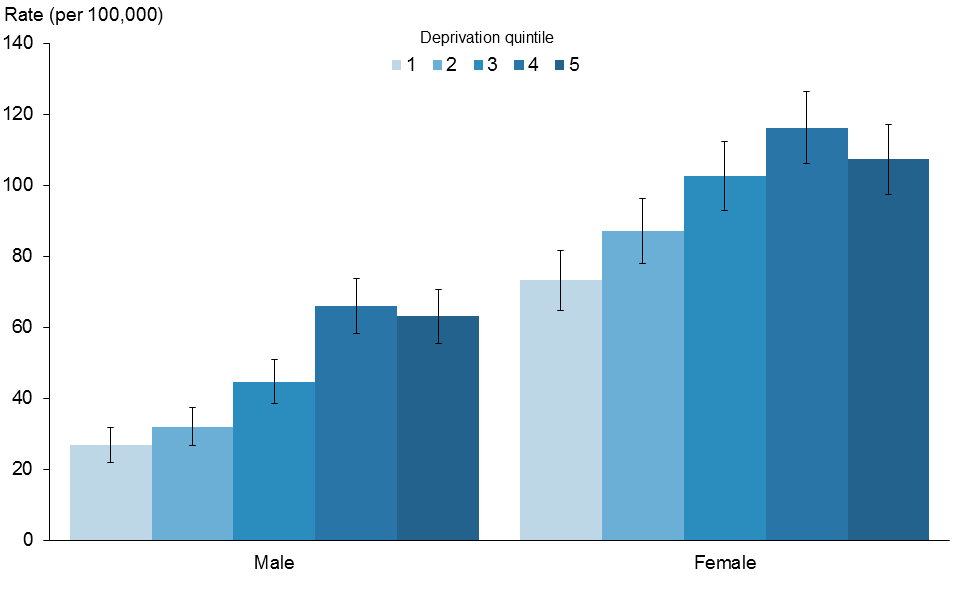 Figure 37: Intentional self-harm hospitalisation age-standardised rates, by deprivation
quintile and sex, 2012
Figure 37: Intentional self-harm hospitalisation age-standardised rates, by deprivation
quintile and sex, 2012
Source: New Zealand National Minimum Dataset
Note: rates are expressed per 100,000 population and age-standardised to the WHO
World Standard population.
Suicide Facts: Deaths and intentional self-harm hospitalisations 2012
49
District health board regions
In this section, data for district health board (DHB) regions has been aggregated over three
years (2010–2012) because intentional self-harm hospitalisation rates can vary considerably
from year to year.
The national rate was 66.0 intentional self-harm hospitalisations per 100,000 population over
the three years from 2010 to 2012.
Eight DHB regions had significantly higher rates for intentional self-harm hospitalisation than
the national rate, with Wairarapa having a notably higher than all other DHB regions (169.0 per
100,000 population).
Auckland, Counties Manukau, Hawke’s Bay and MidCentral DHB regions had significantly
lower rates than the national rate (Table 19, Figures 38 and 39).
Table 19: Intentional self-harm hospitalisation age-standardised rates, by DHB of domicile
and sex, 2010–2012
DHB region
Sex
Male
Female
Total
Rate
CI
Rate
CI
Rate
CI
Northland
68.7
(53.5–83.9)
114.6
(95.5–133.7)
91.7
(79.5–103.9)
Waitemata
48.5
(42.2–54.8)
85.6
(77.3–93.9)
67.0
(61.8–72.2)
Auckland
30.0
(24.8–35.2)
36.8
(30.9–42.7)
33.3
(29.4–37.2)
Counties Manukau
25.7
(20.8–30.6)
34.4
(28.9–39.9)
29.9
(26.3–33.5)
Waikato
49.1
(41.2–57.0)
80.7
(70.6–90.8)
64.9
(58.5–71.3)
Lakes
60.6
(44.0–77.2)
79.1
(59.9–98.3)
69.9
(57.2–82.6)
Bay of Plenty
62.1
(50.0–74.2)
120.5
(103.9–137.1)
91.2
(80.9–101.5)
Tairawhiti
50.6
(27.5–73.7)
94.3
(62.9–125.7)
72.7
(53.2–92.2)
Hawke’s Bay
39.4
(28.5–50.3)
43.4
(32.2–54.6)
41.4
(33.6–49.2)
Taranaki
57.8
(41.9–73.7)
99.7
(78.6–120.8)
78.3
(65.2–91.4)
MidCentral
32.1
(22.5–41.7)
70.9
(56.8–85.0)
51.6
(43.1–60.1)
Whanganui
61.0
(39.8–82.2)
67.9
(45.1–90.7)
64.2
(48.7–79.7)
Capital & Coast
51.5
(42.8–60.2)
146.6
(132.1–161.1)
100.0
(91.5–108.5)
Hutt Valley
57.0
(43.6–70.4)
123.1
(103.5–142.7)
90.3
(78.4–102.2)
Wairarapa
97.2
(62.8–131.6)
242.1
(185.4–298.8)
169.0
(136.0–202.0)
Nelson Marlborough
47.7
(35.2–60.2)
190.7
(163.2–218.2)
116.4
(101.7–131.1)
West Coast
75.5
(42.6–108.4)
155.2
(106.0–204.4)
114.9
(85.5–144.3)
Canterbury
38.6
(32.8–44.4)
86.6
(77.6–95.6)
62.2
(56.9–67.5)
South Canterbury
59.8
(36.6–83.0)
102.0
(71.3–132.7)
81.0
(61.7–100.3)
Southern
57.6
(48.5–66.7)
121.3
(107.9–134.7)
89.4
(81.3–97.5)
National
45.2
(40.0–50.4
87.0
(81.0–93.0)
66.0
(62.0–70.0)
Source: New Zealand National Minimum Dataset
Notes:
Rates are expressed per 100,000 population and age-standardised to the WHO World Standard population.
Rates were calculated based on the total number of intentional self-harm hospitalisations between 2010 and 2012.
For the national rate, the denominator population is the aggregated estimated resident population for 2010–2012.
Confidence intervals (CI) are for 99% confidence (lower limit–upper limit).
50
Suicide Facts: Deaths and intentional self-harm hospitalisations 2012
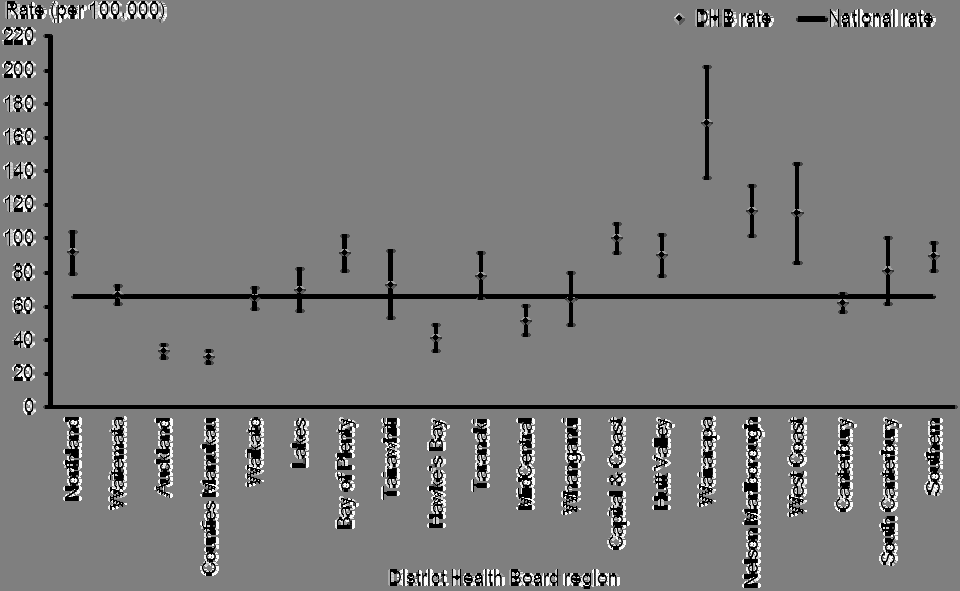
 Figure 38: Intentional self-harm hospitalisation age-standardised rates, by DHB,
2010–2012
Figure 38: Intentional self-harm hospitalisation age-standardised rates, by DHB,
2010–2012
Source: New Zealand National Minimum Dataset
Note: rates are expressed per 100,000 population and age-standardised to the WHO
World Standard population.
Figure 39: Comparison of DHB region intentional self-harm hospitalisation rates with
national rate, 2010–2012
All ages
Youth
Northland
Auckland
Auckland
Counties Manukau
Counties Manukau
Bay of Plenty
Bay of Plenty
Capital & Coast
Hawke's Bay
Capital & Coast
Hawke's Bay
Hutt Valley
MidCentral
MidCentral
Wairarapa
Wairarapa
Nelson Marlborough
Nelson Marlborough
West Coast
West Coast
Difference from the
national rate of intentional
Southern
Southern
self-harm hospitalisations
significantly lower
not significantly different
significantly higher
Notes:
Intentional self-harm hospitalisation rates for all ages are expressed per 100,000 population and age-standardised to
the WHO World Standard population.
Youth rates are age-specific, expressed as intentional self-harm hospitalisations per 100,000 population.
Suicide Facts: Deaths and intentional self-harm hospitalisations 2012
51
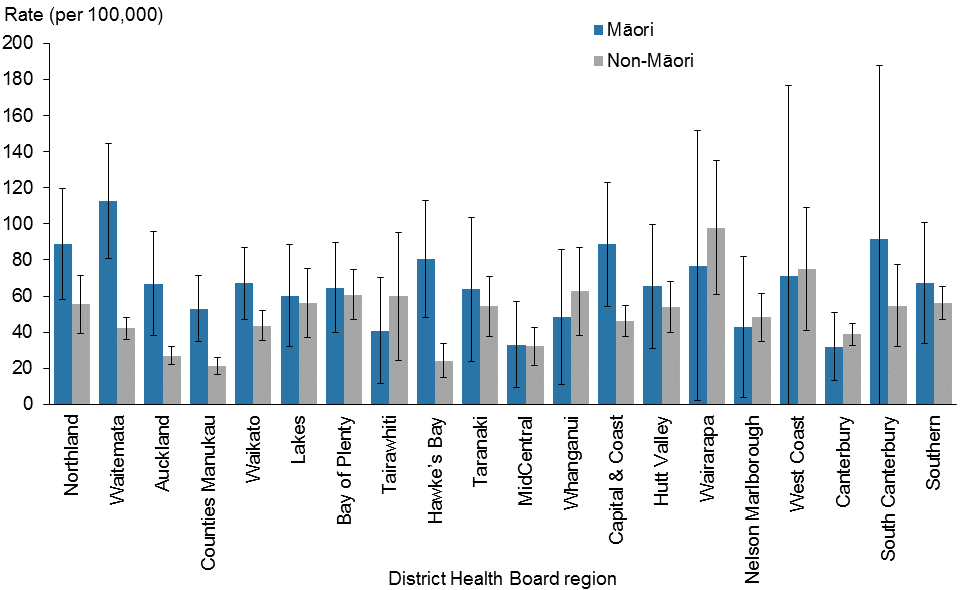 Māori and non-Māori comparison
There was considerable variation between DHB regions for Māori and non-Māori rates of
intentional self-harm hospitalisations over the period 2010–2012.
Among Māori, the highest rates were in the Waitemata DHB region for males and the Wairarapa
DHB region for females. The highest non-Māori rates for both males and females were seen in
the Wairarapa DHB region (Figures 40 and 41). However, when the DHB region data is broken
down into population subgroups, the numbers in some subgroups (for example, Māori males)
are small and therefore should be treated with caution.
Figure 40: Intentional self-harm hospitalisation age-standardised rates for males, by DHB
and ethnic group, 2010–2012 (aggregated data)
Source: New Zealand National Minimum Dataset
Note: rates are expressed per 100,000 population and age-standardised to the WHO
World Standard population.
52
Suicide Facts: Deaths and intentional self-harm hospitalisations 2012
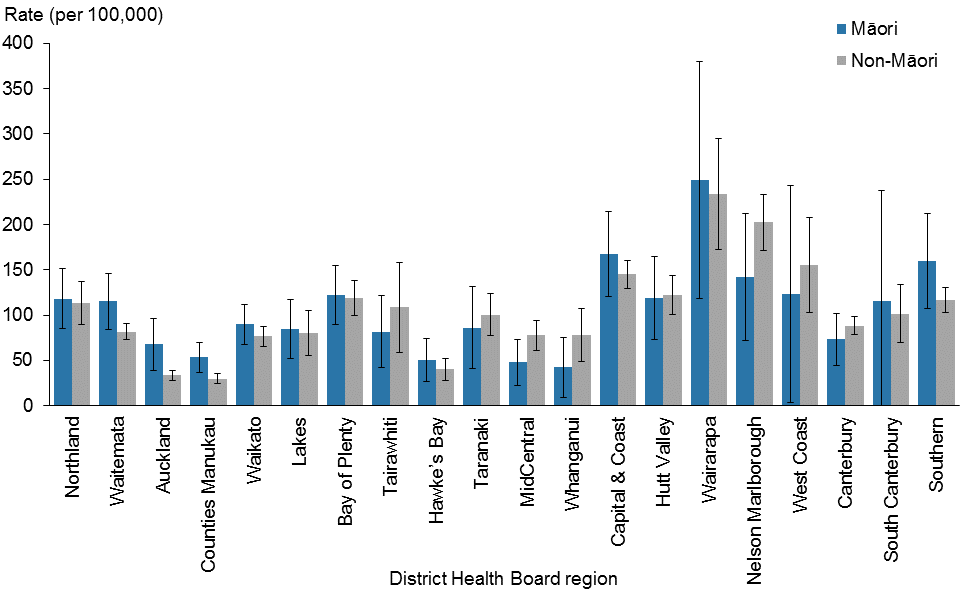 Figure 41: Intentional self-harm hospitalisation age-standardised rates for females, by
DHB and ethnic group, 2010–2012 (aggregated data)
Figure 41: Intentional self-harm hospitalisation age-standardised rates for females, by
DHB and ethnic group, 2010–2012 (aggregated data)
Source: New Zealand National Minimum Dataset
Note: rates are expressed per 100,000 population and age-standardised to the WHO
World Standard population.
Suicide Facts: Deaths and intentional self-harm hospitalisations 2012
53
References
Ahmad O, Boschi-Pinto C, Lopez AD, et al. 2001.
Age Standardization of Rates: A new WHO
standard. GPE discussion paper series no. 31. Geneva: World Health Organization.
URL:
www.who.int/healthinfo/paper31.pdf (accessed 8 December 2012).
Ajwani S, Blakely T, Robson B, et al. 2003.
Decades of Disparity: Ethnic mortality trends in New
Zealand 1980–
1999. Wellington: Ministry of Health and University of Otago.
Andriessen K. 2006. Do we need to be cautious in evaluating suicide statistics?
European Journal of
Public Health 16(4): 445–7.
Associate Minister of Health. 2006.
New Zealand Suicide Prevention Strategy 2006–2016.
Wellington: Ministry of Health.
Benzeval M, Judge K, Shouls S. 2001. Understanding the relationship between income and health:
how much can be gleaned from cross-sectional data?
Social Policy and Administration 35: 376–96.
Berry J, Harrison J. 2006. Hospital separations due to injury and poisoning, Australia 2001–02.
Injury Research and Statistics Series Number 26. Adelaide: Australian Institute of Health and
Welfare.
Blakely T. 2002.
The New Zealand Census – Mortality Study: Socioeconomic inequalities and adult
mortality 1991–94. Wellington: Ministry of Health.
Ministry of Health. 2004.
Ethnicity Data Protocols for the Health and Disability Sector. Wellington:
Ministry of Health.
Ministry of Health. 2013.
New Zealand Suicide Prevention Action Plan 2013–2016. Wellington:
Ministry of Health.
National Centre for Classification in Health. 2002.
The International Statistical Classification of
Diseases and Related Health Problems, 9th Revision, Clinical Modification (ICD-9-CM). Sydney:
National Centre for Classification in Health.
National Centre for Classification in Health. 2008.
The International Statistical Classification of
Diseases and Related Health Problems, 10th Revision, Australian Modification (ICD-10–AM).
Sydney: National Centre for Classification in Health.
OECD. nd. Organisation for Economic Co-operation and Development StatExtracts. URL
http://stats.oecd.org/index.aspx?DataSetCode=HEALTH_STAT (accessed 26 February 2015).
Salmond C, Crampton P, Atkinson J. 2007.
NZDep2006 Index of Deprivation User’s Manual.
Wellington: Department of Public Health, University of Otago.
Statistics New Zealand. 2014.
Serious Injury Outcome Indicators: 2000–13. Wellington: Statistics
New Zealand. URL:
www.stats.govt.nz/browse_for_stats/health/injuries/serious-injury-outcome-
indicators-2000–11.aspx (accessed 26 February 2015).
Waterhouse J, Muir C, Correa P, et al (eds). 1976.
Cancer Incidence in Five Continents, Vol III. IARC
Scientific Publications No. 15. Lyon, France: International Agency for Research on Cancer.
White P, Gunston J, Salmond C, et al. 2008.
Atlas of Socioeconomic Deprivation in New Zealand:
NZDep2006. Wellington: Ministry of Health.
54
Suicide Facts: Deaths and intentional self-harm hospitalisations 2012
Appendices
Appendix 1: Technical notes
Data
Population denominator
Population analysis was based on the estimated resident population of New Zealand by sex, age,
ethnic group, district health board (DHB) (for total population) and rural/urban status as
calculated by Statistics New Zealand.
Asian and Pacific populations, deprivation populations and DHB populations by ethnic group
were sourced from Ministry of Health projected populations supplied by Statistics New Zealand.
The suicide and intentional self-harm hospitalisation rates presented in this report and the last six
years’ reports will differ from those given in editions of
Suicide Facts preceding the 2006 report as
data from 2005 or earlier used different population denominators (the only exception to this is the
deprivation data and data for Pacific people, for which population projections were used).
Small numbers and rates
Caution is advised when interpreting rates derived from small numbers as they may fluctuate
markedly over time. This may apply to both small numbers of cases and/or small population
groups.
International comparisons
New Zealand data is for 2012 whereas all other countries’ data is for years between 2009 and
2012.
A cautious approach is recommended when comparing international suicide statistics because
many factors affect the recording and classification of suicide in different countries, including
the level of proof required for a verdict; the stigma associated with suicide; the religion, social
class or occupation of victims; and confidentiality (Andriessen 2006). As a result, deaths that
are classified as suicide in some countries may be classified as accidental or of undetermined
intent in others.
Furthermore, statistical measures, such as confidence intervals, cannot account for these
differences. Providing such statistical measures may create a false sense of confidence in the
recording of differences. Confidence intervals have therefore been excluded from the section on
international comparisons in this report. The data used in this report to make international
comparisons is the most recent data available from the Organisation for Economic Co-operation
and Development (OECD).
Suicide Facts: Deaths and intentional self-harm hospitalisations 2012
55
Serious injury outcome indicators reports
Statistics New Zealand produces the annual serious injury outcome indicators reports (see
Statistics New Zealand 2013). These reports monitor numbers and rates of suicide death. The
information for the reports is sourced from the New Zealand Mortality Collection (MORT) and
is therefore broadly comparable with the information published in
Suicide Facts. MORT is a
dynamic database, and any small discrepancies in data between it and
Suicide Facts are due to
updates to database records.
The serious injury outcome indicators reports also present data on ‘Serious non-fatal intentional
self-harm injury’. These indicators cover only a subset of the self-harm hospitalisation data held
within
Suicide Facts and therefore cannot be directly compared.
For more information and access to the serious injury outcome indicators technical report for
2014, please see the Statistics New Zealand webpage:
www.stats.govt.nz/browse_for_stats/health/injuries/serious-injury-outcome-tech-report-
2014.aspx
If you require further information relating to the methodology, classifications and processes
used, and how they differ between publications, please contact:
[email address]
56
Suicide Facts: Deaths and intentional self-harm hospitalisations 2012
Appendix 2: Definitions
Intentional self-harm codes and definitions
For the years 2000–2012,
The International Statistical Classification of Diseases and Related
Health Problems, 10th Revision, Australian Modification (ICD-10-AM) codes used for mortality
and hospitalisation data were X60–X84: Intentional self-harm (National Centre for
Classification in Health 2008) (Table A1).
Before the year 2000, the codes used were E950–E959: Suicide and self-inflicted injury from
The International Statistical Classification of Diseases and Related Health Problems, 9th
Revision, Clinical Modification (ICD-9-CM) (National Centre for Classification in Health 2002).
Code E959 was excluded from pre-2000 hospitalisation data in this report because it covers ‘late
effects’ and hence is not relevant to current episodes.
Table A1: Intentional self-harm categories and ICD-10-AM codes
Category
ICD-10-AM code ICD-10-AM code description
Poisoning by solids and
X60
Intentional self-poisoning by and exposure to nonopioid
liquids
analgesics, antipyretics and antirheumatics
X61
Intentional self-poisoning by and exposure to antiepileptic,
sedative-hypnotic, antiparkinsonism and psychotropic drugs, not
elsewhere classified
X62
Intentional self-poisoning by and exposure to narcotics and
psychodysleptics [hallucinogens], not elsewhere classified
X63
Intentional self-poisoning by and exposure to other drugs acting
on the autonomic nervous system
X64
Intentional self-poisoning by and exposure to other and
unspecified drugs, medicaments and biological substances
X65
Intentional self-poisoning by and exposure to alcohol
X68
Intentional self-poisoning by and exposure to pesticides
X69
Intentional self-poisoning by and exposure to other and
unspecified chemicals and noxious substances
Poisoning by gases and
X66
Intentional self-poisoning by and exposure to organic solvents
vapours
and halogenated hydrocarbons and their vapours
X67
Intentional self-poisoning by and exposure to other gases and
vapours
Hanging, strangulation and
X70
Intentional self-harm by hanging, strangulation and suffocation
suffocation
Submersion (drowning)
X71
Intentional self-harm by drowning and submersion
Firearms and explosives
X72
Intentional self-harm by handgun discharge
X74
Intentional self-harm by other and unspecified firearm discharge
X75
Intentional self-harm by explosive material
Sharp object
X78
Intentional self-harm by sharp object
Jumping from a high place
X80
Intentional self-harm by jumping from a high place
Other
X76
Intentional self-harm by smoke, fire and flames
X77
Intentional self-harm by steam, hot vapours and hot objects
X79
Intentional self-harm by blunt object
X81
Intentional self-harm by jumping or lying before moving object
X82
Intentional self-harm by crashing of motor vehicle
X83
Intentional self-harm by other specified means
X84
Intentional self-harm by unspecified means
Note: in Table 11 and Figure 24, ‘sharp object’ and ‘jumping from a high place’ were grouped into ‘Other’.
Suicide Facts: Deaths and intentional self-harm hospitalisations 2012
57
Analytical methods definitions
Age-specific rates
An age-specific rate measures the frequency with which an event occurs relative to the number
of people in a defined age group. In
Suicide Facts, age-specific rates are given in both five-year
age groups and life-stage age groups.
Age-standardised rates and rate ratios
An
age-standardised rate is a rate that has been adjusted to take account of differences in the
age distribution of the population over time or between different groups (for example, different
ethnic groups). An age-standardised rate ratio is the ratio of two groups’ rates, taking into
account differences in the groups’ size and age structure.
This report has used the WHO standard world population in determining direct age-
standardised rates and rate ratios (Table A2) (Ahmad et al 2001).
Table A2: The WHO World Standard Population
Age group
Population
(years)
0–4
8860
5–9
8690
10–14
8600
15–19
8470
20–24
8220
25–29
7930
30–34
7610
35–39
7150
40–44
6590
45–49
6040
50–54
5370
55–59
4550
60–64
3720
65–69
2960
70–74
2210
75–79
1520
80–84
910
85+
635
Total
100,035
Source: Waterhouse et al 1976.
58
Suicide Facts: Deaths and intentional self-harm hospitalisations 2012
Confidence intervals and statistical significance
The confidence intervals in this report have been calculated for age-standardised rates at the
95% level, except for rates for DHB data, which have been calculated at the 99% level.
A confidence interval is a range of values used to describe the uncertainty around a single value
(such as an age-standardised rate). Confidence intervals describe how different the estimate
could have been if chance had led to a different set of data. Confidence intervals are calculated
with a stated probability, typically 95% (which would indicate that there is a 95% chance that the
true value lies within the confidence intervals).
Confidence intervals can assist in comparing rates between different groups. If two confidence
intervals do not overlap, then it is reasonable to assume that any difference between the two
groups being compared is not due to chance. If they do overlap, it is not possible to draw any
conclusion about the significance of any difference between the two groups being compared.
Numbers, rates and ratios
The number of suicide deaths refers to the number of people who have died by suicide. The
number
of
intentional self-harm hospitalisations refers to the number of discharges from
hospital with an intentional self-harm code on the patient’s record.
The rate of suicide or intentional self-harm hospitalisations refers to the frequency with which
these events occur relative to the number of people in a defined population and a defined time
period.
The rate ratio refers to the frequency with which these events are reported in one population
group compared with other groups.
Other definitions
Admission
The process by which a person becomes a resident in a health care facility. For the purposes of
the Ministry of Health’s national collections, health care users who receive assessment and/or
treatment for three hours or more, or who have a general anaesthetic are to be admitted. This
also applies to health care users of Emergency Departments. ‘Assessment/treatment’ is clinical
assessment, treatment, therapy, advice, diagnostic or investigatory procedures from a nurse or
doctor or other health professional.
Deprivation
Deprivation has been associated with various adverse health outcomes. From the social
inequalities literature, it is evident that those who are most deprived generally experience
poorer health (Benzeval et al 2001; White et al 2008). Suicide mortality and hospitalisation
rates for intentional self-harm are presented in this report by deprivation quintile according to
the New Zealand Deprivation Index 2006 (NZDep2006) (Salmond et al 2007).
The New Zealand Deprivation Index is a measure of socioeconomic status calculated for small
geographic areas. The calculation uses a range of variables from the 2006 Census of Population
and Dwellings that represent nine dimensions of social deprivation. The Deprivation Index is
calculated at the level of meshblocks (the smallest geographical units that Statistics New
Zealand uses to collect and measure statistical data, containing a median of 90 people), and the
Ministry of Health maps these meshblocks to domicile codes, which are built up to the relevant
geographic scale using weighted average census (usually resident population) counts.
Suicide Facts: Deaths and intentional self-harm hospitalisations 2012
59
The nine variables (proportions in small areas) in the index, by decreasing weight, are:
1.
income: people aged 18–64 years4 receiving a means-tested benefit
2.
income: people living in an equivalised5 household whose income is below a certain
threshold
3.
home ownership: people not living in their own home
4.
support: people aged under 65 years living in a single-parent family
5.
employment: people aged 18–64 years who are unemployed
6.
qualifications: people aged 18–64 years with no qualifications
7.
living space: people living in an equivalised household below a bedroom occupancy
threshold
8.
communication: people with no access to a telephone
9.
transport: people with no access to a car.
Further information is available from www.health.govt.nz (search for ‘NZDep2006 Index of
Deprivation’).
Ethnicity
There are different methods for outputting ethnicity data. This report uses ‘prioritised ethnicity’,
where each person represented in the data is allocated to a single ethnic group using the priority
system Māori > Pacific peoples > Asian > European/Other (Ministry of Health 2004). The aim
of prioritisation is to ensure that, where it is necessary to assign people to a single ethnic group,
ethnic groups that are small or important in terms of policy are not swamped by the European
ethnic group (Ministry of Health 2004). This is a more robust method of dealing with the low
rate of multiple ethnicities in health-sector data.
This report uses two ethnic classifications for analysing suicides and intentional self-harm
hospitalisations. The first comprises Māori, Pacific peoples, Asian and European & Other and
the second divides the population into Māori and non-Māori.
Before 1996, the concept of ethnicity was based on biological race (that is, percentage of blood),
as recorded on death registration forms, and on a sociocultural concept (that is, cultural
affiliation) as defined in the census. Since September 1995, death certificates have included a
question comparable with the self-identified ethnicity question in the 1996 Census, which allows
a person to have multiple ethnic identities. New Zealand Census Mortality Study (NZCMS)
adjustors can be applied to mortality counts from 1996 to 1999 (Blakely 2002). This process
adjusts data to allow for an undercount of Māori and Pacific peoples. The NZCMS adjustors are
not used in this report. From 2000 onwards, comparisons across all ethnic groups have been
possible because adjustors are not necessary. For further discussion on inconsistencies in
ethnicity collection, refer to
Decades of Disparity (Ajwani et al 2003).
Provisional data
The label ‘provisional’ relates to information that is not final; that is, it is subject to change. See
the subsection Classification of a suicide death in the Introduction for more information.
4 The upper age boundary of 65 years has been increased from the NZDep2001 value of 60 years to better reflect
societal norms.
5 Equivalisation is a method used to control the range of possible household compositions.
60
Suicide Facts: Deaths and intentional self-harm hospitalisations 2012
Urban/rural profile
This report includes a classification of deaths by the urban/rural profile of the person
committing suicide. The address recorded on the person’s death certificate is used to determine
whether the person’s place of residence was urban or rural. Statistics New Zealand has
developed an experimental urban/rural profile, which was used to allocate a profile to people
committing suicide for the data in this report. For more information on urban/rural profiles,
see
: www.stats.govt.nz/browse_for_stats/people_and_communities/geographic-areas/urban-
rural-profile-update.aspx
Suicide Facts: Deaths and intentional self-harm hospitalisations 2012
61
Appendix 3: Further tables
Table A3: Intentional self-harm short-stay emergency department hospitalisations, by
DHB of domicile, 2003–2012
DHB of domicile
Year of discharge
2003
2004
2005
2006
2007
2008
2009
2010
2011
2012
Northland
38
43
55
73
65
63
79
88
78
104
Waitemata
380
320
310
369
422
468
433
387
368
474
Auckland
383
444
419
489
462
518
497
531
463
555
Counties Manukau
376
373
451
436
468
505
481
546
568
625
Waikato
184
203
224
245
71
148
248
310
368
356
Lakes
39
56
59
53
53
75
59
53
82
92
Bay of Plenty
13
12
5
22
70
91
94
92
118
122
Tairawhiti
0
0
0
0
0
0
2
8
4
6
Taranaki
24
7
1
0
0
25
62
76
63
73
Hawke’s Bay
0
0
0
43
67
88
150
175
174
176
MidCentral
0
19
114
131
181
177
190
192
182
200
Whanganui
12
13
11
16
18
44
89
77
80
84
Capital & Coast
1
3
2
7
1
20
215
317
250
226
Hutt Valley
0
0
0
0
0
0
0
0
32
56
Wairarapa
0
0
0
0
0
0
0
1
6
16
Nelson Marlborough
0
0
0
0
0
18
50
64
69
92
West Coast
14
9
23
3
4
0
1
0
2
2
Canterbury
508
408
443
519
427
514
497
566
559
507
South Canterbury
0
1
0
0
0
0
0
0
0
0
Southern
105
155
137
139
152
131
154
175
166
276
Overseas and undefined
8
15
12
4
2
10
11
7
11
12
Total
2085
2081
2266
2549
2463
2895
3312
3665
3643
4054
Source: New Zealand National Minimum Dataset
Notes:
‘Short stay’ is defined as a stay of one day or less in an emergency department.
In 2010 Southland and Otago DHBs merged to form Southern DHB. Data for Southern DHB is an aggregate of
Southland and Otago DHB data for the years 2003─2009.
62
Suicide Facts: Deaths and intentional self-harm hospitalisations 2012
Table A4: Intentional self-harm hospitalisations within two days of a previous intentional
self-harm hospitalisation, by DHB of domicile, 2003–2012
DHB of domicile
Year of discharge
2003
2004
2005
2006
2007
2008
2009
2010
2011
2012
Northland
16
20
15
8
13
11
12
23
12
13
Waitemata
44
58
34
45
45
43
32
49
33
55
Auckland
32
27
19
16
16
23
31
30
16
39
Counties Manukau
9
11
10
10
15
13
5
3
10
9
Waikato
34
41
51
28
31
27
43
31
24
41
Lakes
10
6
3
6
11
7
9
9
6
10
Bay of Plenty
14
23
20
10
21
21
19
27
21
53
Tairawhiti
4
3
5
2
7
3
6
5
4
6
Taranaki
14
17
20
25
19
18
16
21
11
20
Hawke’s Bay
5
2
1
8
1
4
0
4
4
0
MidCentral
19
21
11
15
11
9
5
12
2
8
Whanganui
1
0
1
0
5
1
0
3
4
4
Capital & Coast
14
14
7
8
12
10
15
50
24
27
Hutt Valley
32
12
9
10
16
5
9
17
10
24
Wairarapa
7
2
0
2
1
8
0
3
3
6
Nelson Marlborough
5
5
5
8
7
3
8
7
8
31
West Coast
19
10
14
9
10
9
7
7
4
2
Canterbury
82
82
57
50
29
15
14
23
12
28
South Canterbury
12
6
3
6
3
1
2
2
4
1
Southern
13
15
15
15
22
12
35
50
65
65
Overseas and undefined
2
0
2
1
1
0
1
1
2
1
Total
388
375
302
282
296
243
269
377
279
443
Source: New Zealand National Minimum Dataset
Notes:
This data is displayed using the DHB of domicile rather than the DHB agency as many hospitalisations within two
days of discharge take place in different DHBs.
This data excludes short-stay emergency department hospitalisations.
In 2010 Southland and Otago DHBs merged to form Southern DHB. Data for Southern DHB is an aggregate of
Southland and Otago DHB data for the years 2003─2009.
Suicide Facts: Deaths and intentional self-harm hospitalisations 2012
63
Further information
General information about suicide prevention
To find out more about suicide and suicide prevention (including information about the
New
Zealand Suicide Prevention Strategy 2006–2016, Associate Minister of Health 2006
), see the
Ministry of Health’s suicide prevention webpage
(www.health.govt.nz/our-work/mental-health-and-addictions/suicide-prevention).
Statistics
A set of online tables accompanies this document and provides underlying data for some graphs
presented in the document, as well as time-series data.
For health data, including suicide statistics, contact:
Analytical Services
National Collections and Reporting
National Health Board
Ministry of Health
PO Box 5013
Wellington
Phone: (04) 496 2000
Fax: (04) 816 2898
Email: data
-[email address]
Websi
te: www.health.govt.nz
Earlier copies of this publication
To download copies of
Suicide Facts for previous years, see the Ministry of Health webpage
(www.health.govt.nz/nz-health-statistics/health-statistics-and-data-sets/suicide-facts-deaths-
and-intentional-self-harm-hospitalisations-series).
64
Suicide Facts: Deaths and intentional self-harm hospitalisations 2012
Document Outline