
RAISED SAFETY PLATFORM
EVALUATION
under the Official Information Act 1982
GORDONTON AND THOMAS ROAD INTERSECTION, HAMILTON
Hamish Mackie| Michael Blewden I Rebekah Thorne l Lily Hirsch
Released
27 AUGUST 2019
1982
Act
Information
Official
the
under
Released
EXECUTIVE SUMMARY
Background
Raised safety platforms (RSPs) were introduced at the signalised intersection of Gordonton and
Thomas Roads, Hamilton, to improve alignment with Safe System principles and performance,
1982
particularly with respect to the severity of side-impact crashes. The treatment aims to ensure
that intersection speeds do not exceed 50km/h, the upper speed at which side-impact forces
are within human tolerances and therefore survivable.
Act
Previously, the intersection was unsignalised and vehicles were passing through with 85%
speeds of around 80 km/h. Various interim safety treatments have been introduced, and in
more recent times signals have been introduced at the intersection, reflecting the development
and growing road use in the area.
While the feasibility of RSPs has been established overseas, here in New Zealand, they are new.
There is a need to monitor the performance of their use to establish whether they are
performing as expected, and through objective evidence, understand if there are any issues
ahead of further rollout.
Raised safety platform evaluation
Information
An evaluation was conducted to examine the performance of the RSPs as a Safe System solution
for reducing DSI crashes. The evaluation also examined any potential associated safety risks
with RSPs, and learnings obtained from delivery and operational performance.
The evaluation framework established dimensions of merit and performance standards under
the criteria of
safety improvements, associated safety risks, and
delivery and operation. The
standards defined the level of performance needed on each dimension. The evaluation findings
Official
were interpreted against the evaluation framework to derive conclusions about the overall
effectiveness of the RSPs.
The measures, methods, and data sources used in the evaluation were as below.
the
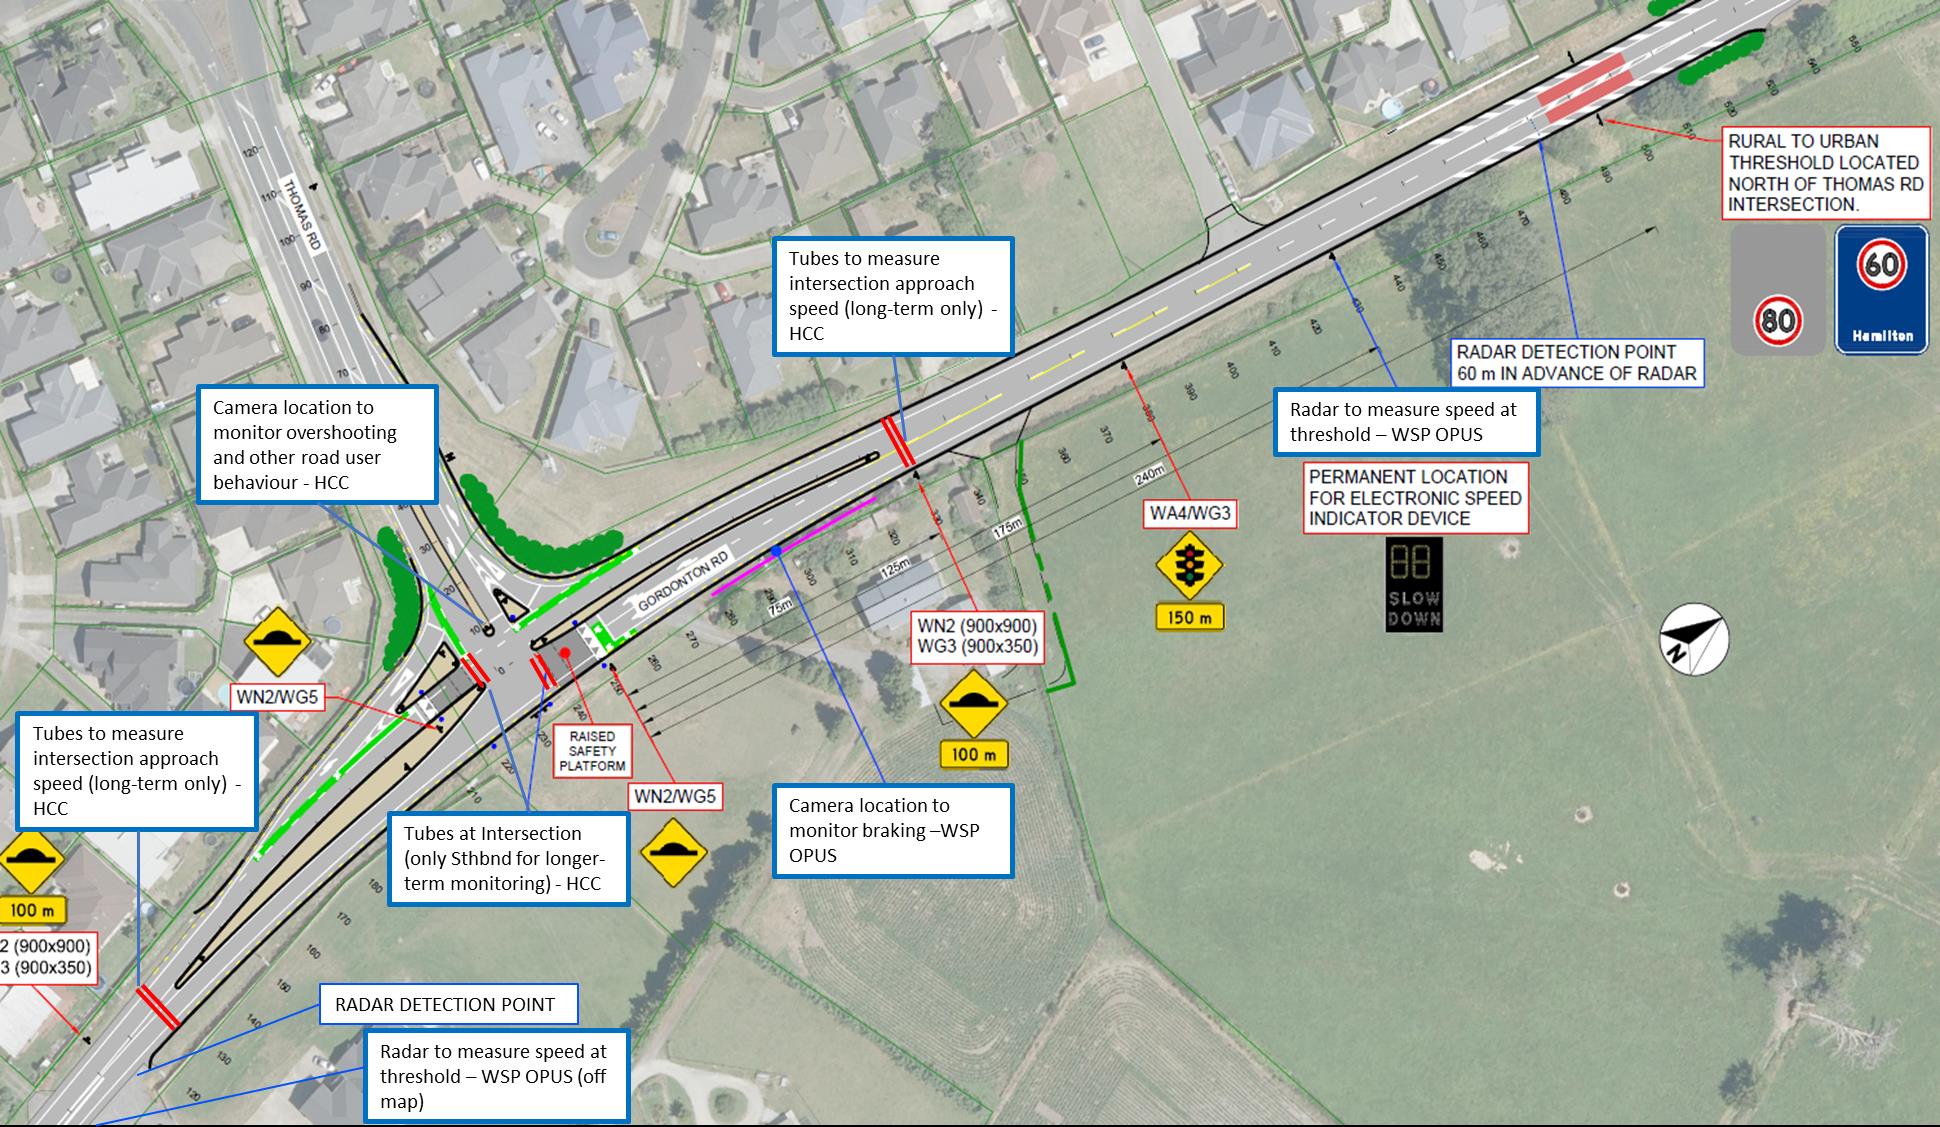
• Vehicle speed1 - measured using speed tubes (approximately 100 metres south, at the
intersection, approximately 100 metres north) and also on the wider approach via fixed
speed radars (speed threshold - north, 60km/h speed zone-south).
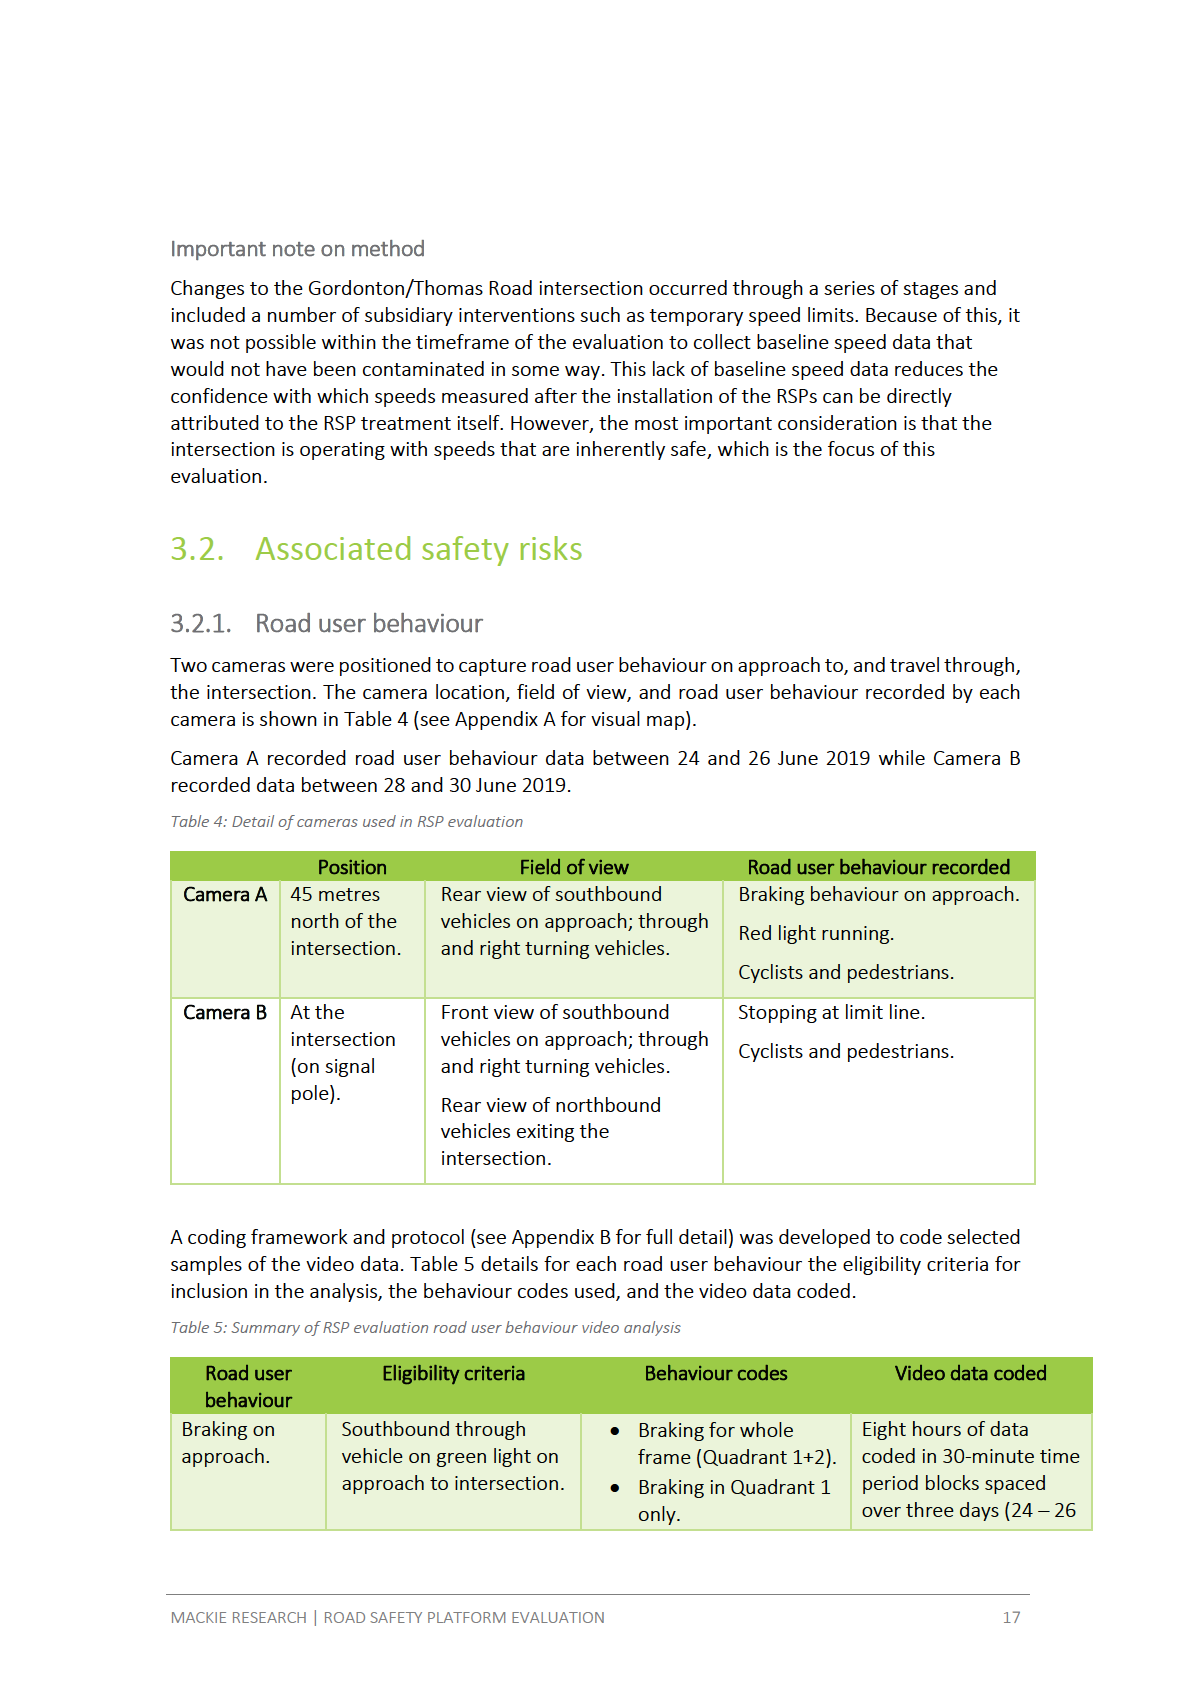
• Road user behaviour (braking behaviour on approach, red light running, stopping at the
under
limit line, pedestrians and cyclists) - recorded by video camera positioned north of the
intersection and at the intersection.
• Perceived safety (community) - measured through monitoring Hamilton City Council’s
online and telephone customer service channels for any safety related complaints or
concerns about the RSPs.
• Impact on traffic flow and throughput - assessed by a Hamilton City Council Transport
Systems Engineer.
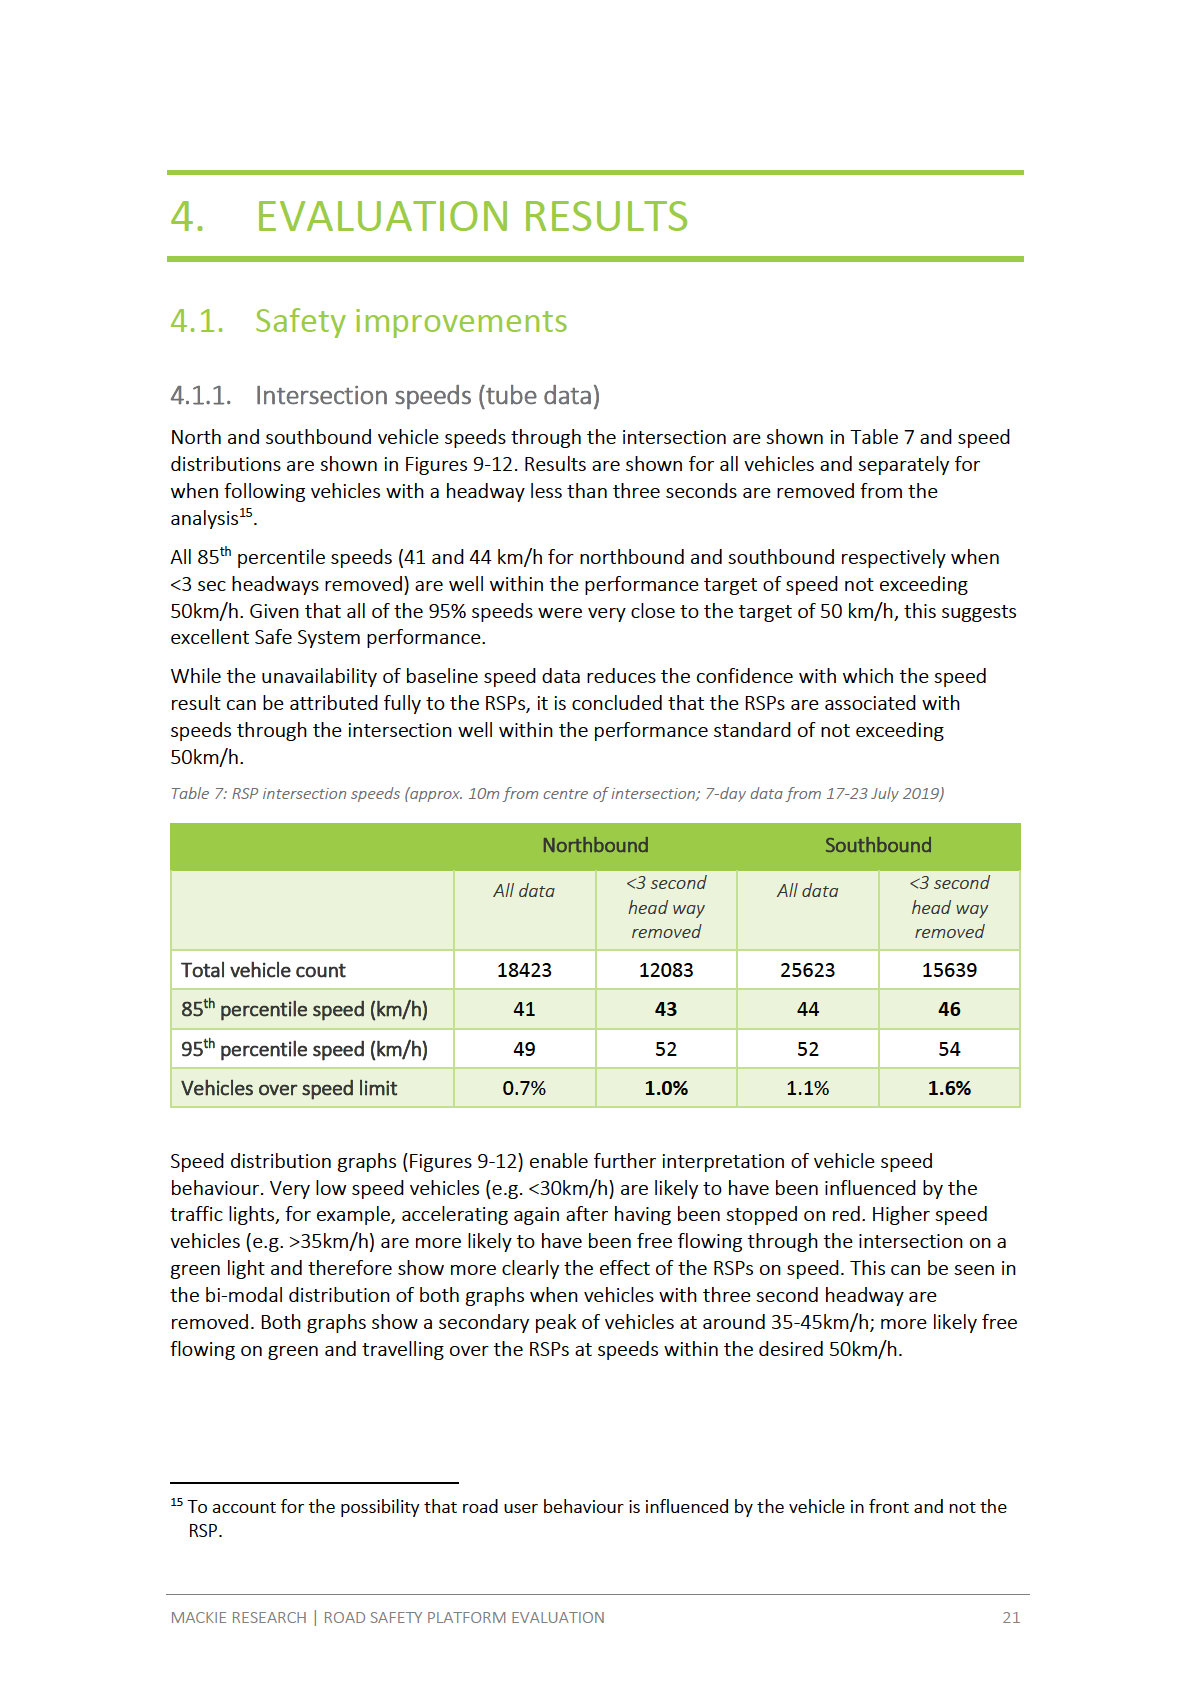
• Vertical acceleration - measured travelling north and south over the RSPs in a light
passenger vehicle at various speeds.
Released
1 Suitable baseline speed data was not available, limiting the confidence with which measured speeds after
installation of the RSPs can be directly attributed to the RSPs alone. Also, while we are interested in the speed
behaviour on the approaches to the RSP, only the intersection speeds were used as success criteria.
MACKIE RESEARCH | RAISED SAFETY PLATFORM EVALUATION - DRAFT REPORT
ii
• Development and delivery issues – as reported by project staff and stakeholders at a
post-delivery 'lessons learned' workshop and end of project report.
• Council and community buy-in - as identified through the monitoring of customer
service channels and as reported by project staff (as above).
Evaluation results
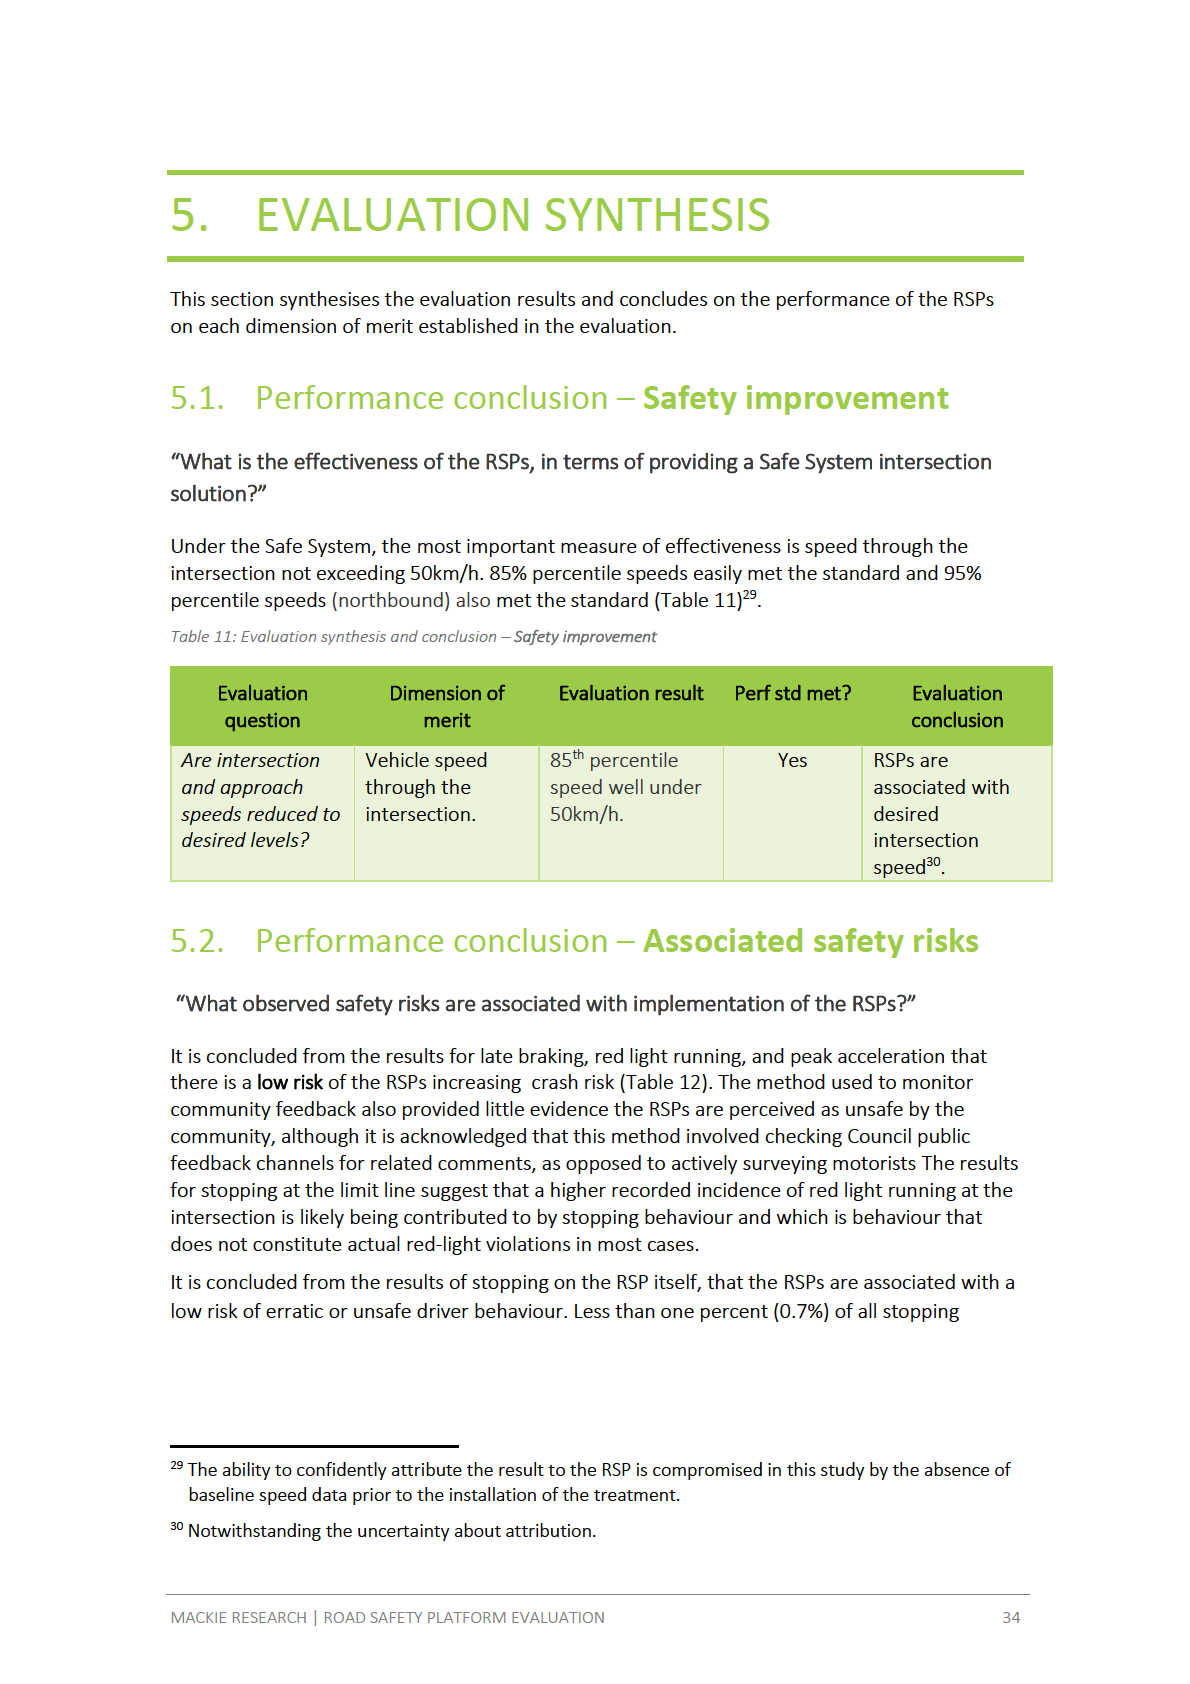
Following the installation and full operation of the RSPs, 85th percentile speeds through the
intersection were well below 50km/h and comfortably met the performance target of not
1982
exceeding 50km/h. This is a significant improvement on the previous high intersection speeds of
around 80 km/h. Radar measured speed at the southbound and northbound wider approaches
exceeded the speed limit, and while these measures do not reflect the performance of the Act
RSPs, they may warrant further attention. These relatively high speeds on approach further
reinforce the effectiveness of the RSPs (and other intersection features) in supressing speed to
safe system levels through the intersection.
Performance standards were met on five dimensions of
associated safety risks, while there was
insufficient data to conclude on a sixth (impact on behaviour and safety of vulnerable road
users). Overall, it is concluded that crash risk resulting from the RSPs is low, and rather they are
likely to significantly reduce crash risk.
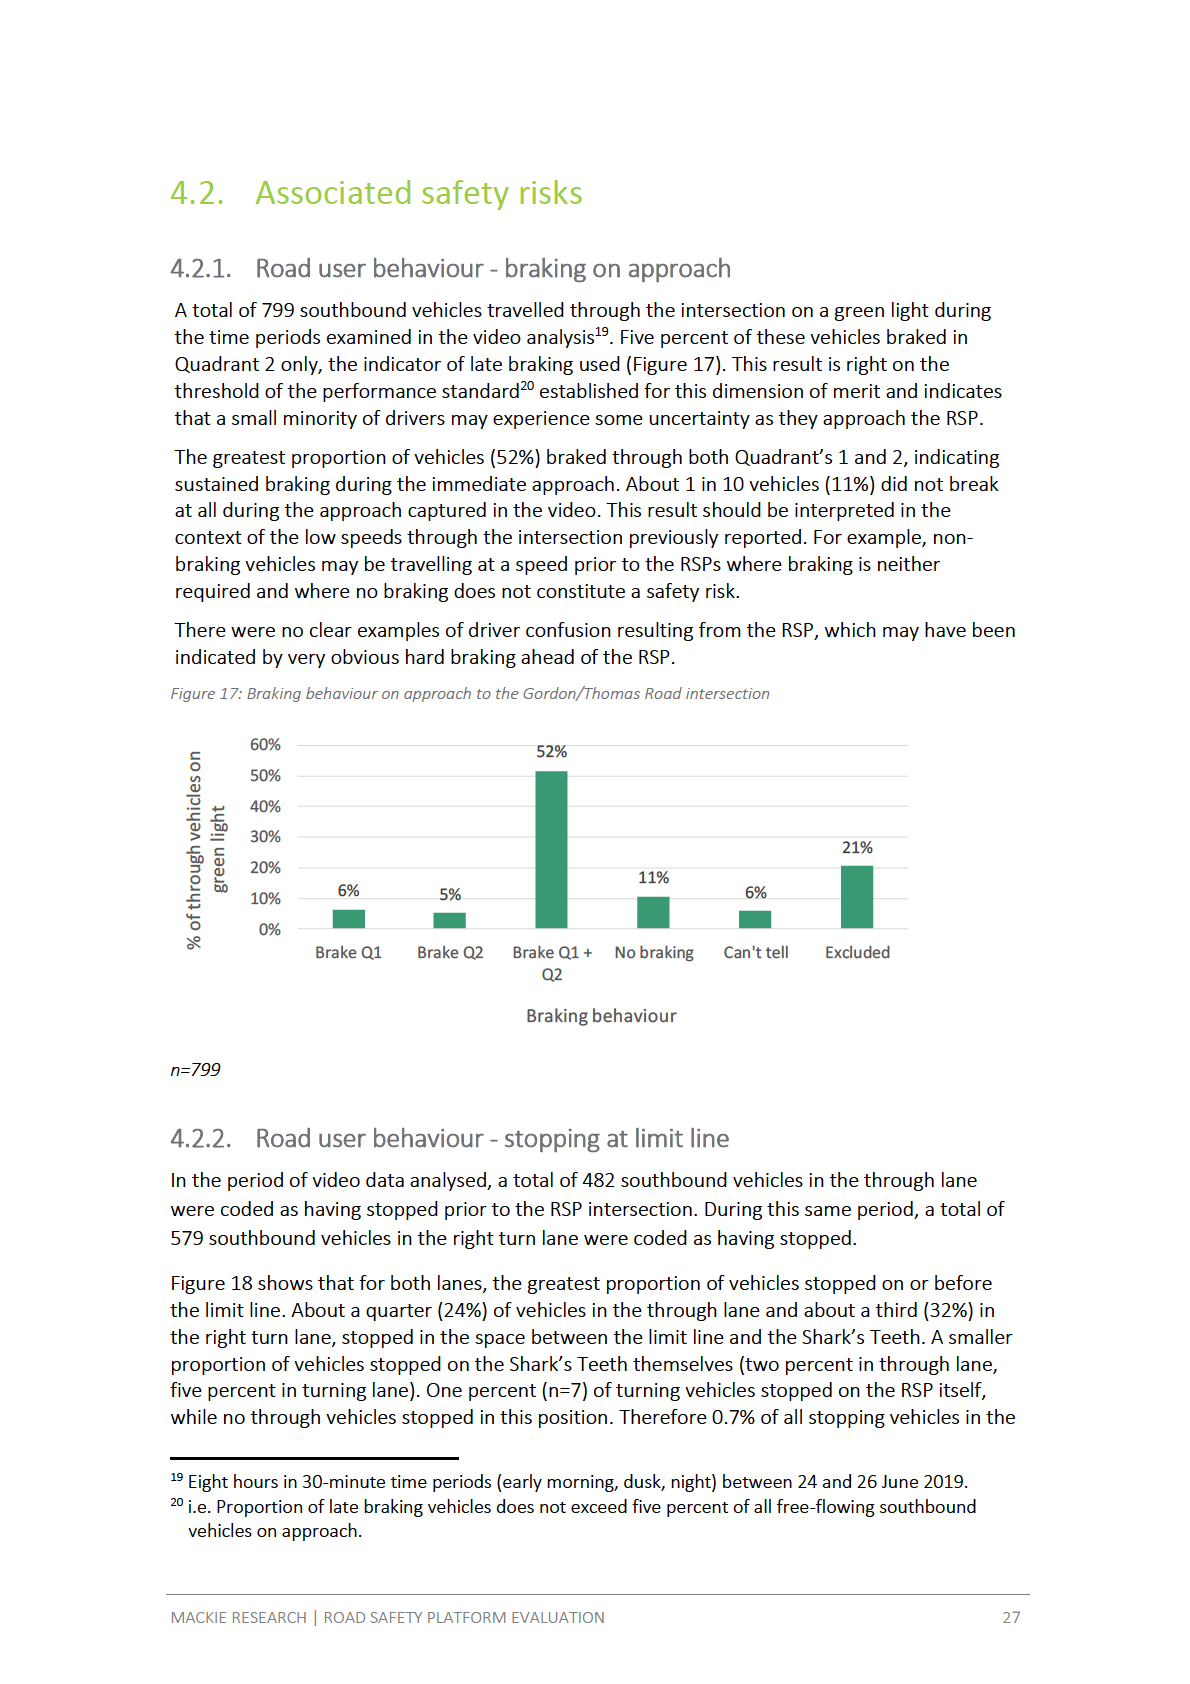
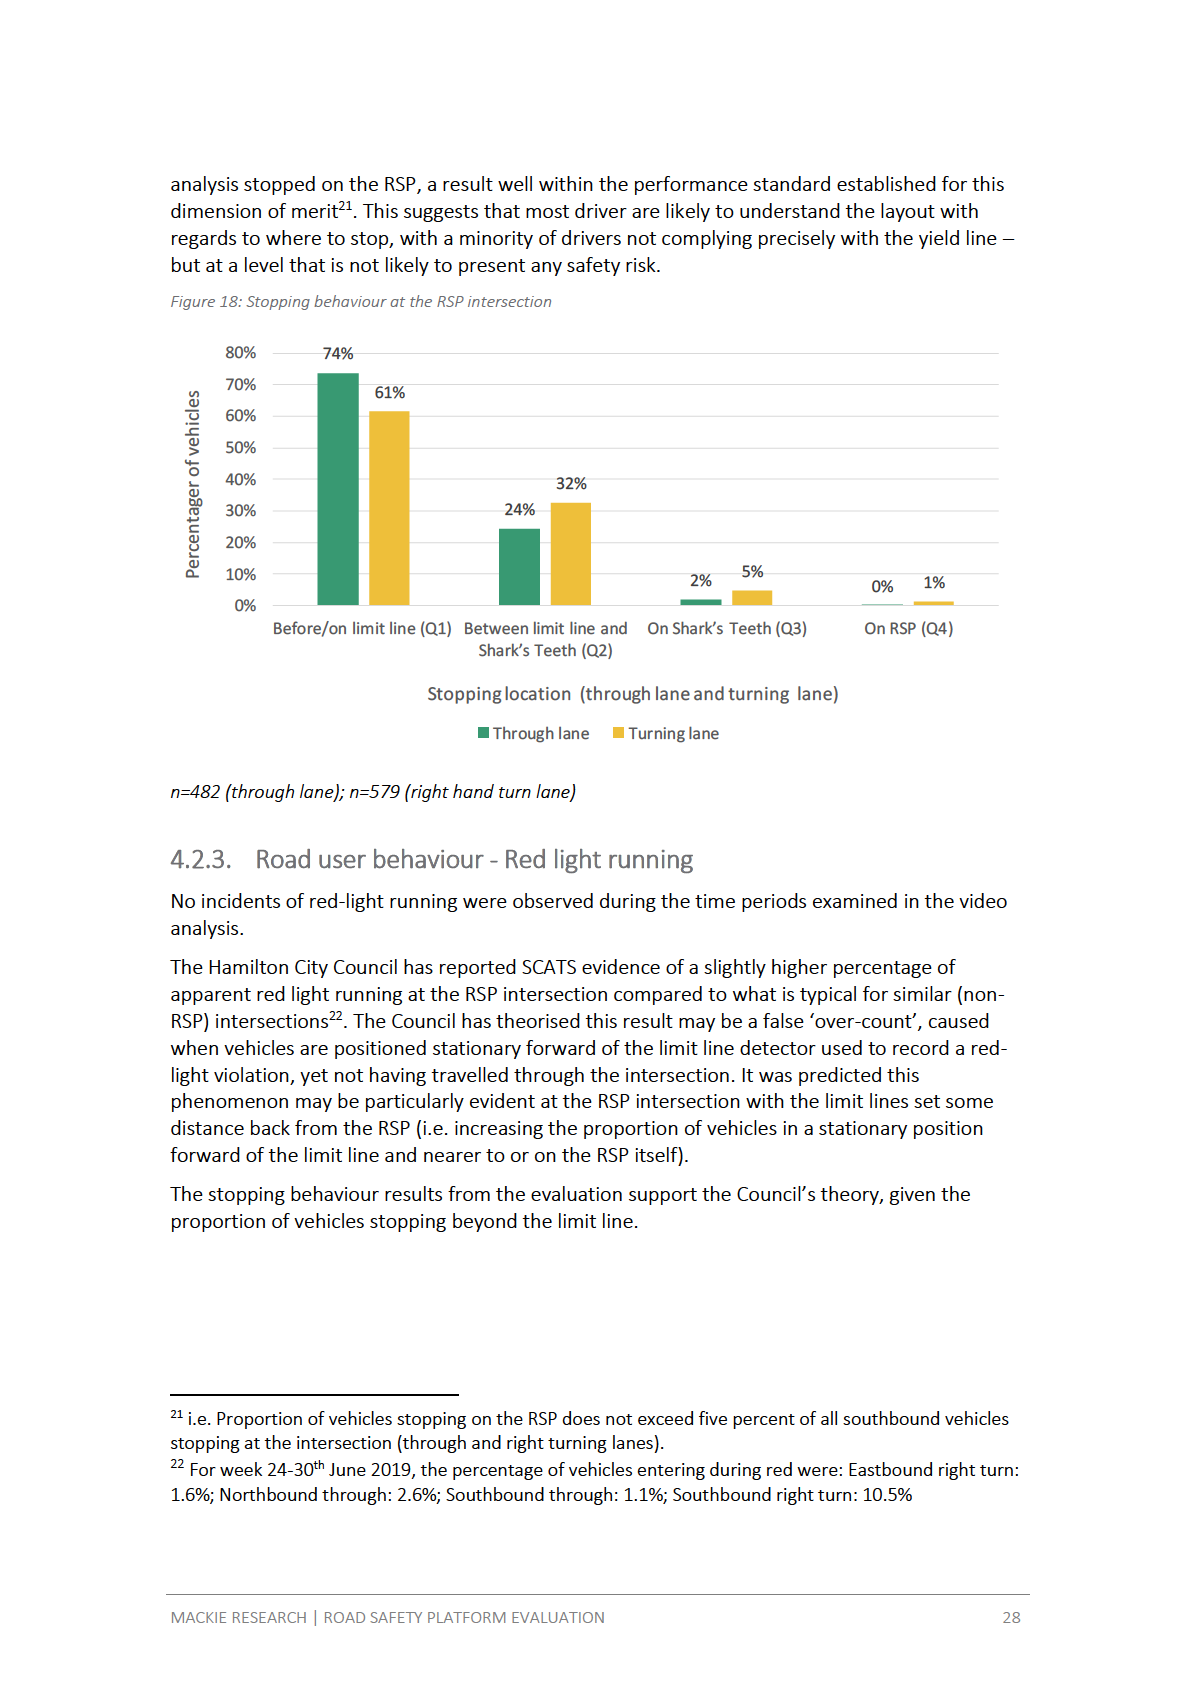
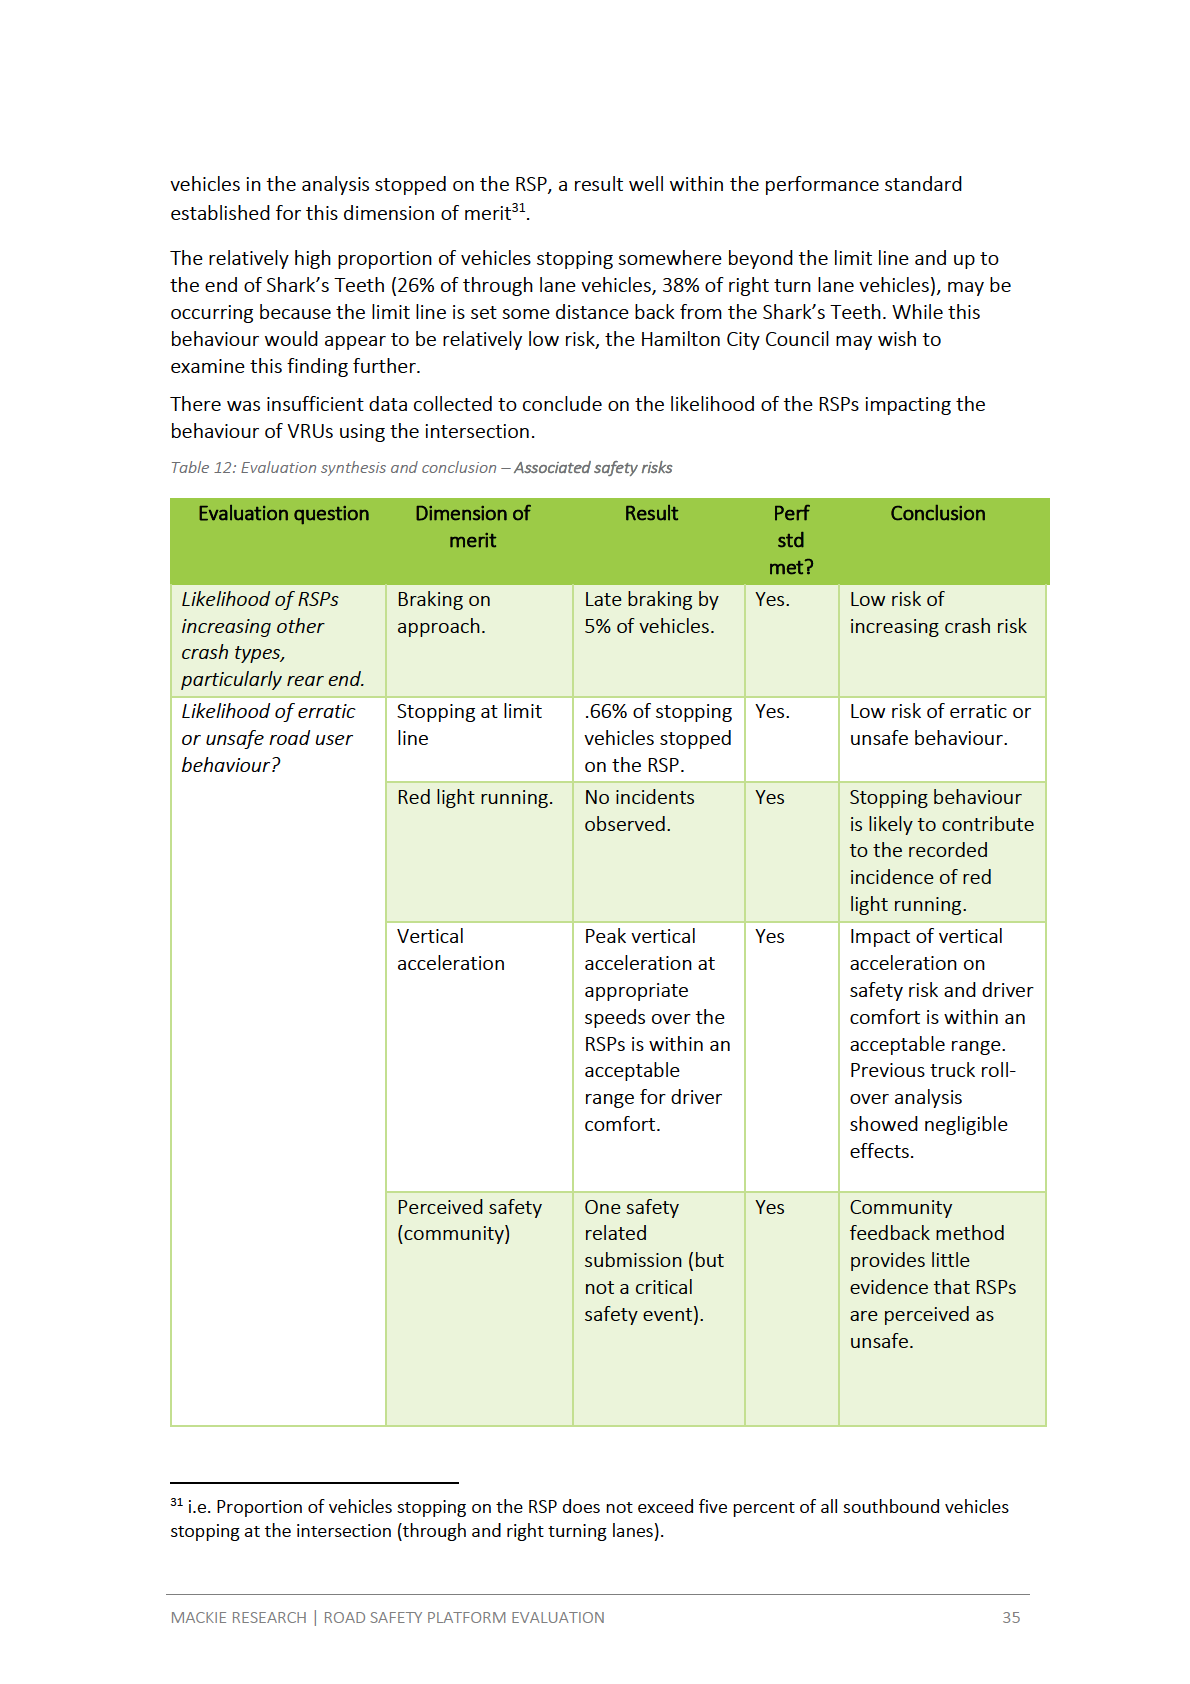
Only five percent of southbound vehicles travelling through the intersection on a green light
demonstrated late braking, a risk factor for rear end crashes. Only 0.7% of southbound vehicles
Information
(through and right turn lane) stopping at the intersection stopped on the RSP itself. No incidents
of red-light running were observed. A relatively high proportion of vehicles stopped beyond the
limit line which is likely to be captured by the intersection analysis system as red light running; a
finding which supports the theory that this behaviour is contributing to the higher than
expected incidence of red light running at the intersection (as reported by the Hamilton City
Council).
Peak vertical acceleration travelling over the RSPs at appropriate speeds was well within the
Official
accepted range for safety and driver comfort and previously reported modelling suggests
negligibly roll-over risk for trucks turning into Thomas Rd. Community feedback on perceived
safety of the RSPs derived only one safety related submission, which did not indicate any serious
the
safety concern.
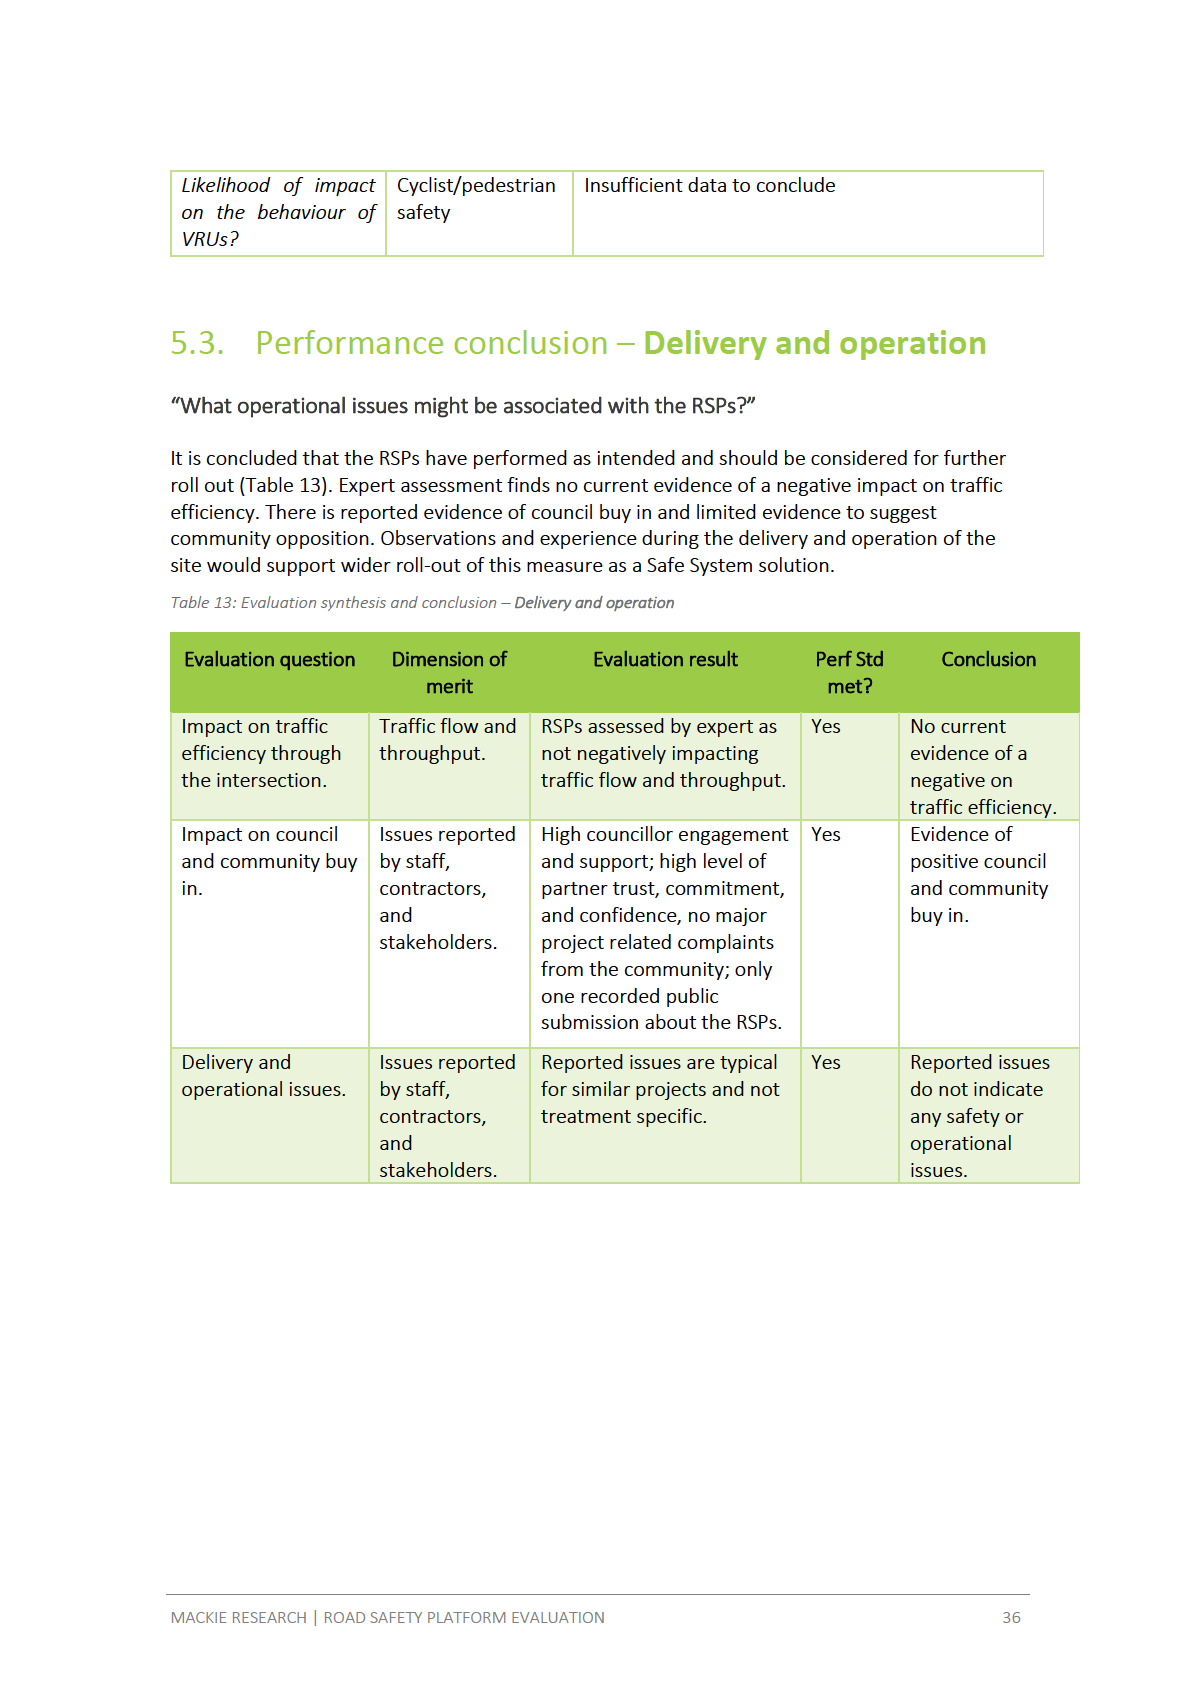
The RSPs met the performance standard on all three dimensions of merit under
delivery and
operations. Expert assessment found no evidence the RSPs were having a negative impact on
traffic efficiency. There was reported evidence of council buy-in and limited evidence to suggest
community opposition.
under
Evaluation conclusion
In synthesis, the RSPs met all performance standards across 10 measured dimensions of merit.
From this result, it is concluded that RSPs are an effective Safe System solution for reducing DSI
crashes at signalised intersections. The RSPs are associated with intersection speeds well under
the Safe System target, there is low likelihood of associated safety risks, and the delivery and
operation of the RSPs has progressed smoothly. Note, however, that reduced DSI crashes is the
ultimate long-term measure of success and will be measured at an agreed time in the future.
Released
Further strategies for improving the visibility of the RSP and raised platform are suggested as
some have indicated that the raised nature of the RSP can be difficult to determine on
approach. An appropriate response may be a colour treatment (e.g. Red) on the platform itself.
MACKIE RESEARCH | RAISED SAFETY PLATFORM EVALUATION - DRAFT REPORT
iii
The RSP evaluation framework developed through this evaluation will be strengthened by
ensuring appropriate baseline data collection at future trial installations, so that resulting
changes on key performance measures can be more confidently attributed to the installation of
RSPs alone.
1982
Act
Information
Official
the
under
Released
MACKIE RESEARCH | RAISED SAFETY PLATFORM EVALUATION - DRAFT REPORT
iv
CONTENTS
EXECUTIVE SUMMARY..................................................................................................................... ii
1.
INTRODUCTION ...................................................................................................................... 6
1.1. Hamilton raised safety platform trial ....................................................................................................... 6
1982
1.2. Evaluation of the raised safety platform ................................................................................................ 10
1.3. Overview of the evaluation report ......................................................................................................... 10
1.4. Acknowledgements ................................................................................................................................. 10
Act
2.
EVALUATION FRAMEWORK .................................................................................................. 11
2.1. Evaluation purpose and criteria .............................................................................................................. 11
2.2. Evaluation questions ............................................................................................................................... 11
2.3. Dimensions of merit ................................................................................................................................ 11
3.
EVALUATION METHODS ....................................................................................................... 16
3.1. Safety improvements .............................................................................................................................. 16
3.2. Associated safety risks............................................................................................................................. 17
3.3. Delivery and operation ............................................................................................................................ 20
4.
EVALUATION RESULTS.......................................................................................................... 21
Information
4.1. Safety improvements .............................................................................................................................. 21
4.2. Associated safety risks............................................................................................................................. 27
4.3. Delivery and operation ............................................................................................................................ 31
5.
EVALUATION SYNTHESIS ...................................................................................................... 34
5.1. Performance conclusion – Safety improvement .................................................................................... 34
5.2. Performance conclusion – Associated safety risks ................................................................................. 34
Official
5.3. Performance conclusion – Delivery and operation ................................................................................ 36
6.
EVALUATION CONCLUSION .................................................................................................. 37
the
6.1. RSP effectiveness ..................................................................................................................................... 37
6.2. Further developments............................................................................................................................. 37
7.
APPENDICES ......................................................................................................................... 38
Appendix A: Layout for data collection (Background plan courtesy of WSP-OPUS) ..................................... 38
Appendix B: Video analysis framework and protocol ..................................................................................... 39
under
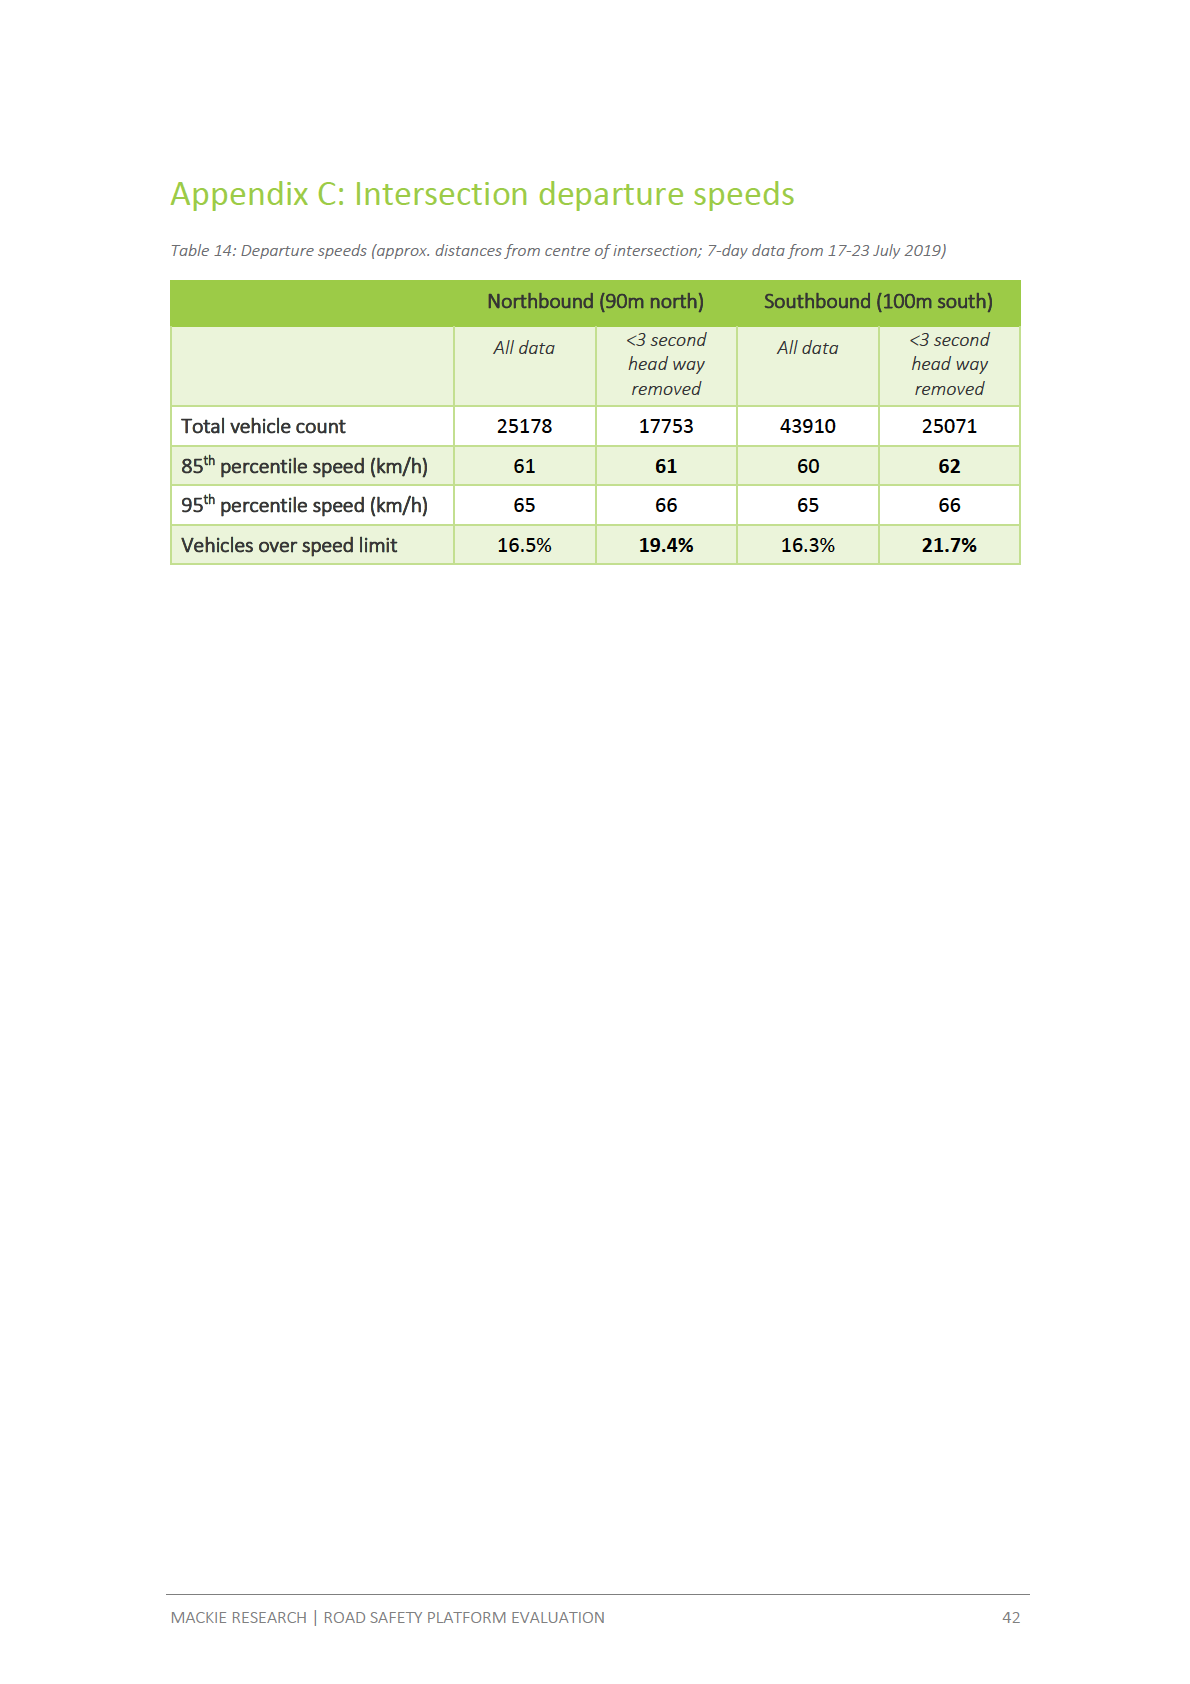
Appendix C: Intersection departure speeds .................................................................................................... 42
Released
MACKIE RESEARCH | RAISED SAFETY PLATFORM EVALUATION - DRAFT REPORT
v
1. INTRODUCTION
1.1. Hamilton raised safety platform trial
1982
Raised Safety platforms at intersections are an emerging road safety countermeasure and have
previously been trialled in the Netherlands and Australia2. Managing collision speed and energy to
survivable levels is a key component of a Safe System approach, and rural and urban intersections are
locations where deaths and serious injuries are common3.
Act
While the feasibility of RSPs has been established overseas, here in New Zealand, they are new. There
is a need to monitor the performance of their use to establish whether they are performing as
expected, and through objective evidence, understand if there are any issues ahead of further rollout.
Previously, the Thomas/Gordonton Rds intersection in Hamilton North was unsignalised and vehicles
were typically passing through with 85% speeds of around 80 km/h. Various interim safety treatments
have been introduced, and in more recent times signals have been introduced at the intersection,
reflecting the development and growing road use in the area.
Raised safety platforms (RSPs) were introduced as part of the intersection signalisation. By installing
raised tables on the north and south bound entry to the intersection on Gordonton Rd, the treatment
Information
seeks to reduce the incidence and severity of collisions at the intersection, particularly side-impact
crashes. In line with Safe System theory, the goal is that vehicle speeds through the intersection do
not exceed 50km/h, the upper speed limit at which side-impact forces are within human tolerances
and are therefore survivable4.
The Hamilton RSPs were fully operational from 1 May 2019 after a staged roll-out which involved
temporary speed restrictions and VMS boards.
Official
The northbound and southbound approaches to the intersection on Gordonton Rd have speed
thresholds (60 km/h) and Speed Indicator Devices (SIDs). Approximately 250m north of the
intersection, the speed limit reduces from 80 km/h to 60km/h as southbound traffic transitions from a
the
rural to peri-urban environment. Features that reinforce this change of environment include kerb and
channelling, housing, driveways, and street lighting.
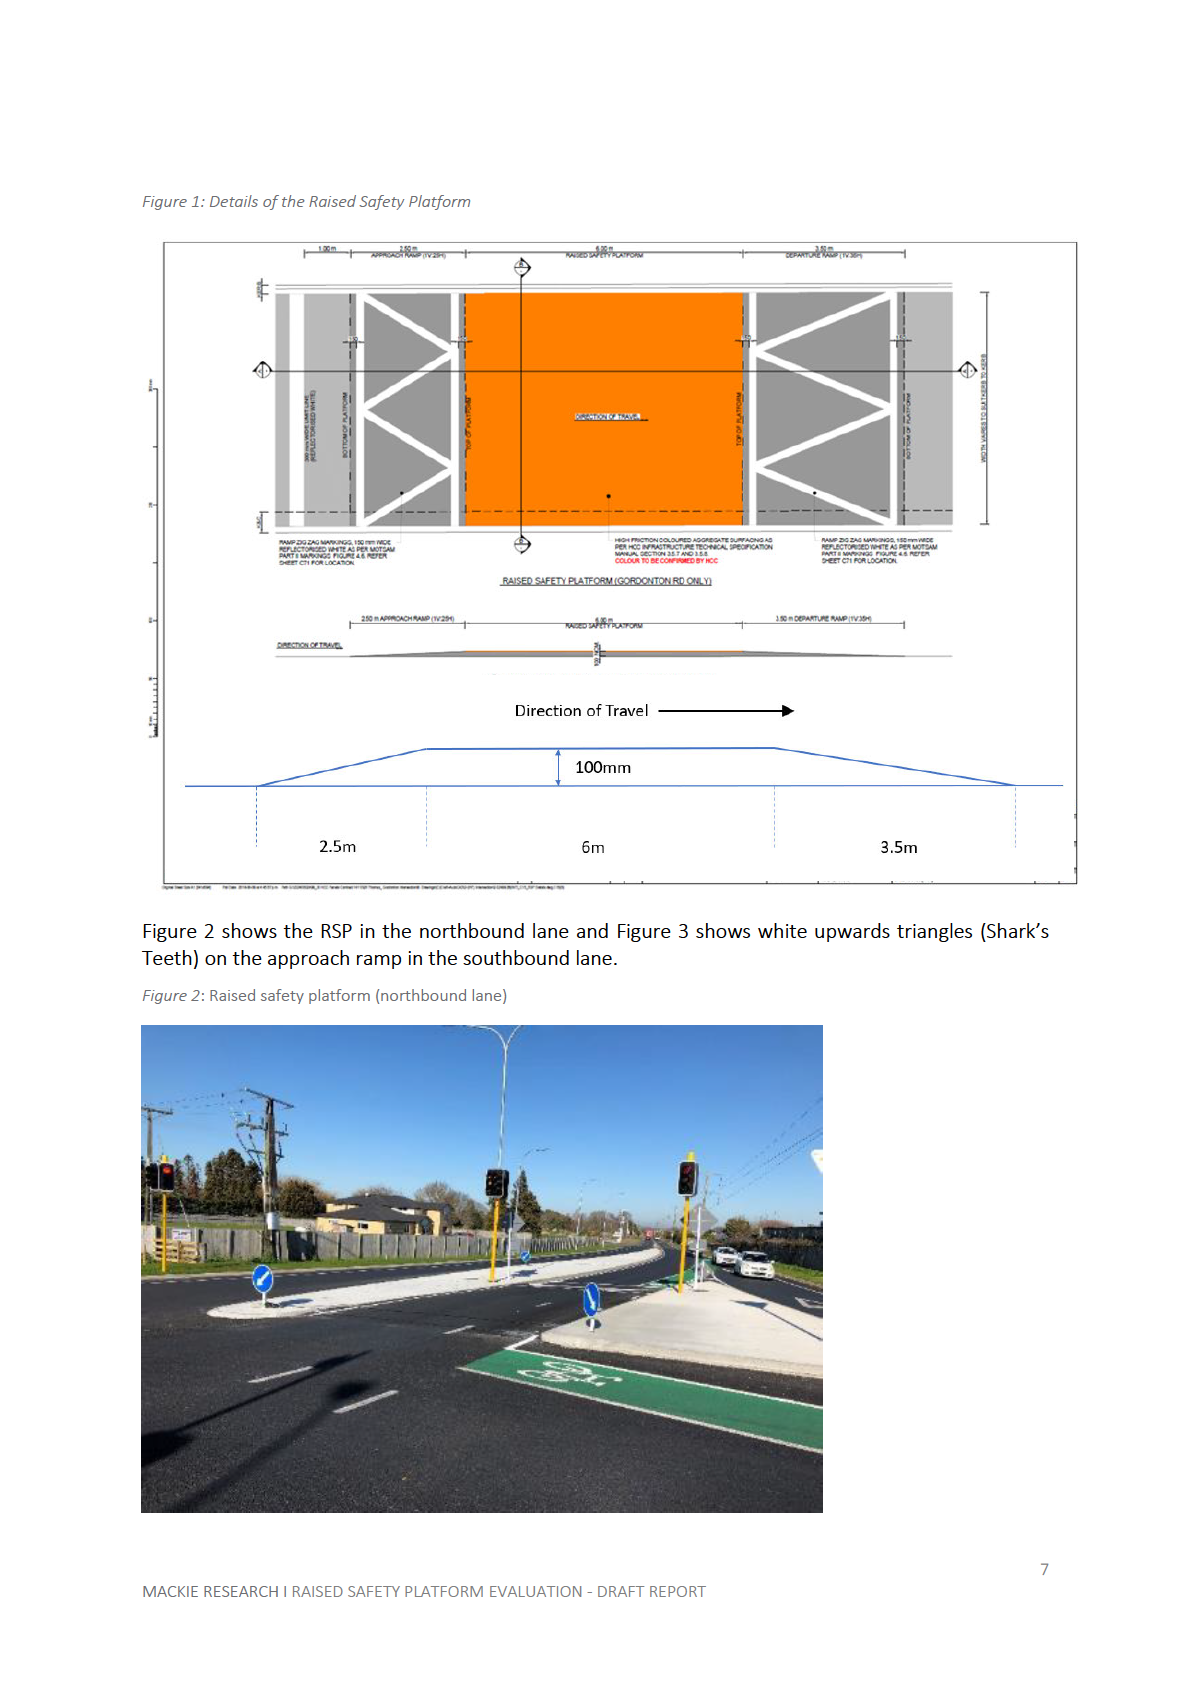
Features of the RSPs are shown in Figure 1 and include:
• 2.5m approach ramp and 3.5m departure ramp.
under
• Profile - 1 in 25 up, 1 in 35 down.
• Platform 100mm high by 6m long constructed between island kerb, kerb and channel.
• White painted upward triangles on the approach only.
• Non-coloured platform - asphalt only, with no markings on the departure ramp.
2 Candappa, N., & Colobong, R. (2015). Effect of Safety Platforms on Speed and Driver Behaviour at a Trial Site in
Belmont, Victoria. Intersection Study Task 9 Report. Monash University Accident Research Centre; Fortuijn,
Released
LGH, Carton, PJ & Feddes, BJ 2005, ‘Safety impact of raised stop bars on distributor roads: draft’, CROW, Ede,
The Netherlands.
3 New Zealand Transport Agency (2013). High risk intersections guide. New Zealand Transport Agency,
Wellington.
4 New Zealand Transport Agency (2013). High risk intersections guide. New Zealand Transport Agency,
Wellington.
6
MACKIE RESEARCH I RAISED SAFETY PLATFORM EVALUATION - DRAFT REPORT
1982
Act
Information
Official
the
under
Released
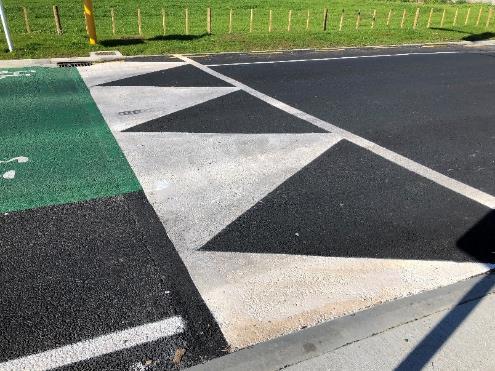
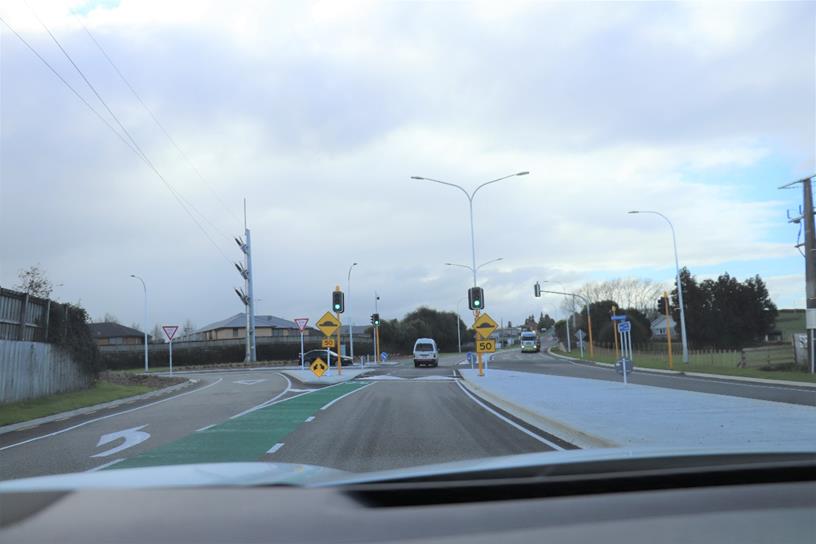 Figure 3: Sharks’ Teeth on approach ramp (southbound lane)
1982
Act
Information
The northbound (Figure 4) and southbound (Figure 5) approaches to the intersection on Gordonton Rd
are shown below. Gated hump advanced warning signs (W14-4) are included with 50 km/h advisory
supplementary signs.
Figure 4: Gordonton Rd approaches (northbound)
Official
the
under
Released
8
MACKIE RESEARCH I RAISED SAFETY PLATFORM EVALUATION - DRAFT REPORT
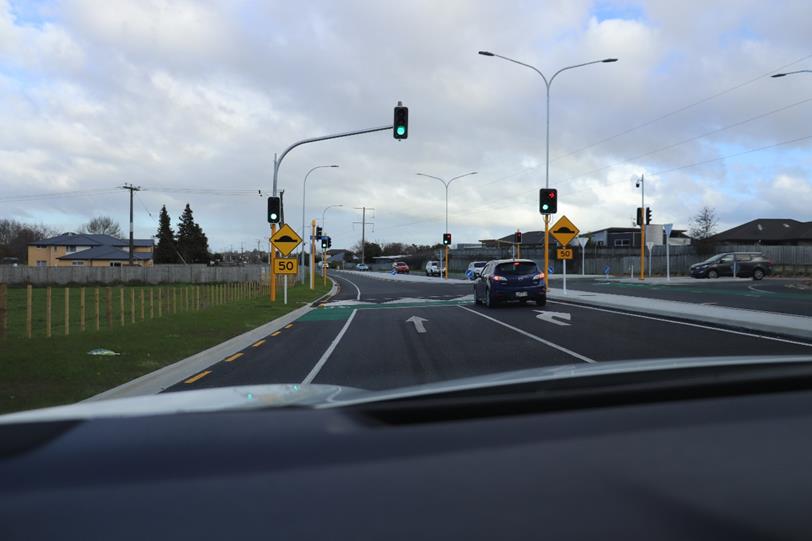
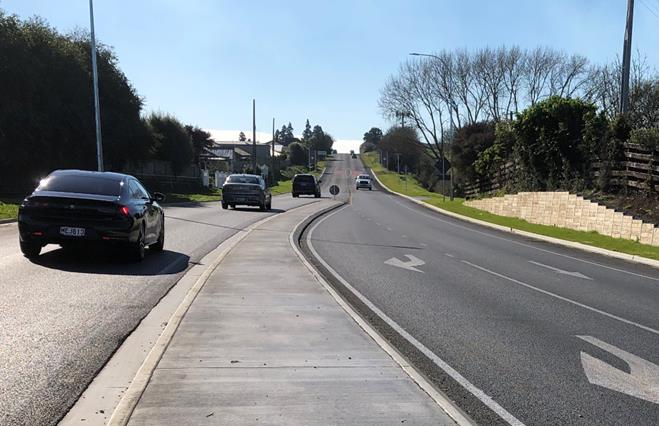 Figure 5
: Gordonton Rd approach (southbound)
1982
Act
Figure 6 shows the northbound view exiting the intersection and the speed threshold transitioning
from the 60km/h to 80km/h speed limit.
Information
Figure 6: Northbound view exiting the RSP intersection
Official
the
under
Released
9
MACKIE RESEARCH I RAISED SAFETY PLATFORM EVALUATION - DRAFT REPORT
1.2. Evaluation of the raised safety platform
This report presents the results of a brief evaluation of the Gordonton/Thomas Roads intersection.
The evaluation assesses the effectiveness of RSPs within New Zealand and was informed by recent
evaluation in Victoria5. The evaluation was also conducted to inform the development of a more
comprehensive evaluation framework and approach, should RSPs be implemented more widely in
New Zealand in the future.
1982
1.3. Overview of the evaluation report
Act
Section 2 of this report details the RSP evaluation framework, while Section 3 describes the evaluation
methods used. The evaluation findings are presented in Section 4 and all findings are synthesised in
Section 4. Final conclusions and future directions are presented in Section 6.
1.4. Acknowledgements
The evaluation was a collaborative project with support and inputs from Mackie Research, WSP-OPUS,
Hamilton City Council, and the New Zealand Transport Agency. Mackie Research would like to thank all
those who contributed to the evaluation and who collectively made the evaluation possible.
Information
Official
the
under
Released
5 Candappa, N., & Colobong, R. (2015). Effect of Safety Platforms on Speed and Driver Behaviour at a Trial Site in
Belmont, Victoria. Intersection Study Task 9 Report. Monash University Accident Research Centre.
10
MACKIE RESEARCH I RAISED SAFETY PLATFORM EVALUATION - DRAFT REPORT
2. EVALUATION FRAMEWORK
2.1. Evaluation purpose and criteria
1982
The primary purpose of the RSPs are to achieve speeds through the intersection that are survivable in
the event of a collision, particularly side-impact crashes. The primary purpose of the RSP evaluation
therefore was to determine whether the RSPs provide an effective Safe System6 solution for reducing
DSI crashes at signalised intersections. As RSPs are new to New Zealand, a secondary purpose was to
Act
learn about implementation issues and wider performance characteristics.
Evaluation criteria specify the aspects of a project that will be considered when deciding whether or
not, and in what ways, the project has been successful. The primary evaluation criteria used in the
evaluation was
safety improvement. Secondary criteria were
associated safety risks, and
delivery and
operation.
2.2. Evaluation questions
The key (KEQ) and secondary evaluation questions (SEQ) aligned with the evaluation purpose and
Information
criteria.
The evaluation questions were as follow.
KEQ 1: What is the effectiveness of the RSPs, in terms of providing a Safe System intersection solution?
• SEQ 1.1: Are intersection speeds reduced to desired levels?
Official
KEQ 2: What observed safety risks are associated with implementation of the RSPs?
• SEQ 2.1: Are the RSPs likely to lead to an increase in crashes? (e.g. rear-end and other crashes)
• SEQ 2.2: Are the RSPs likely to lead to any erratic or unsafe road user behaviour?
the
• SEQ 2.3: Are the RSPs likely to impact the behaviour of VRUs, particularly pedestrians?
KEQ 3: What operational issues might be associated with the RSPs?
• SEQ 3.1: What are the impacts of the RSPs on traffic efficiency through the intersection?
under
• SEQ 3.2: What are the impacts of the RSPs on council/community buy-in?
• SEQ 3.3: Are there any implementation or site-specific issues associated with installation of the
RSPs?
2.3. Dimensions of merit
More specific ‘dimensions of merit’ were defined under the each of the evaluation criteria, and where
possible, performance standards were established for each dimension. Each performance standard
Released
defined the level of performance the RSPs would need to achieve on its relevant dimension of merit if
6 https://www.saferjourneys.govt.nz/about-safer-journeys/the-safe-system-approach/
11
MACKIE RESEARCH I RAISED SAFETY PLATFORM EVALUATION - DRAFT REPORT
the RSPs were to be judged as effective in achieving intended safety improvements, having low
likelihood of associated safety risks, and having effective delivery and operation.
Defining dimensions of merit and performance standards allowed appropriate evaluation methods
and data sources to be identified. The definitions also enabled transparent and defensible evaluative
conclusions about the performance of the RSPs to be drawn from the evaluation findings.
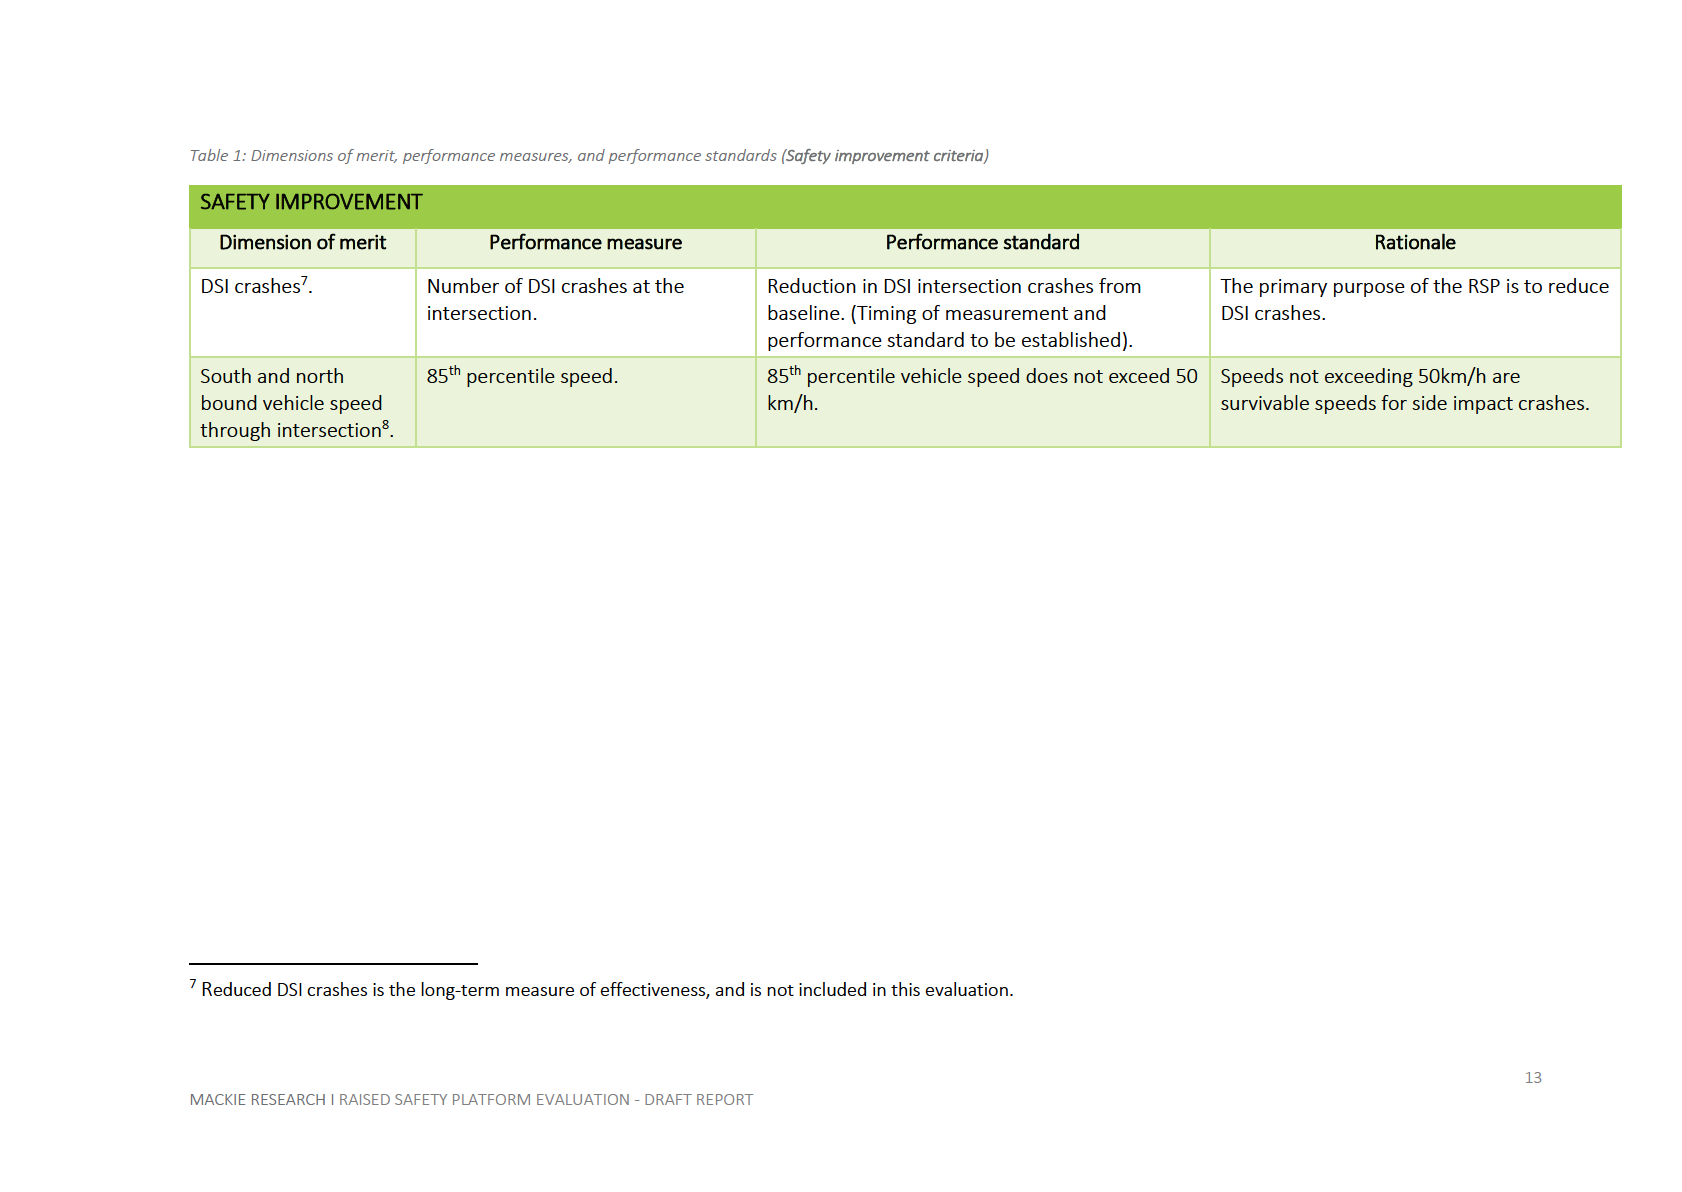
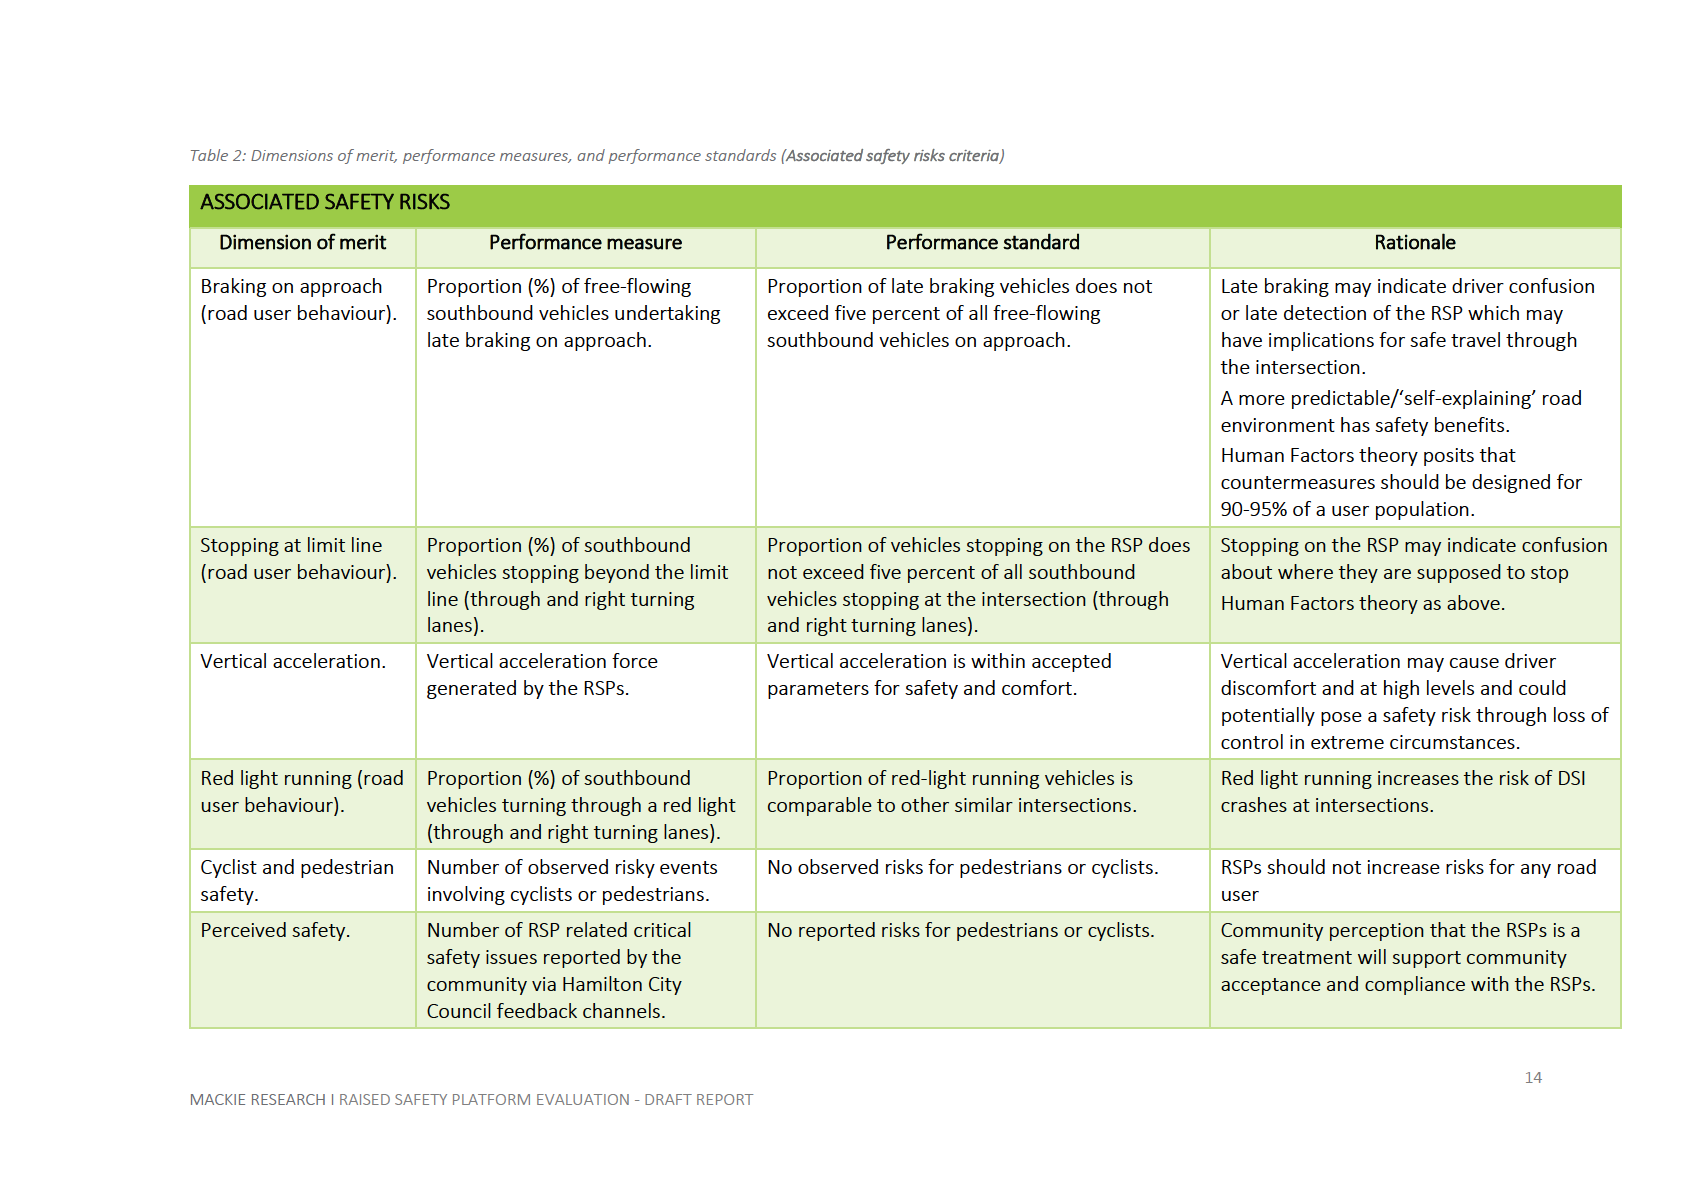
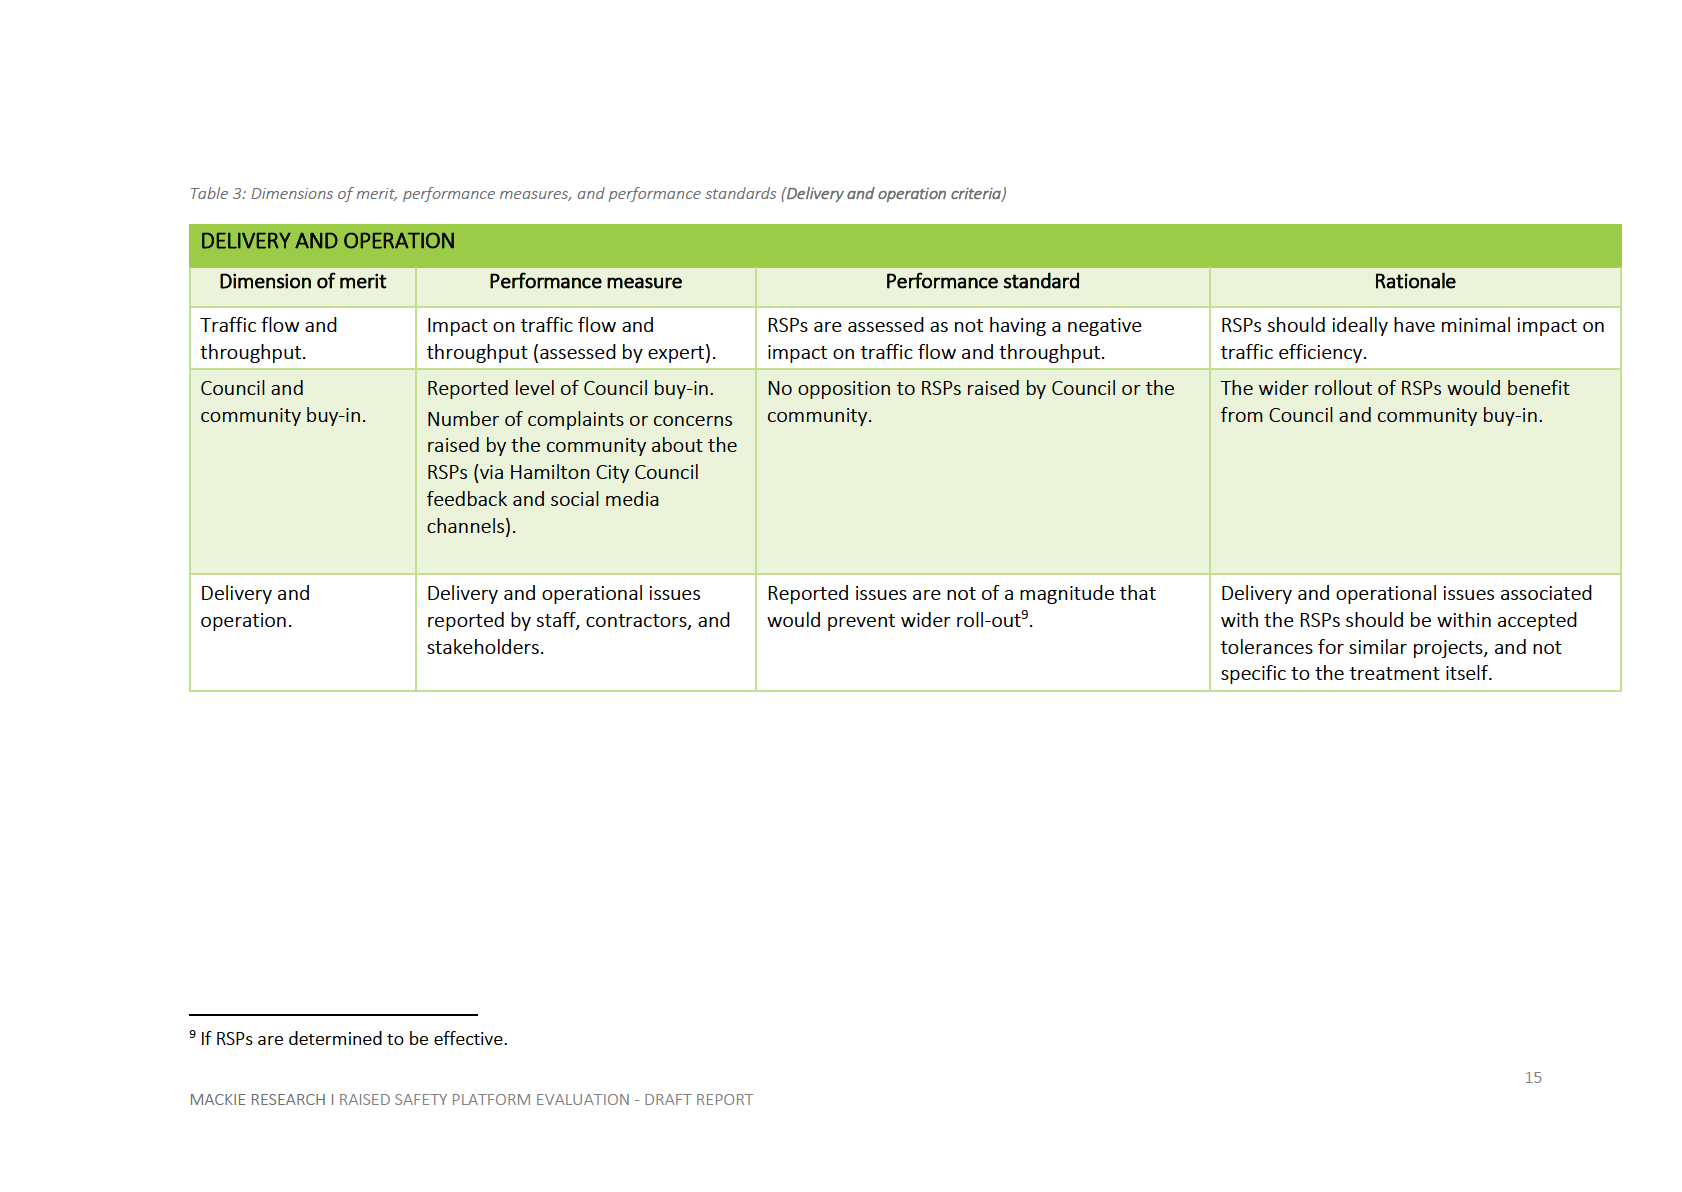
Table 1, Table 2, and Table 3 over page summarise the dimensions of merit, performance measures,
and standards established under each of the evaluation criteria. The final column in each table
1982
provides the rationale for the dimensions, measures, and standards established.
Act
Information
Official
the
under
Released
12
MACKIE RESEARCH I RAISED SAFETY PLATFORM EVALUATION - DRAFT REPORT
1982
Act
Information
Official
the
under
Released
1982
Act
Information
Official
the
under
Released
1982
Act
Information
Official
the
under
Released
3. EVALUATION METHODS
The methods used to collect data under each of the evaluation criteria are detailed below.
3.1. Safety improvements
1982
3.1.1.
Traffic speed
Act
Speed tubes (RSP intersection)
Speed tubes were placed just after the RSP departure ramps (north and southbound) to
measure vehicle speed through the intersection and traffic volumes (see Appendix A for visual
map).
Data over a 7-day period was analysed, beginning Wednesday 17 July and concluding on
Tuesday 23 July 2019 (at midnight)10. The data was exported to Excel and scatter plots were
used to check the data and remove anomalies. Various analyses were then carried out (i.e.
speed distribution graphs, total vehicle counts, 85th and 95th percentile speeds, percentage of
vehicles over the speed limit).
Information
Speed tubes (RSP intersection approach)
Although not directly used as success criteria for the RSPs, surveys were also undertaken to
understand the speed behaviour on approach to and departure from the intersection. Speed
tubes were placed approximately 100 metres north and south of the intersection to measure
Official
southbound and northbound vehicle speed on approach (see Appendix A for visual map).
Speeds as vehicles departed the intersection were also recorded. 7 days of data from 17 to 23
July 2019 were used in the analysis.
the
Speed radar (wider approach speed)
An existing speed radar (as part of a Speed Indicator Device) was located just after the
southbound speed threshold (80km/h to 60km/h transition) to measure the speed of
southbound vehicles at the threshold (see Appendix A for visual map). Another radar was
under
located for northbound vehicles approaching the intersection within the 60 km/h zone.
Speed data collected by the radar were provided through the Opito platform as minimum,
maximum, and 85th percentile speeds for every minute that vehicles were recorded. This data
was exported to Excel to enable the data to be graphed.
For both datasets, data from a 7-day period from 17 to 23 July 2019 is reported. Data from the
full period of data collection from 5 April to 29 July 2019 were graphed, with average 85th
percentile speeds plotted for data between 20 May and 29 July 2019. Data collected before 20
May was excluded as this coincided with temporary speed restrictions on site.
Released
10 The RSPs were fully operational from 1 May 2019.
MACKIE RESEARCH | ROAD SAFETY PLATFORM EVALUATION
16
1982
Act
Information
Official
the
under
Released
1982
Act
Information
Official
the
under
Released
1982
Act
Information
Official
the
under
Released
3.2.3.
Cyclist and pedestrian safety
Information was collated on any critical safety events involving cyclists or pedestrians identified
through the road user behaviour video analysis and coding process previously described.
3.2.4.
Safety perception (community)
1982
The Hamilton City Council’s online and telephone customer service channels were monitored by
Hamilton City Council following the full operation of the RSPs to identify any safety related
complaints or concerns from the public.
Act
3.3. Delivery and operation
3.3.1.
Traffic flow and throughput
Assessment of whether the RSPs were having any impact on intersection traffic flow and
throughput (traffic efficiency) was provided by a Hamilton City Council Transport Systems
Engineer.
Information
3.3.2.
Council and community buy-in
The level of Council and community buy-in to the RSPs was assessed through the monitoring of
the Hamilton City Council online and telephone customer service channels conducted for safety
perception (community) and through review of the 'lessons learned' workshop and end of
project report (see below).
Official
3.3.3.
Development and delivery
the
Development and delivery issues were identified through a 'lessons learned' workshop at the
completion of the project. The workshop, held in Hamilton on 7 June 2019, involved project
staff and stakeholders. The findings have been previously reported14, and key themes are
synthesised in this report.
under
Released
14 Hamilton City Council (2019). Project Closedown Report. Thomas/Gordonton Intersection
Improvement. Trim document number: D-3015913. Hamilton City Council.
MACKIE RESEARCH | ROAD SAFETY PLATFORM EVALUATION
20
1982
Act
Information
Official
the
under
Released
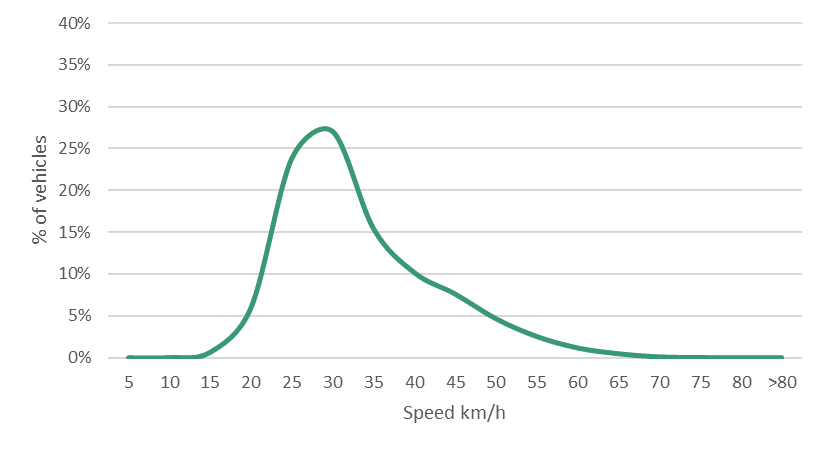
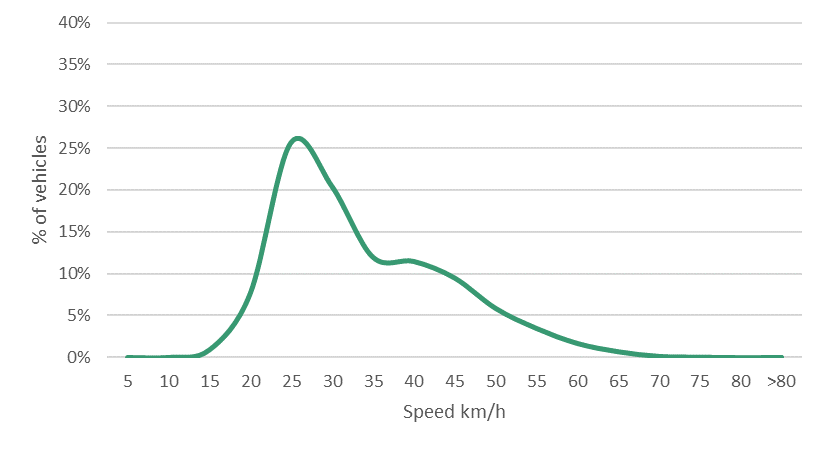
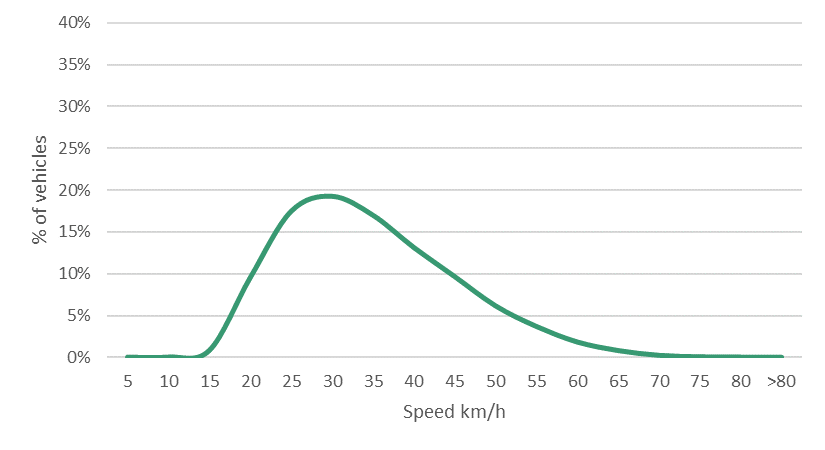 Figure 9: Distribution of RSP intersection speed - northbound (all data)
1982
Act
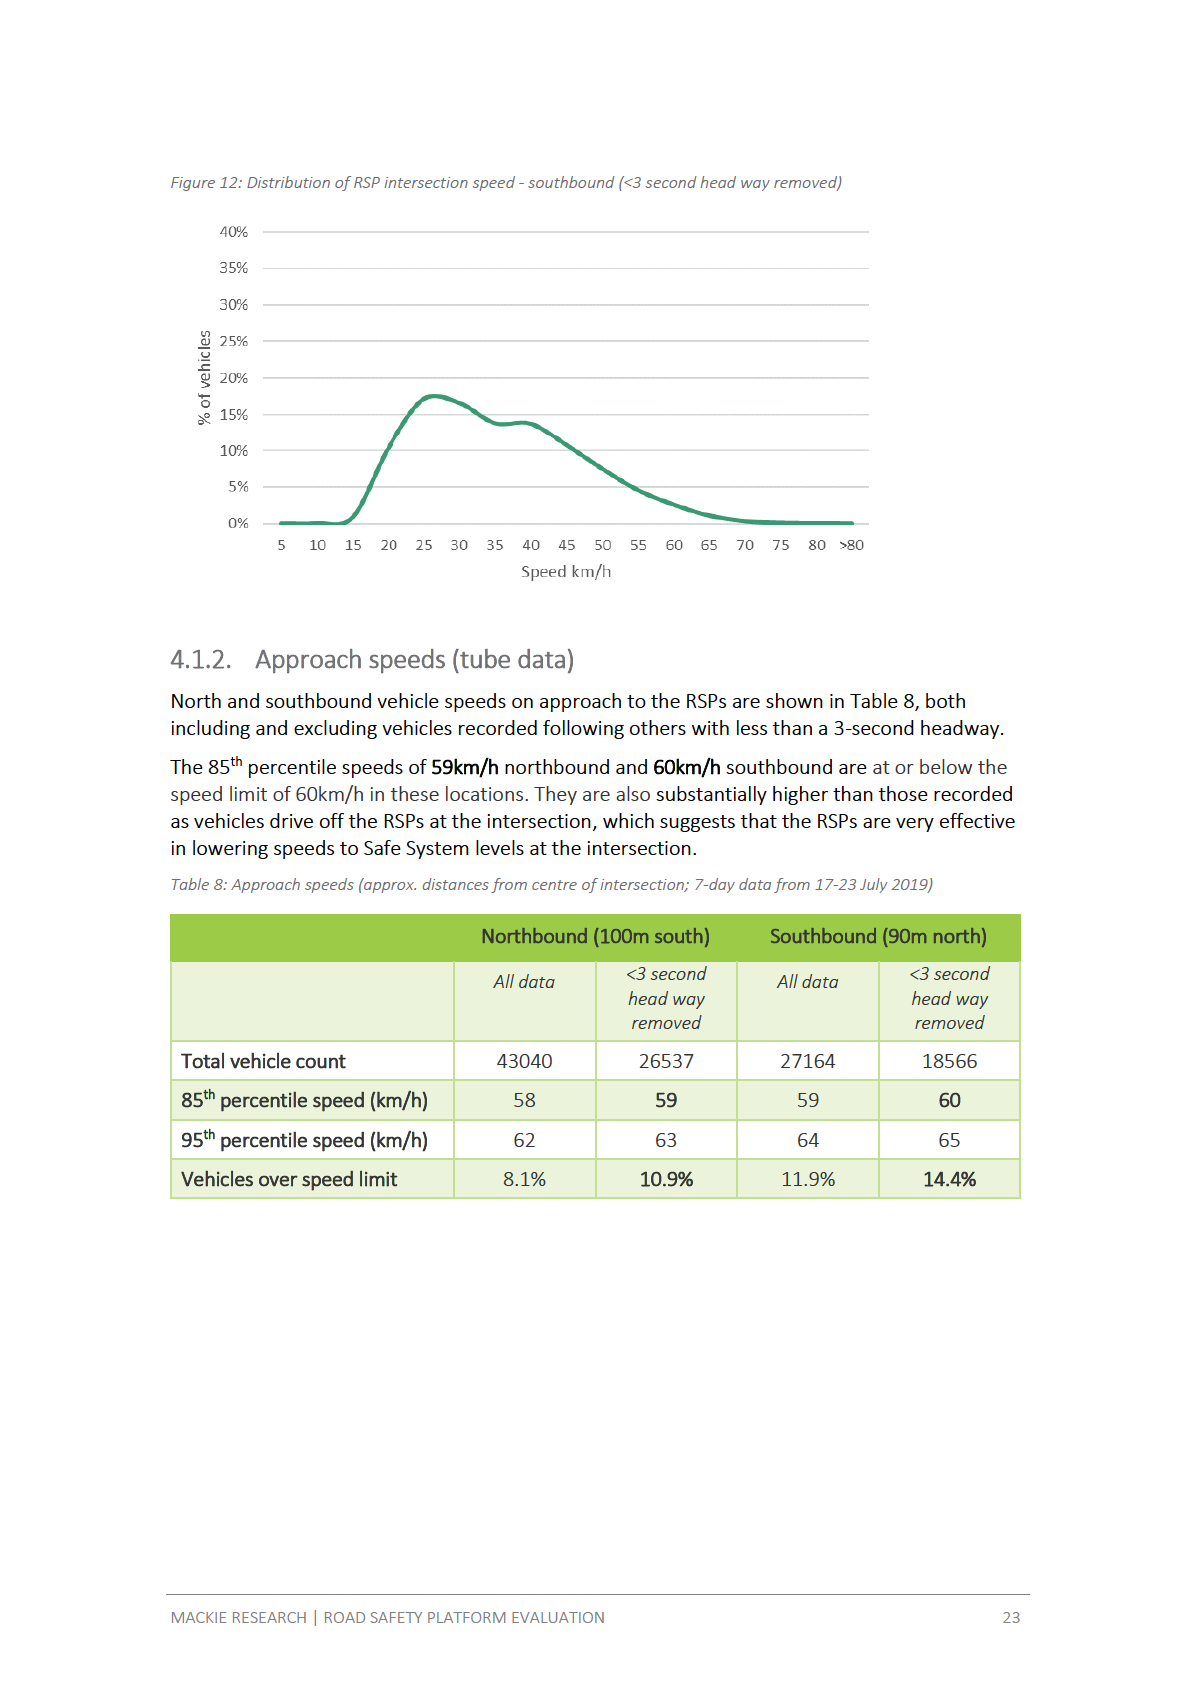
Figure 10: Distribution of RSP intersection speed - northbound (<3 second head way removed)
Information
Official
the
Figure 11: Distribution of RSP intersection speed - southbound (All data)
under
Released
MACKIE RESEARCH | ROAD SAFETY PLATFORM EVALUATION
22
1982
Act
Information
Official
the
under
Released
1982
Act
Information
Official
the
under
Released
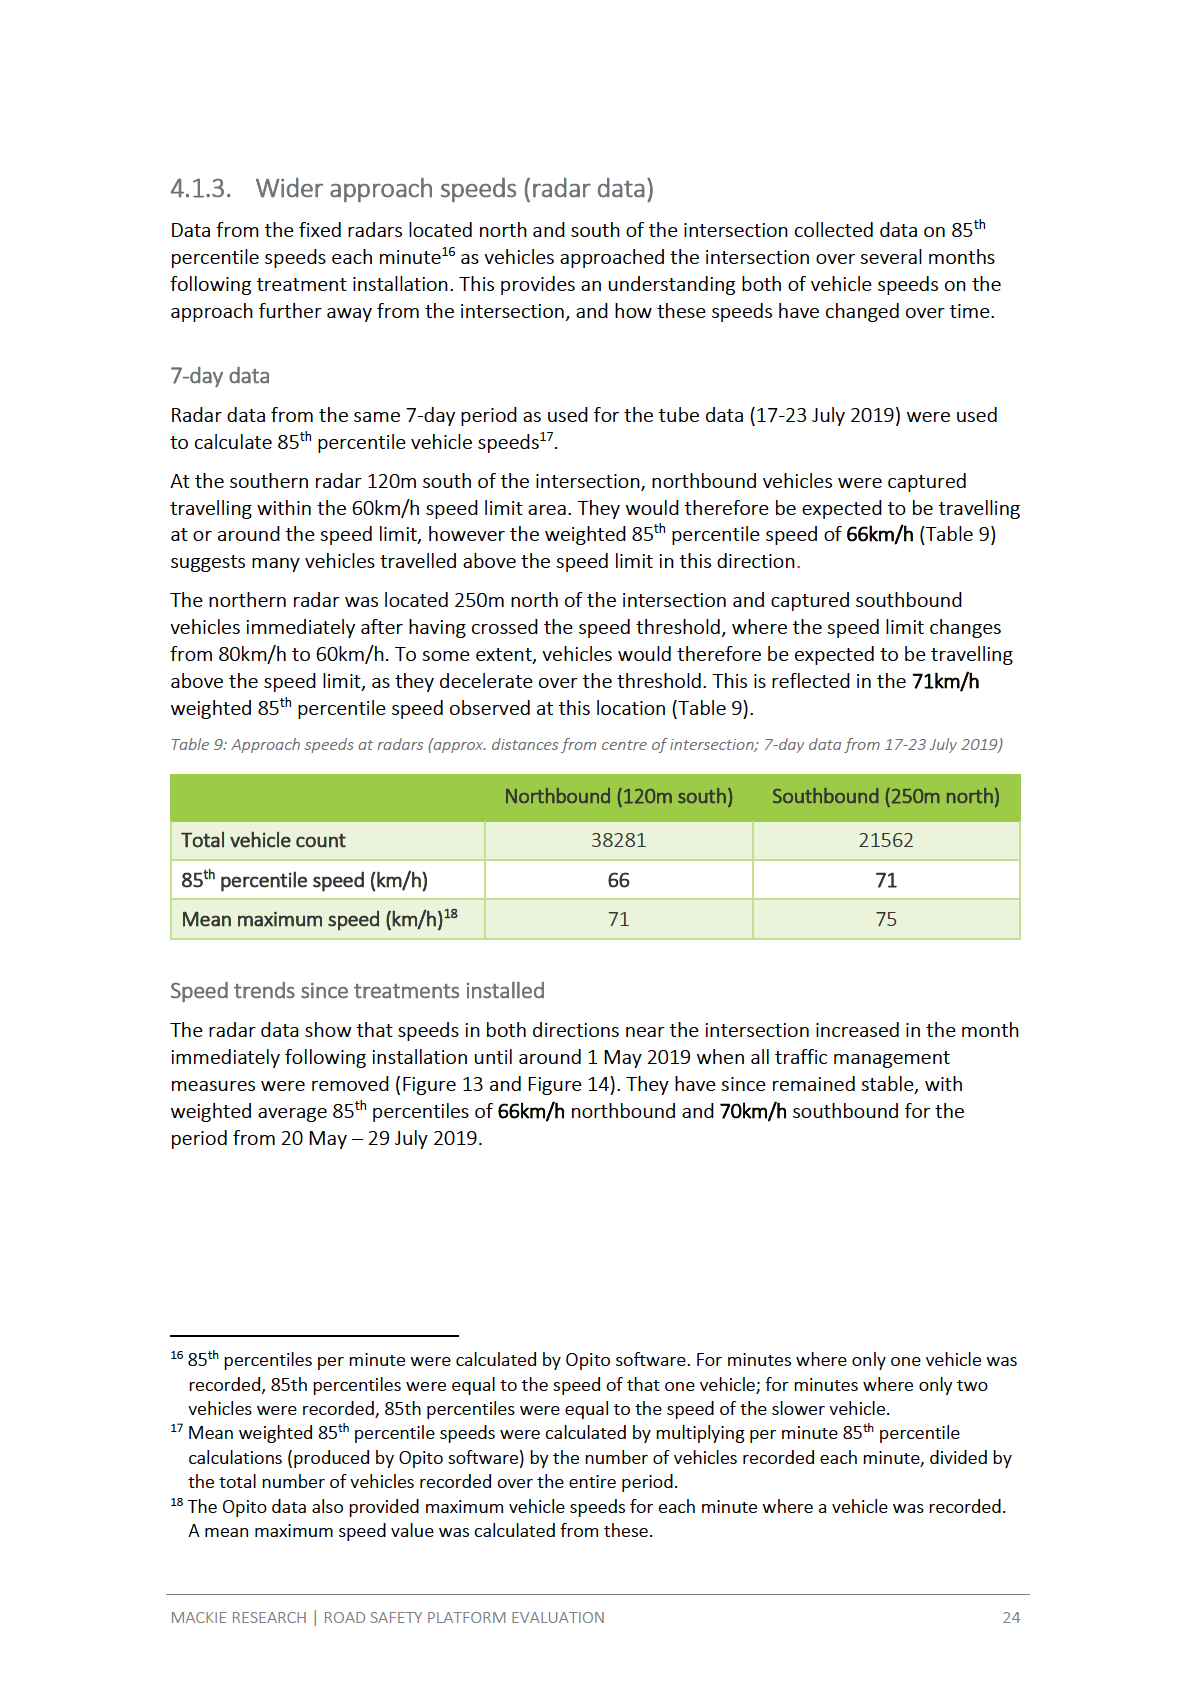
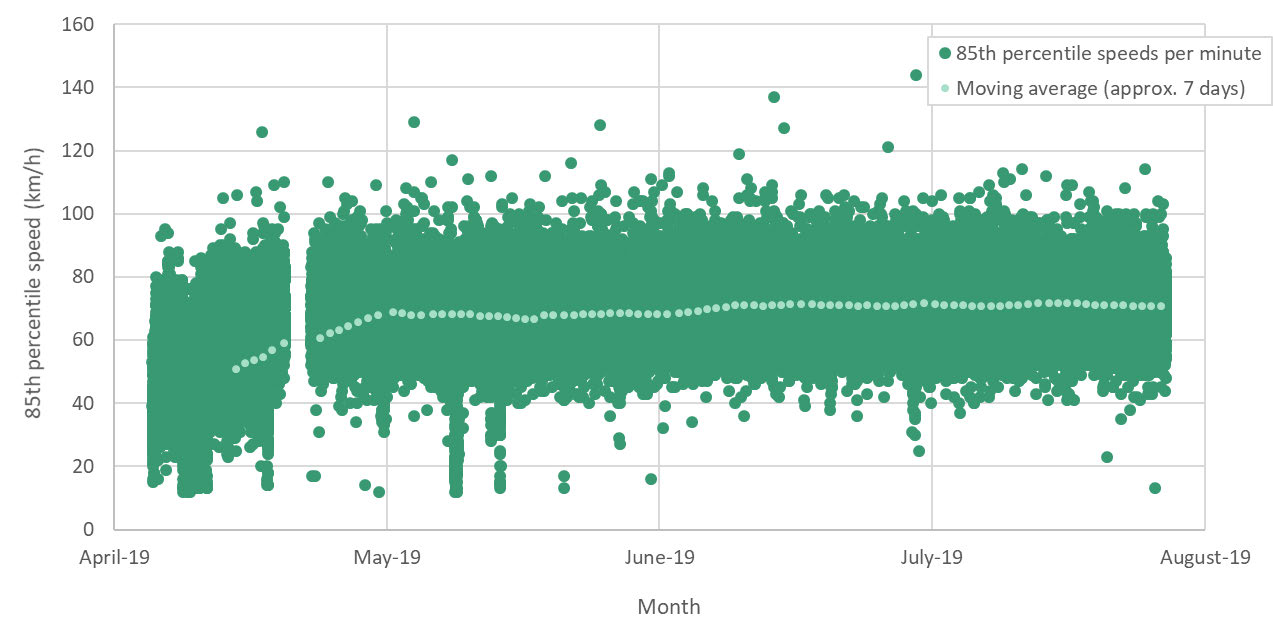 Figure 13: 85th percentile speeds each minute at 65m (within 60km/h speed limit zone; all northbound vehicles)
1982
Act
Figure 14: 85th percentile speeds each minute at northern speed threshold (all southbound vehicles)
Information
Official
the
Note: All vehicle data collected is shown. Each dot represents an 85th percentile calculation of vehicles per
under
minute. The moving average is calculated as the mean of the previous 7000 data points (roughly
equivalent to 7 days of data). Data prior to 1 May 2019 is before the full implementation of the RSPs and
includes periods of temporary speed restrictions at site.
Released
MACKIE RESEARCH | ROAD SAFETY PLATFORM EVALUATION
25
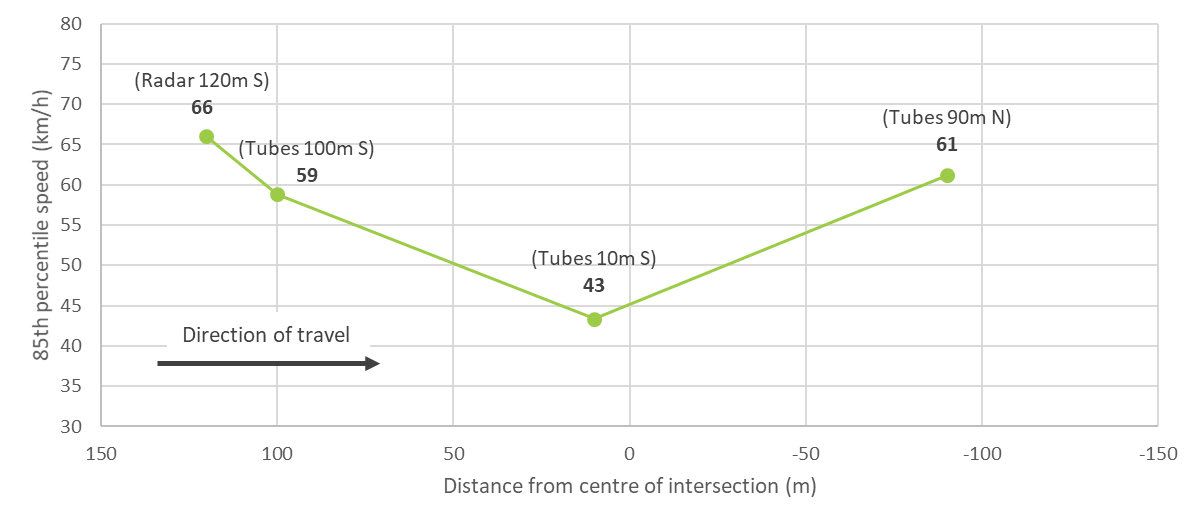
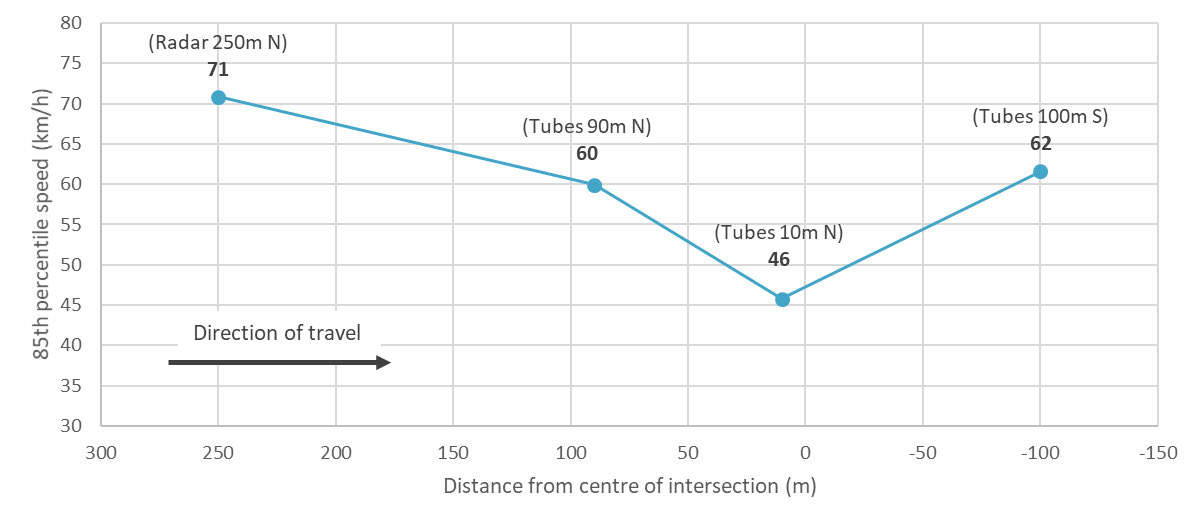
4.1.4.
Speed profile through the intersection
The 85th percentile speed results from the 7-day data at each point of measurement in the
study are shown in Figure 15 and Figure 16. Each figure shows the speed profile of vehicles as
they approach, travel through, and then exit the intersection.
Both figures show the reduction in speed on approach, minimum speed at the end of the RSP,
and steady acceleration upon exiting the intersection.
Figure 15: 85th percentile speeds northbound (mix of radar and tube measurements; 7-day data from 17-23 July)
1982
Act
Information
Figure 16: 85th percentile speeds southbound (mix of radar and tube measurements; 7-day data from 17-23 July)
Official
the
under
Note: Radar speed measurements are weighted 85th percentiles. Tube speed measurements are excluding
vehicles recorded following others with less than a 3 second headway. Intersection departure speeds are
summarised in Appendix C. Positive distances are on the approach to the intersection, negative distances
are as vehicles drive away from the intersection.
The effects of the intersection on traffic speed is clear, and although it can’t be separated out, it is likely
that a substantial component of this speed reduction is likely to be from the RSPs.
Released
MACKIE RESEARCH | ROAD SAFETY PLATFORM EVALUATION
26
1982
Act
Information
Official
the
under
Released
1982
Act
Information
Official
the
under
Released
1982
Act
Information
Official
the
under
Released
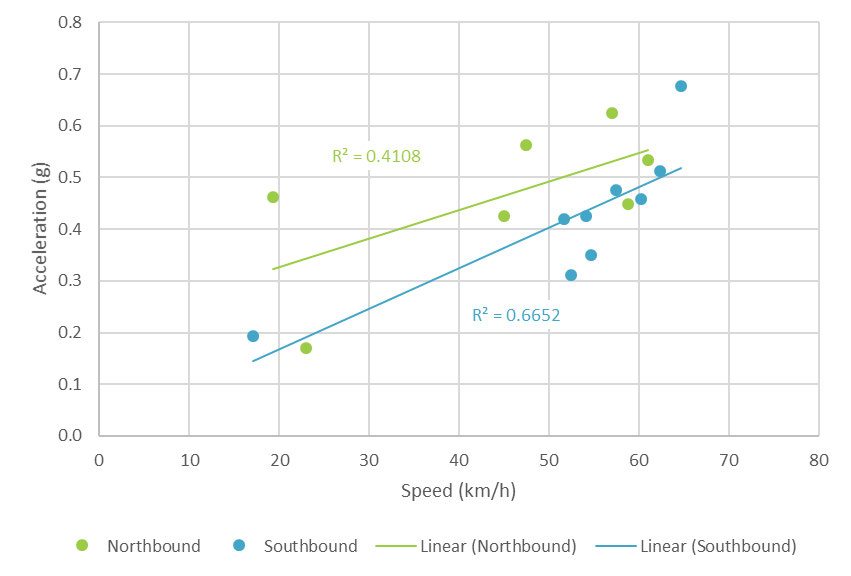
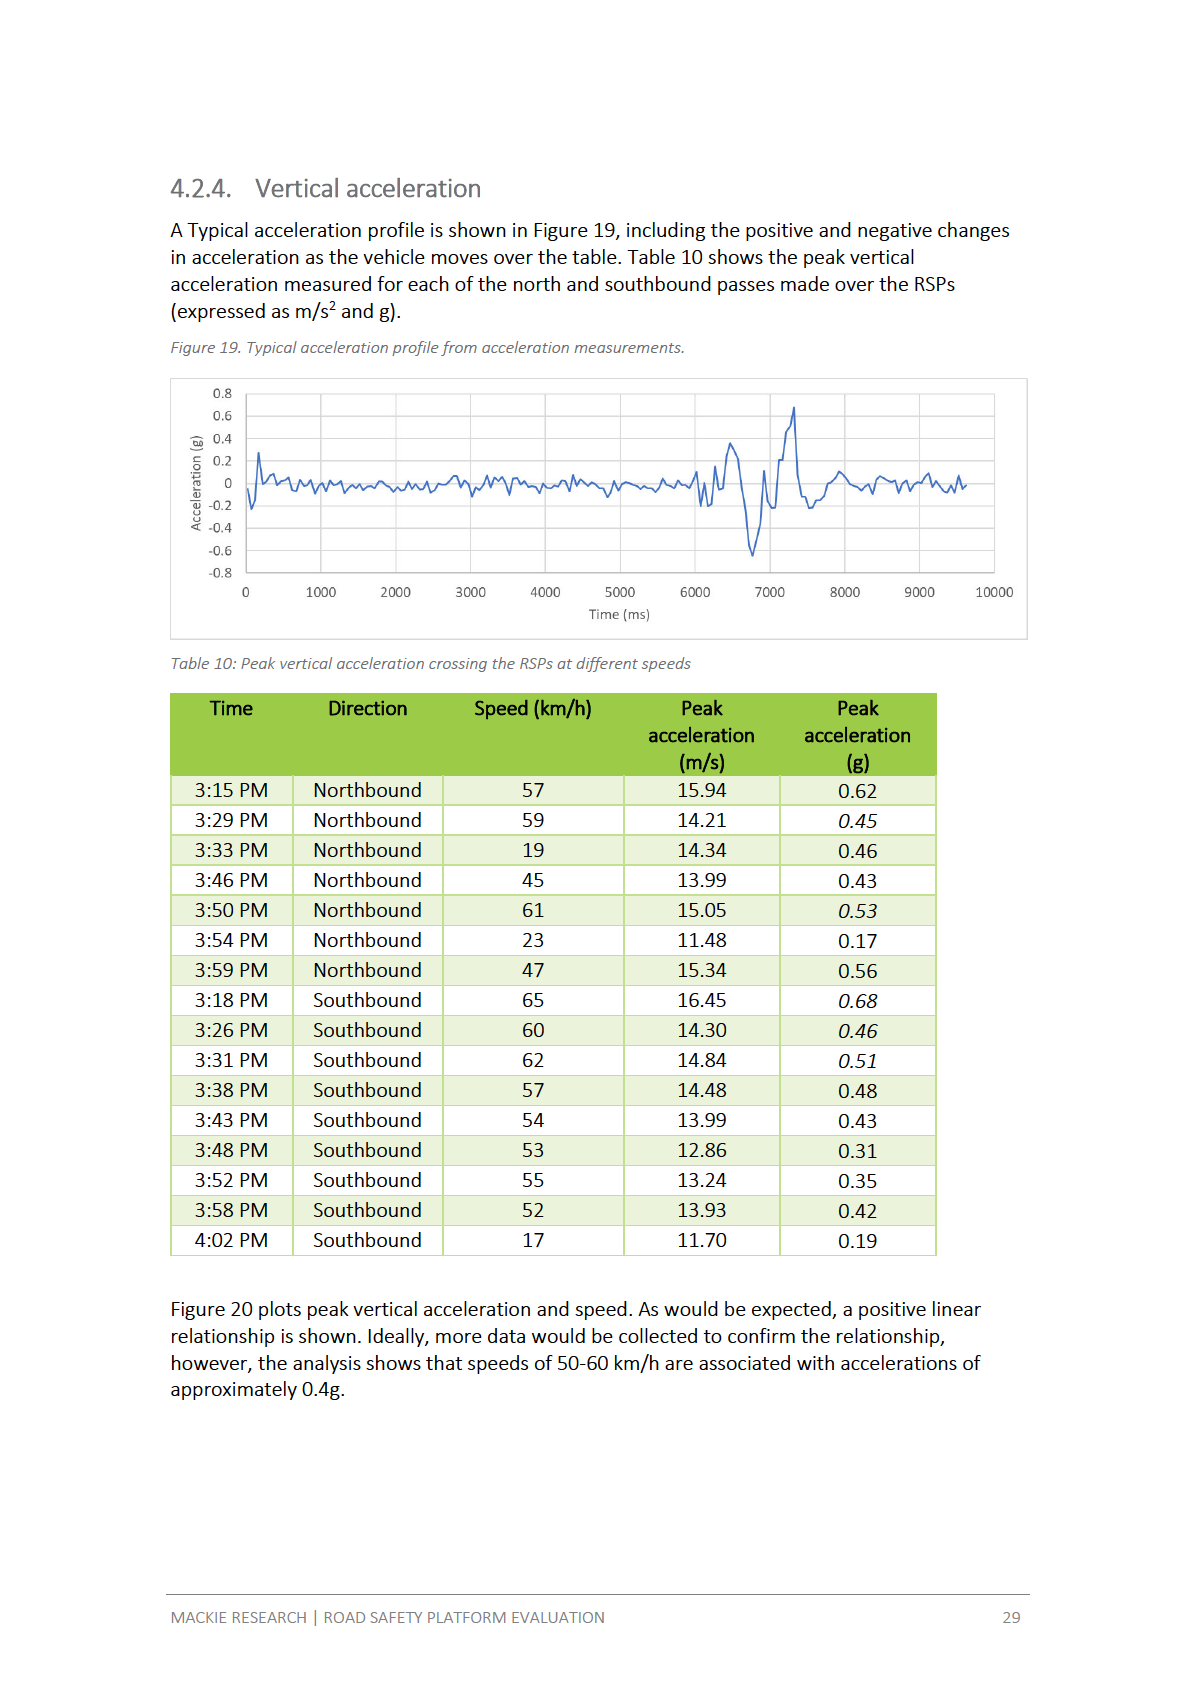
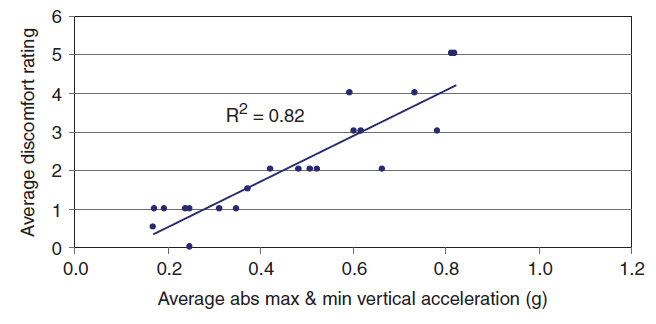 Figure 20: Peak vertical acceleration crossing the RSPs at different speeds
1982
Act
Information
A 2004 study23 of the impact of road humps on driver comfort is used to assist with the
interpretation of the vertical acceleration results in this study. The earlier study reported that
vehicle occupants are generally unwilling to accept a peak vertical acceleration of greater than
0.7 g. Further, accelerations of approximately 0.4g, the ‘g’ force of appropriate speeds (50-60
km/h) over the RSPs found in this study, were equated with average driver discomfort ratings of
224, where a rating of 2-3 = Slightly uncomfortable (Figure 21). Therefore, taking the 2004 study
Official
as a reference point, it can be concluded that the peak vertical acceleration of appropriate
speeds over the RSPs is within acceptable ranges for driver comfort.
Figure 21: Correlation between driver discomfort rating and vertical acceleration
the
under
Source: Kennedy, J., et al (2004).
Released
23 Kennedy, J., et al (2004). Impact of road humps on vehicles and their occupants. Prepared for Charging
and local Transport Division, Department of Transport. TRL Report TRL 614.
24 Where 0-1 = Comfortable, 2-3 = Slightly uncomfortable, 4-5 = Uncomfortable, and 6 = Very
uncomfortable.
MACKIE RESEARCH | ROAD SAFETY PLATFORM EVALUATION
30
Earlier simulation work was also carried out by WSP-OPUS to investigate whether the proposed
inclusion of an RSP on the right-hand turn (into Thomas Rd) would have a significant effect on
the stability of turning trucks25. The RSP was modelled to have negligible effects on changing the
critical roll-over speed, compared with the same turn without the RSP, for both constant speed
and constant acceleration.
4.2.5.
Cyclist and pedestrian safety
1982
No cyclists or pedestrians used the intersection in the periods coded for the braking analysis,
while one cyclist was recorded during the stopping behaviour analysis. There was nothing about
this example of cyclist use of the intersection that suggested unsafe use for the cyclist.
Act
4.2.6.
Safety perception (community)
One potential safety related concern about the RSP was received by Hamilton City Council
during the period monitored (see below). The submission raises concern about the visibility of
the RSP and suggests the need for improved signage.
“Just a question, who is in control of the section of Gordonton Road near Thomas Road? The
raised table near the traffic lights is particularly difficult to see at night in bad weather. There
is very little depth perception to see that the cross hatching indicates a height change in the
road surface. If the light is green for traffic coming down hill that don’t know about it, hitting
Information
the table could cause an accident. The signage needs to be clearer or a speed bump sign
needs to be clearly visible.”
It is understood that the RSP project team are also aware of the visibility concern raised by the
submission. Independently, other individuals have commented that the visibility of the vertical
nature of the RSP could be made more obvious. These perceptions do not report a critical safety
event and the performance standard established for the perceived safety dimension of merit is
Official
therefore achieved. However, the comments about this do suggest that consideration of how
the vertical component of the RSP could be made more obvious, is warranted.
the
4.3. Delivery and operation
4.3.1.
Traffic flow and throughput
Assessment of the impact of the RSPs on traffic flow and throughput undertaken by the
under
Hamilton City Council Transport Systems Engineer concludes that there is currently little
evidence that the RSPs are significantly impacting intersection capacity. It is observed the RSPs
may actually replicate the effect of how limiting motorway speed during times of high volume
can increase throughput (i.e. reducing the operating speed somewhat at the intersection may
not necessarily have any effect on throughput during times of high volumes).
The assessment also concluded:
• Driver behaviour at the intersection when accelerating from stopped (i.e. from green)
appears similar to non-RSP sites in terms of acceleration rate and headway.
Released
• Since fully operational, there has been no requirement to alter ‘normal’ traffic signal timing
settings (e.g. inter-green times) as a result of the RSPs.
25 Jamieson, N. (2018). Investigation of proposed road safety platform at Gordonton Rd using simulation
modelling. Opus Research Report 18-232499.26
MACKIE RESEARCH | ROAD SAFETY PLATFORM EVALUATION
31
• The heavy vehicle acceleration rate appears more of a factor, for both RSP and non-RSP
sites, compared to whether there is a raised platform (e.g. in the situation when light
vehicles are ‘stuck’ behind a heavy vehicle that is accelerating slowly away from the
intersection).
• Higher-speed platform profiles, as used in the Hamilton RSPs, are likely to help with
avoiding effects on intersection delay, compared to more abrupt platforms that seek a
more significant speed reduction (e.g. 25-30km/h).
1982
The observation that RSPs may actually increase traffic throughput during peak volumes
concurs with earlier Dutch research26 cited by Corben & Candappa (2014)27. The Dutch study
reported that raised stop bars at very busy intersections not only improved safety but also
enhanced intersection capacity and the ability to negotiate intersections.
Act
4.3.2.
Noise
During the development of the evaluation plan, noise measurement was considered. However,
on inspection of the intersection in operation, including articulated trucks driving over the RSPs,
it was determined that the noise impacts are likely to be negligible, and probably undetectable
compared with the other noises caused by vehicles moving through the intersection. Earlier
consultation with a noise measurement expert also suggested difficulty in objectively measuring
the noise impacts of the RSPs without clean baseline data. Therefore, on balance it was decided
that the effort required to collect noise data was not justified by the marginal value it would
Information
provide.
There have not been resident reports of noise caused by the RSPs, and this will continue to be
monitored by Hamilton City Council in Future.
4.3.3.
Council and community buy-in
Official
As reported, only one safety related concern about the RSP was received by Hamilton City
Council during the period monitored. The Hamilton City Council project close down report and
summary of findings from the lessons learnt workshop (see below) reports high Councillor
the
engagement and support, high stakeholder satisfaction overall, high level of partner trust,
commitment, and confidence, and no major project related complaints from the community
during the design and implementation stages.
4.3.4.
Project delivery
under
Project delivery issues identified during the 'lessons learned' workshop were reported by
Hamilton City Council28.
26 Fortuijn, LGH, Carton, PJ & Feddes, BJ (2005). Veiligheidseffect van kruispuntplateaus in
gebiedsontsluitingswegen. In CROW (Ed.), Bijdragen Verkeerskundige Werkdagen 2005 (pp. 1-19). Ede:
CROW.
27 Corben, B., & Candappa, N. (2014) Proposed trial of elevated stop lines at Surfcoast Highway and
Released
Kidman Avenue, Belmont. Final Project Report. Corben Consulting and Monash University Accident
Research Centre.
28 Hamilton City Council (2019). Project Closedown Report. Thomas/Gordonton Intersection
Improvement. Trim document number: D-3015913. Hamilton City Council.
MACKIE RESEARCH | ROAD SAFETY PLATFORM EVALUATION
32
The Council report concludes that the project was completed satisfactorily, was of high quality,
had high councillor engagement and support, and overall high stakeholder satisfaction, and had
achieved intended outcome. Factors contributing to the success of the project were identified
to include:
• effective working relationships
• collaboration between project staff and contractors
• good communication
• quality and fit for purpose methods and solutions
1982
• innovative practice,
• partner trust, commitment, and confidence.
Act
There was timeframe pressure throughout the project and the end date changed on a number
of occasions. Pressure to complete the project was exacerbated by a fatal crash during the
design stage. A degree of flexibility during the design and implementation stage was considered
appropriate and inevitable given that the project was the first of its kind in New Zealand.
Management of vehicle speeds through the worksite during construction was challenging,
however, was managed satisfactorily. No major complaints about the project were received
from the community during the project design and implementation stages.
A range of delivery and operation issues were identified in the Council report. In synthesis,
these issues reinforced the importance or need in such projects for:
•
Information
clearly defined project processes, systems, concepts, roles and responsibilities, timing, and
roll out (at the outset and early in the planning stage)
• project ownership and leadership within Council
• effective project management, including on-going monitoring of actions and milestones,
and risk management
• necessary pre-construction information, testing, design, and other preparations (e.g.
service locations, pavement testing)
Official
• defined communication channels, integration of different communication channels, and
the maintenance of communication through all stages
• identify, engage, and work with key stakeholders early in planning and throughout as
the
required
• engage community early in the planning process and maintain communication throughout
the project
• effectively manage community expectations (e.g. timing, completion).
under
The synthesis above indicates that delivery issues associated with the RSP project were largely
consistent with those that might be expected in other similar projects. Further, there is little
evidence that the project generated delivery issues specific or unique to the RSP treatment
itself.
Released
MACKIE RESEARCH | ROAD SAFETY PLATFORM EVALUATION
33
1982
Act
Information
Official
the
under
Released
1982
Act
Information
Official
the
under
Released
1982
Act
Information
Official
the
under
Released
6. EVALUATION CONCLUSION
This section concludes on the overall effectiveness of the RSPs and gives direction to the further
development of RSPs and the RSP evaluation framework.
6.1. RSP effectiveness
1982
The primary purpose of this evaluation was to determine whether the Gordonton/Thomas Road
RSPs provide an effective Safe System solution for reducing DSI crashes at signalised
Act
intersections. A secondary purpose was to learn about implementation issues and wider
performance characteristics.
The RSPs met all 10 of the measured performance standards established. From this result, it is
concluded that the RSPs are an effective Safe System solution. Note, however, that reduced DSI
crashes is the ultimate long-term measure of success and this will be measured at an agreed
time in the future.
The most important measure of effectiveness within the scope of this evaluation is intersection
speed, and while the absence of clean baseline data reduces the confidence with which
measured speeds after installation can be attributed fully to the RSPs, the evaluation shows
Information
speeds well under the target of not exceeding 50km/h. When the earlier performance of the
intersection is considered – with 85% speeds typically at approximately 80 km/h, it is clear that
the new intersection configuration, including the RSPs, is now operating in line with Safe System
performance levels.
The effectiveness of the RSPs are also noteworthy given that the approach speeds are relatively
high with variable compliance with the 60 km/h speed limit. The high (>60km/h) approach
Official
speeds, while not specifically part of the RSP performance standards are areas for future
attention with regard to the effectiveness of other supporting speed management measures
such as lowered speed limits and speed limit threshold treatments.
the
The RSPs met the performance standard on five dimensions of merit under the potential for
associated safety risks. There was insufficient data to concluded on the sixth dimension
(likelihood of impact on the behaviour of VRUs). Overall, it is concluded there is a low risk of
associated safety risks from the RSPs, including other crash types.
The RSPs met the performance standard established on all four dimensions of merits under
under
delivery and operation indicating good performance in this regard
Overall, RSPs are likely to be an effective road safety countermeasure moving forwards.
6.2. Further developments
Feedback on the RSP treatment suggests that the Hamilton City Council may wish to investigate
strategies for improving the visibility of the RSP and particularly the change in height. Possible
Released
measures could include a colour treatment (e.g. Red) on the platform itself.
The RSP evaluation framework developed through this evaluation will be strengthened by
ensuring appropriate baseline data collection, so that resulting changes on key performance
indicators for future projects can be more confidently attributed to the installation of RSPs.
MACKIE RESEARCH | ROAD SAFETY PLATFORM EVALUATION
37
7.
1982
APPENDICES
Appendix A: Layout for data collection (Background plan courtesy of WSP-OPUS)
Act
Information
Official
the
under
MACKIE RESEARCH | ROAD SAFETY PLATFORM EVALUATION
38
Released
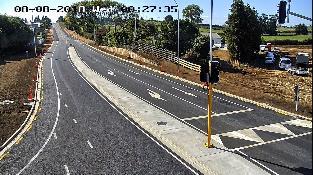
Appendix B: Video analysis framework and protocol
This analysis involves two protocols from two different cameras:
• Hamilton City Council Camera
o CCTV footage
o High-resolution
o View of approaching vehicles
1982
o Cannot determine signal phasing
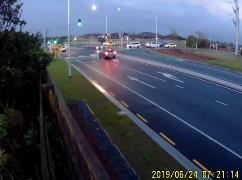
• Opus Camera
o Poor quality footage, sometimes blurred
Act
o Rear view of vehicles approaching intersection
o Can determine signal phasing
o Good understand braking behaviour. However, only clear at night/dusk/dawn
Hamilton City Council Camera
Opus Camera
Information
Official
Hamilton City Council Camera
the
under
Released
MACKIE RESEARCH | ROAD SAFETY PLATFORM EVALUATION
39

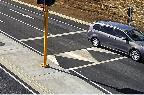
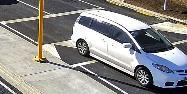
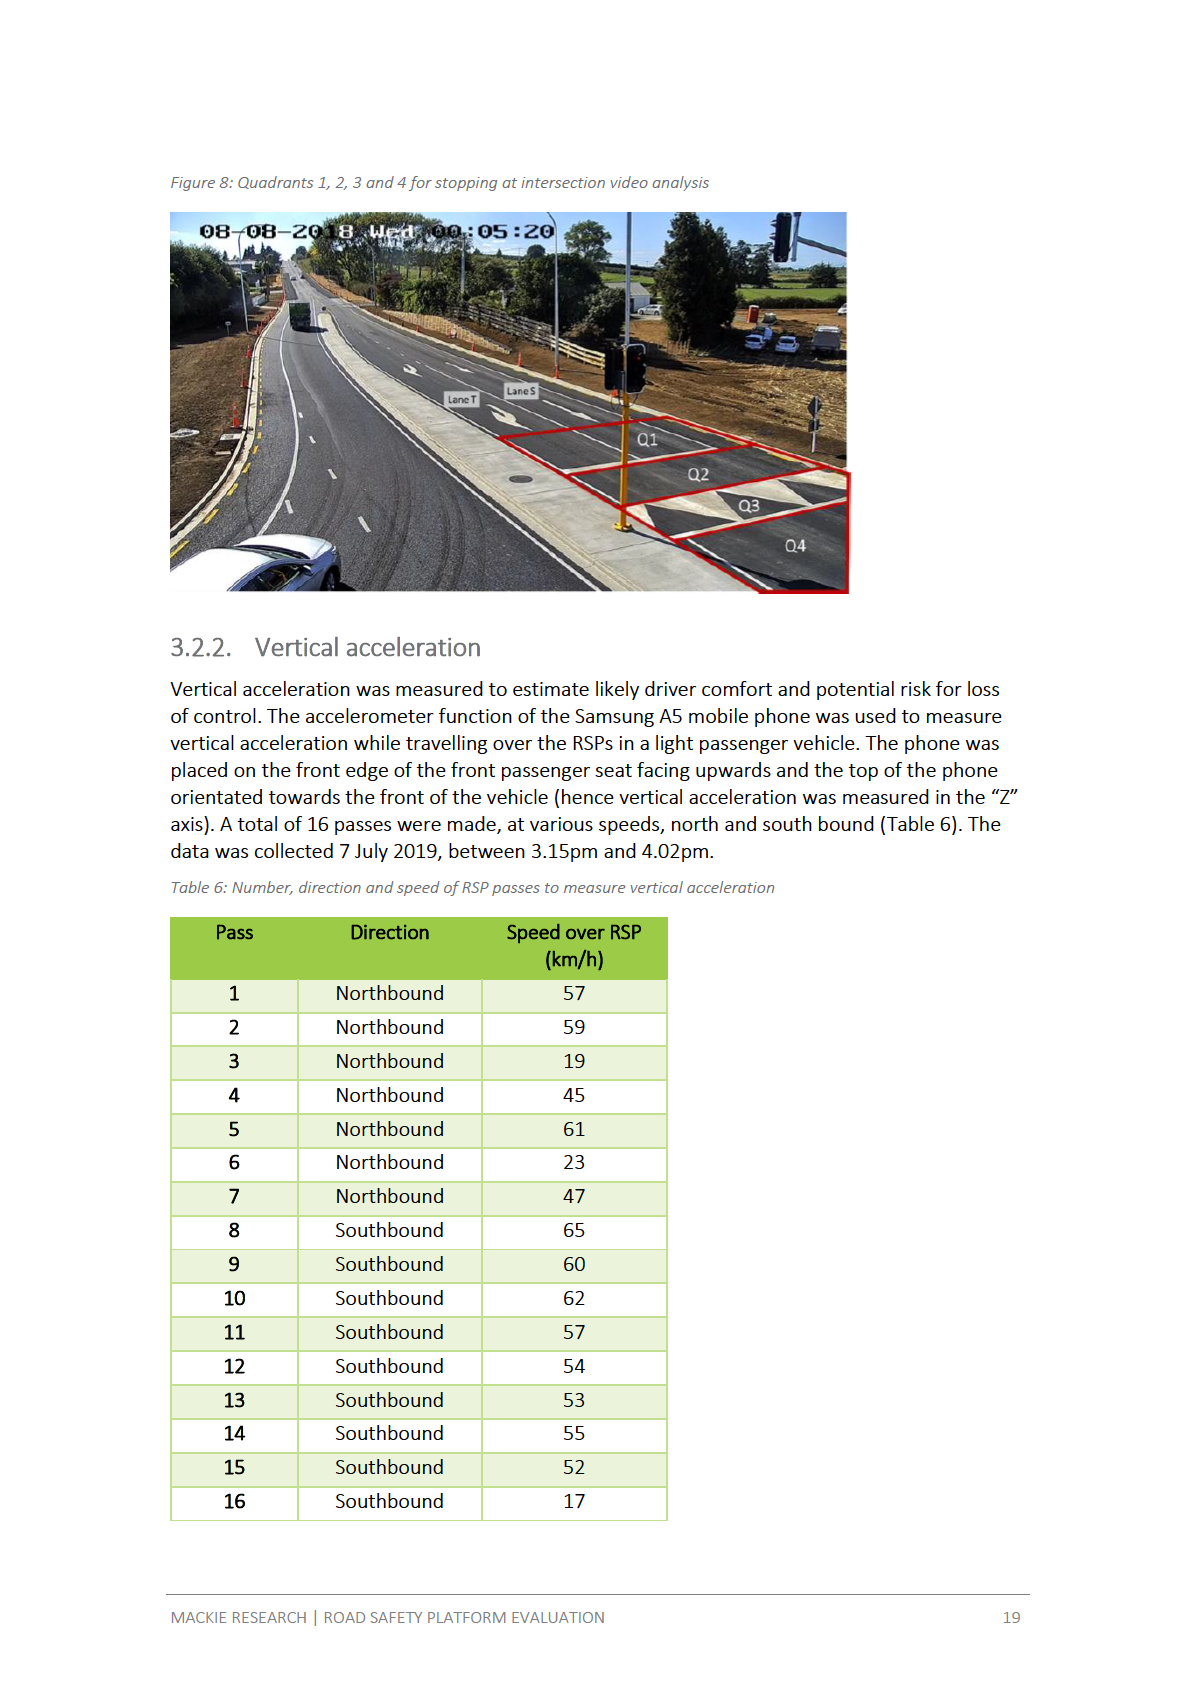
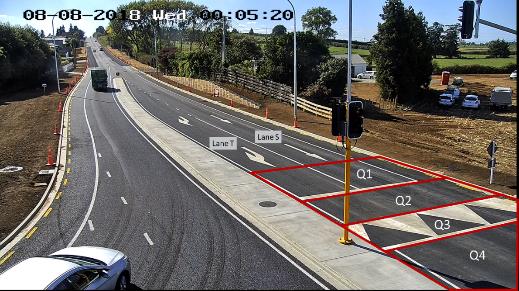
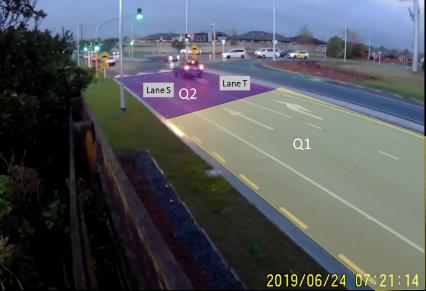
Aim
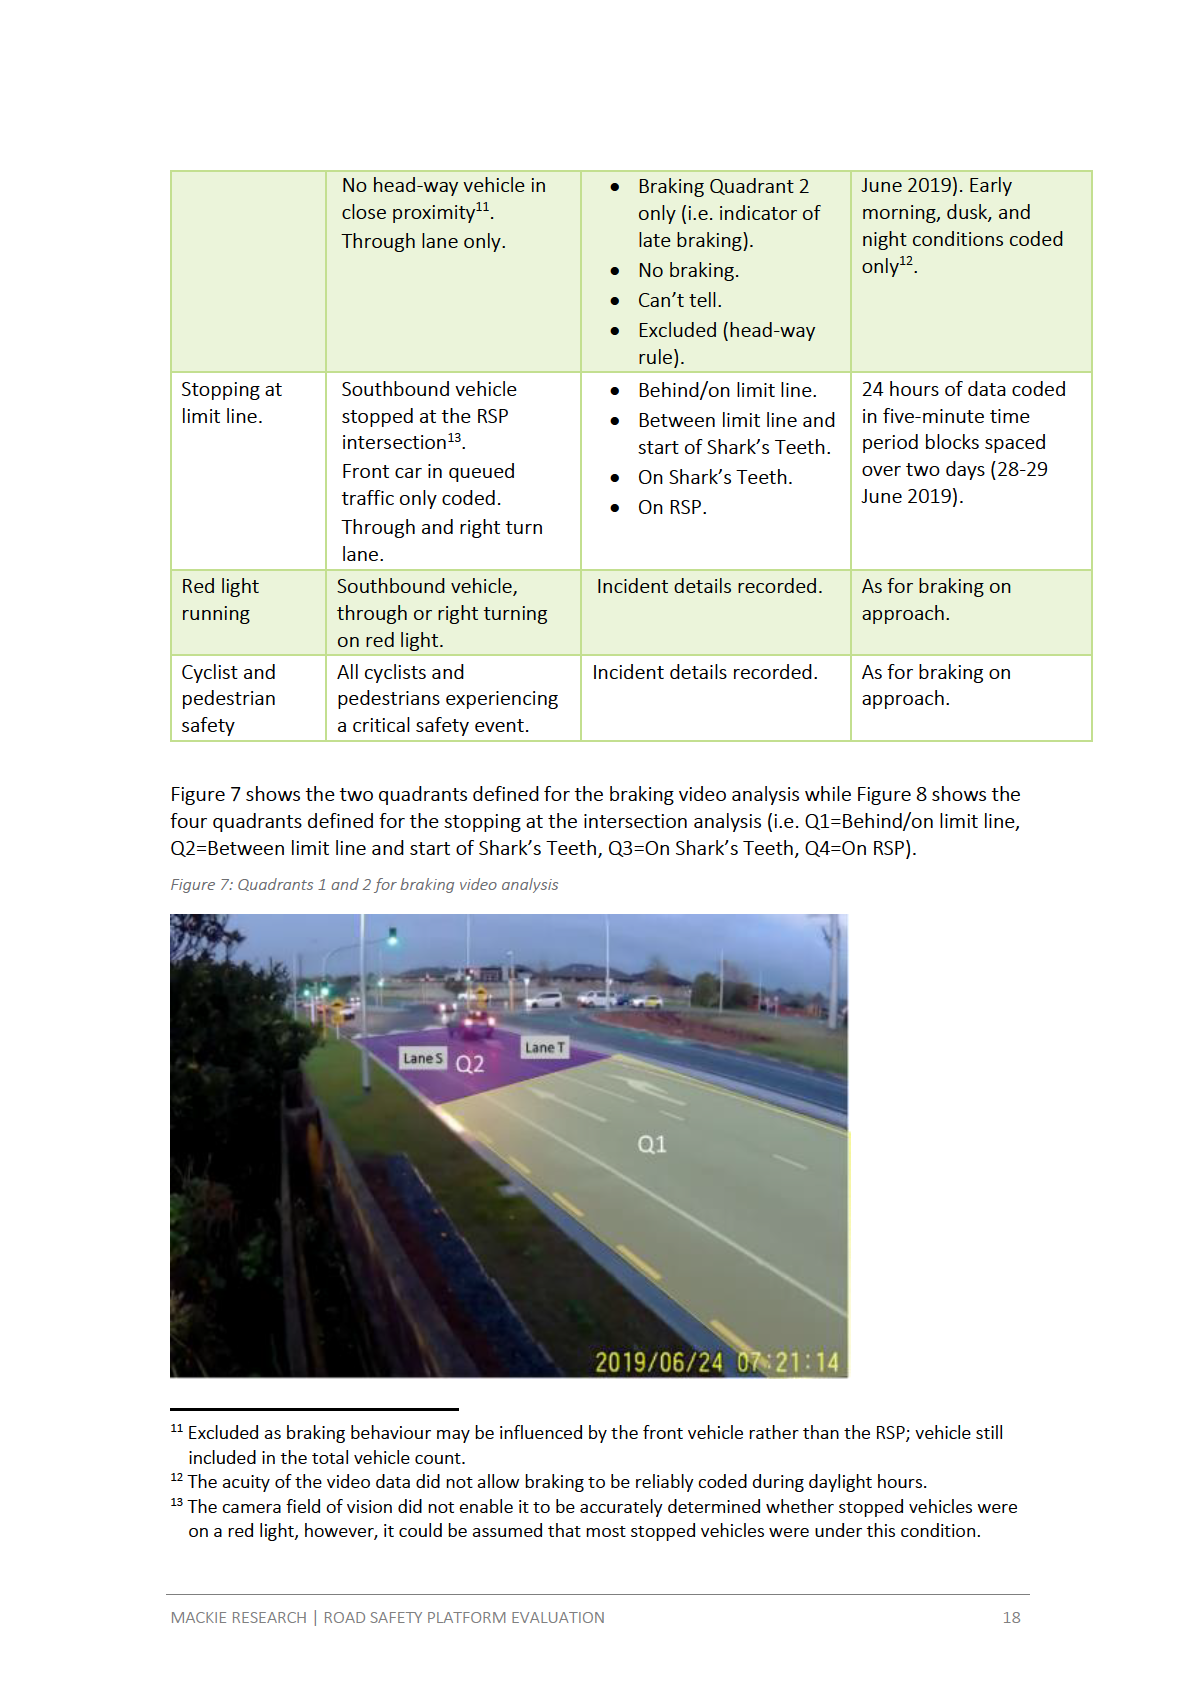
This field of view gives us an indication of vehicle’s limit line compliance when stopping.
Behaviour in each lane is recorded separately (T=turning lane; S=straight ahead). The field of
view has been divided into four quadrants:
• Q1 – Behind or on the limit line
• Q2 – Between the limit line and the start of the Shark’s Teeth
• Q3 – On the Shark’s Teeth
1982
• Q4 – On the table
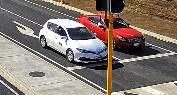
A vehicle’s location is determined by the placement of their front wheels. Some examples are
shown below.
Act
Q1
Q2
Information
Q3
Official
Q4
the
Because the camera angle does not show the traffic light, we cannot determine red light
running from this field of view. However, we can determine the location past the limit line that
they stop. under
This camera angle does not show the signal phasing. Therefore, we won’t be able to detect
people running a red light. But this will potentially help to explain the slightly high levels of red
light running mentioned by John Kinghorn from the Hamilton City Council.
Coder notes
• Only code vehicles who have stopped and who are at the front of a group
• Watch in 4x speed
• Set a timer for every 5 minutes. At every 5-minute interval, add in a code under the
Released date and time column. This will break the coding up into 20-minute video blocks
• Code 24 hours of footage across one day.
• If a pedestrian or cyclist is present in the intersection, give them a new row, put in a
timestamp and highlight it
MACKIE RESEARCH | ROAD SAFETY PLATFORM EVALUATION
40
WSP Opus camera
1982
Act
Aim
The coding protocol for this camera view will look at vehicle’s braking behaviour on approach to
Information
the intersection under green light conditions.
• Examine braking behaviour for both lanes of traffic
o B = Is the vehicle braking for the whole frame (Q1+2)
o O = Braking in Q1 only
o L = Do they brake quite late (Q2)
o N = No braking
Official
o U = Can’t tell
o E = Excluded because someone is in front of them (less than two arrows), or
they started from stopped (i.e. red light), or were in a queue (i.e. red light)
the
In addition, vehicles that are non-compliant with the red signal (go through the entire
intersection) will be coded.
• Date, time, lane
• Number of seconds between the light turning red and the entry into the intersection
• Other traffic present? Any incidents?
under
• Any braking, slowing behaviour?
• Open-ended description
Coder notes
• The signal phasing differs for through vs right-turn vehicles. Important to be alert to this
during coding
• Code 8 hours of footage at x1 speed
•
Released
Code only during low-light conditions
• If a pedestrian or cyclist is present in the intersection, give them a new row, put in a
timestamp and highlight it.
MACKIE RESEARCH | ROAD SAFETY PLATFORM EVALUATION
41
1982
Act
Information
Official
the
under
Released