1982
Act
Information
Official
the
under
Released
1982
Act
Information
Official
the
under
Released
Contents
Executive summary ........................................................................................................... 5
1
Introduction ............................................................................................................ 11
1.1 Practically applied evidence can save lives and reduce injuries .................................... 11
1.2 Deeper issue – humans are prone to bias when judging risk ......................................... 11
1.3 Purpose of this report ..................................................................................................... 11 1982
2
Speed and safety – the evidence ............................................................................. 14
2.1 Role of speed in crashes and deaths and serious injuries .............................................. 14
Act
2.2 Effects of managing speed on the economy and other critical public health and
global policy issues.......................................................................................................... 24
3
Safe System and speed ............................................................................................ 31
3.1 Safe System principles .................................................................................................... 31
3.2 Safe System speeds – 20–30km/h for the safety of vulnerable road users ................... 32
4
Promotion of speed and psychological mistakes we all make – the evidence ........... 36
Information
4.1 How people came to believe speed is safe and good for them ..................................... 36
4.2 Continuing risk of high speeds despite driving skills and safety improvements ............ 39
4.3 Reducing speed is critical for road safety – it’s not a ploy to raise revenue from
enforcement ................................................................................................................... 41
4.4 Importance of also targeting people who speed by small amounts .............................. 42
Official
4.5 Advice to the road safety community ............................................................................ 44
4.6 Why people think because they speed without having a serious crash, the evidence
the
about speed and speeding must be wrong .................................................................... 44
4.7 Speed management is one tool in the toolbox .............................................................. 46
4.8 Evidence from other countries often applies in New Zealand ....................................... 46
4.9 Most road deaths and serious injuries are of local people ............................................ 47
under
5
Recap – actions that work and actions that do not .................................................. 48
5.1 Actions proven to reduce deaths and serious injuries ................................................... 48
5.2 Actions not proven to reduce deaths and serious injuries ............................................. 49
6
Conclusion .............................................................................................................. 53
References ....................................................................................................................... 54
Released
3
1982
Act
Information
Official
the
under
Released
Executive summary
Purpose of this report
This report provides evidence to promote road safety and build understanding of road safety
issues in relation to speed and speeding for New Zealand. The report does this by
highlighting the general applicability to New Zealand of most evidence on speed and
speeding based on much that is common to all countries: the universal laws of physics and
1982
the features of human vulnerability to physical force and error.
The report draws on practical evidence from around the world and New Zealand to explain
the risks of speed and speeding as they apply in New Zealand. It identifies evidence-based
Act
actions to save lives and avoid debilitating injuries; provides evidence to help understand
and counter misinformation and the psychological errors we make in judging road use risk
and speed; informs engagement with the media, stakeholders and communities; and
supports decision makers to make evidence-based decisions. The report is a resource for
information, understanding and evidence-based solutions.
Evidence-based solutions save lives and have positive economic impacts
The evidence-based solutions identified will save many, many lives and reduce injuries and
Information
disabilities. To achieve this, we must change some of our current psychological tendencies as
well as our apparently intuitive perspectives on speed and safety, and we must resist the
misleading promotion of speed as safe and good for the economy. These messages are often
well meant but are misinformed and sometimes driven by vested interests.
We can take heart from the clear scientific evidence (sometimes contrary to common views)
Official
that better management of speeds will deliver many less visible benefits as well as safety:
reduced greenhouse gas emissions, reduced health harm and health system costs from air
and noise pollution, more liveable cities, and improved social equity. The evidence shows
the
the real net economic improvements to be achieved are huge, in addition to the deaths,
injuries, disabilities, pain, grief and suffering avoided with lower speeds.
We all (as road safety decision makers and politicians, journalists and commentators,
implementers of safety interventions, road system operators and suppliers, and road users)
under
have a role to play is delivering this opportunity for huge improvement for New Zealanders.
We can advance road safety by understanding from the evidence in this report and
advocating for the following:
• Speed and speeding are major contributors to crash occurrence and crash severity
through multiple mechanisms.
• An extensive body of scientific evidence clearly shows that speeding and speed have
substantial roles in crash deaths and serious injuries.
Released
• The evidence about speed and speeding exists for and applies in New Zealand. A tragic
pattern shows that increasing speeds causes increases in crashes, deaths and suffering,
but also shows the opportunity – decreasing speeds reduces crash deaths and suffering.
5
• The human cost of crashes caused by speed and speeding is personal, often tragic, but
also community-wide, profound and avoidable.
• As well as reducing deaths and serious injuries on the roads, improved management
of speed will deliver additional benefits that far outweigh the (often over-estimated)
dis-benefits.
• We need to understand and address how people’s psychological make up means we
often don’t believe the evidence.
1982
• There are sound proven ways to manage speed and speeding and, thus, to save many
lives and reduce injuries each year in New Zealand.
Act
Evidence on speed and speeding
Speed is the “toxin” in crashes. Speed contributes directly to the occurrence of crashes and
their severity through the many mechanisms described in this report. Evidence from
hundreds of scientific studies and analyses combines to show that reductions in speed
generate dramatic reductions in serious crashes, yielding powerful cost-effective
opportunities to save lives, avoid injuries, and generate many other social and economic
benefits.
Evidence demonstrates the critical role of speed in serious crash occurrence
Information
The real-world research takes various forms, including studies of average speed and serious
crash risk, studies of crash impact speed and probability of death, and evaluations of the
safety benefits of many interventions that reduce speeds. Across all these approaches the
evidence aligns to demonstrate the critical role of speed in serious crash occurrence.
Official
First, for research on average speed and serious crash risk, syntheses combine evidence
from many countries and show that each 1 percent decrease in average speed yields about a
4 percent decrease in fatal crashes and around a 3 percent decrease in serious injury
the
crashes.
Second, studies of impact speed show that small changes in impact speed result in large
changes in chance of survival. For example, a 2019 study combining research data from
multiple countries showed that each 1 km increase in impact speed produced an 11 percent
under
increase in the likelihood of a pedestrian death and a 7 percent increase of serious injury.
Third, evaluations of numerous safety interventions that reduce speeds (including lower
speed limits, safety cameras, vehicle technology to reduce speeds, and traffic calming such
as gateway treatments, speed humps and raised safety platforms) show powerful crash
avoiding, injury-reducing and life-saving outcomes.
Released
6
Focus on travel time costs of reducing speed without consideration of savings is
profoundly misleading
The evidence shows the focus on the travel time costs of reducing speed without
consideration of the many savings (reduced crash costs, fuel costs and health costs from air
and noise pollution) has been profoundly misleading. Economically ideal speeds are
consistently found to be below prevailing speed limits, even without including the benefits
of lower speeds for greenhouse gas emissions. Economic analyses show net improvements
1982
to economies from lower speeds and show that for speed-reducing actions the total costs of
the intervention are more than returned in crash cost savings alone.
Act
Low-level speeding contributes more to serious crashes than extreme speeding
Finally, the evidence also shows that low-level speeding contributes more to serious crashes
than extreme speeding because low-level speeding is so common. This is the case even
though each case of extreme speeding has a much higher serious crash risk than each case
of low-level speeding.
Speed management, including enforcement, must maintain a focus on eradicating low-level
speeding as well as high-level speeding.
Information
Speed and speeding in New Zealand
International evidence can be expected to apply in New Zealand
Based on the laws of physics and shared limitations of humanity, the above evidence can be
expected to apply in New Zealand. Many studies show directly that it does apply. Examples
are presented in this report, including the evidence that various road safety actions that
Official
reduce speeds also reduce serious crashes in New Zealand, including gateway treatments,
covert safety cameras and reduced speed limits. New Zealand also has the experience that
the
increasing speed limits increases serious crashes.
Around 60 percent of all fatal crashes involve speeding
Evidence-based corrections for the difficulty of identifying speeding in serious crashes (as
acknowledged by New Zealand Police as well as police in many other countries) show that
under
around 60 percent of all fatal crashes in New Zealand involve speeding. Avoiding these fatal
crashes would have saved around 1920 deaths in the decade 2011 to 2020. In addition,
because many speed limits in New Zealand are higher than Safe System levels, unsafe speeds
also contribute to crashes even in the absence of speeding.
Economically ideal speeds on highways are below prevailing speed limits
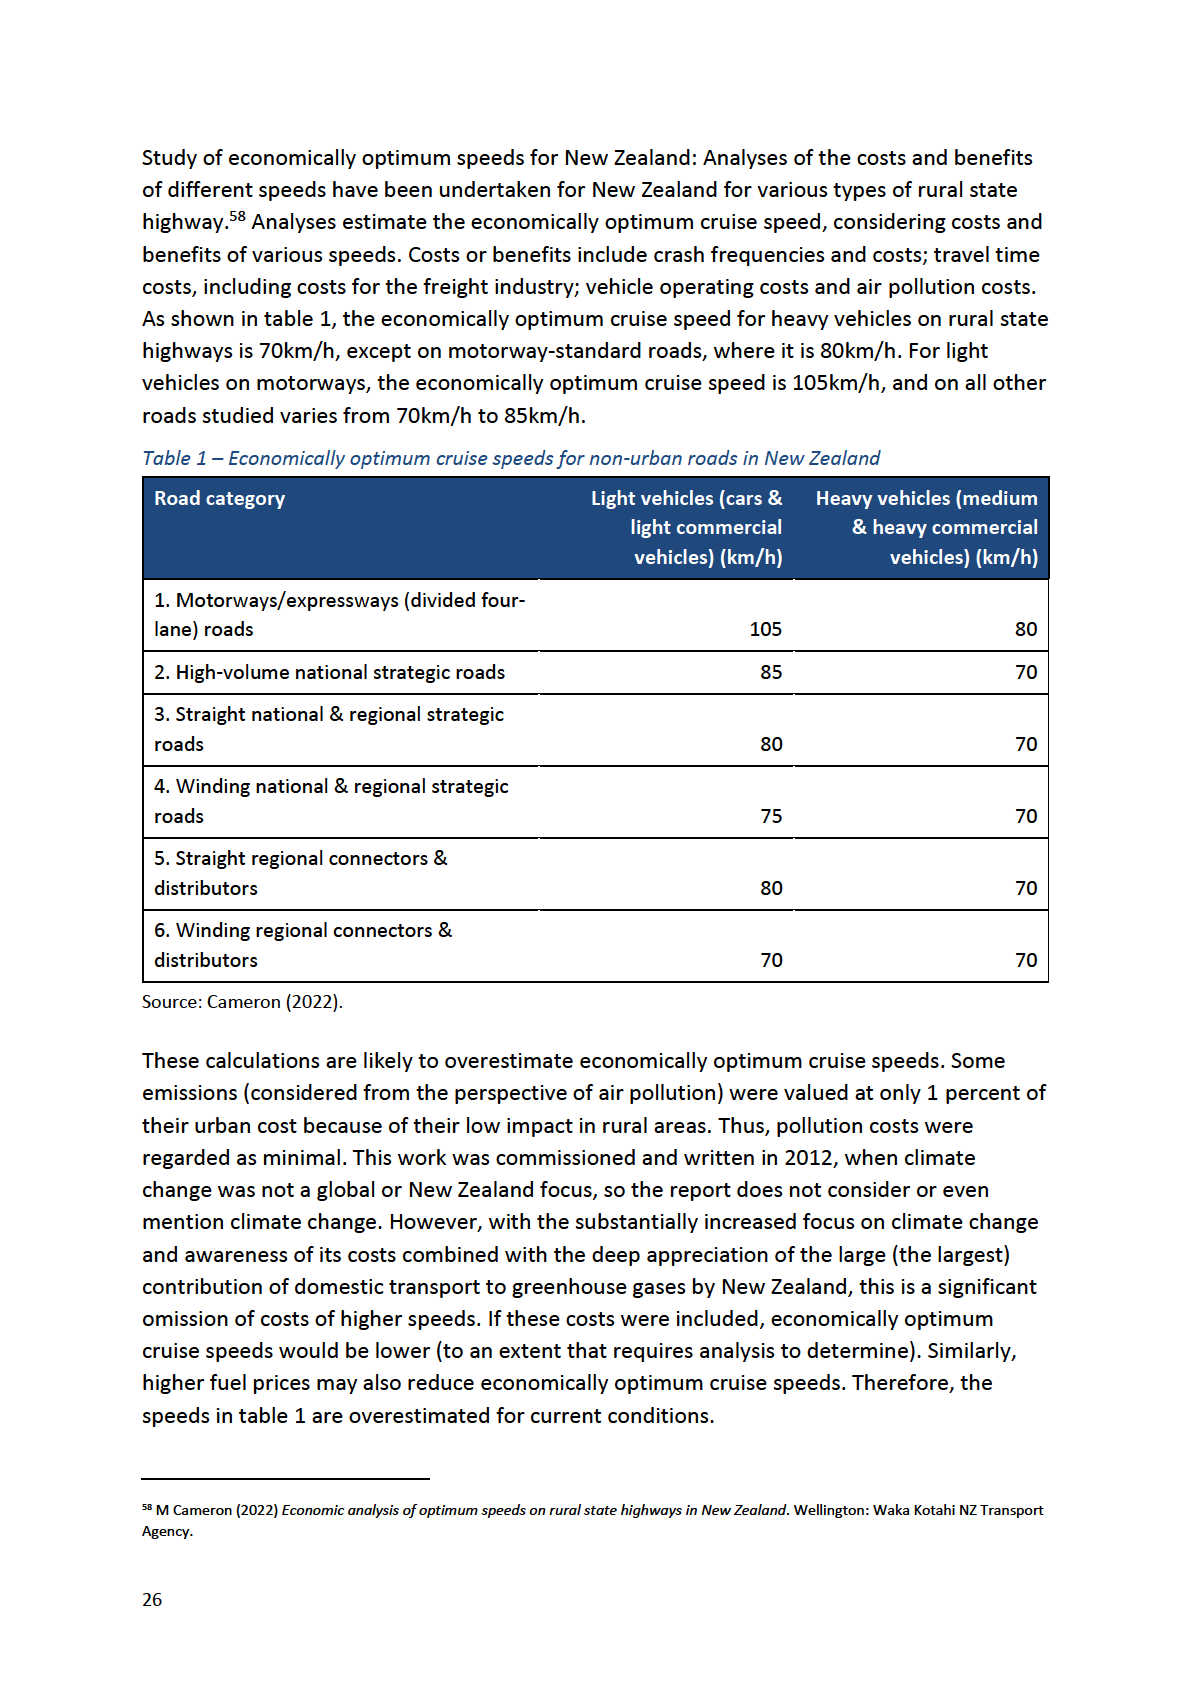
Finally, analyses of the economically ideal speeds on highways in New Zealand consistently
Released
show that ideal speeds for the economy are below New Zealand’s prevailing speed limits.
Including the significant savings that would occur for greenhouse gas emissions, which were
not considered in this study, will further reduce the economically ideal speeds.
7
Actions that work
Actions proven to reduce speeds, and thus to reduce deaths, injuries and crashes, are:
• lower speed limits
• speed enforcement, including safety cameras, especially covert cameras
• general deterrence (created through many actions in addition to enforcement, including
effective and unavoidable penalties and public promotion of enforcement)
•
1982
graduated licensing systems in which speed is addressed within the constraints placed
on novice drivers
• many road engineering measures to reduce speeds such as speed humps, speed Act
cushions, raised platform crossings and raised intersections, lane narrowing, chicanes,
gateway treatments and roundabouts
• vehicle technologies such as intelligent speed adaptation, continuous speed monitoring
and speed limiting.
Evaluations also show that car-handling skills-based driver training and school-based driver
training not only fail to improve safety but may even increase crash rates. The training
increases driver over-confidence and thus risk-taking, and enables people to obtain their
licences at an age before important brain areas, and thus impulse control, are sufficiently
Information
developed.
Actions applicable in New Zealand
Much of the above evidence has been directly tested and shown to apply in New Zealand,
including gateway treatments, lower rural and urban speed limits, and safety cameras,
Official
especially covert cameras.
Some evidence, such as of particular social campaigns or messages from other countries, will
apply only to the extent that parallel social attitudes and beliefs exist in New Zealand and
the
the country in which the messaging succeeded.
Furthermore, some evaluations of on-road changes (such as lower speed limits and the
addition of covert safety cameras) in New Zealand provide both the extent of change in
average speeds and the extent of change in serious crashes. These studies reveal reductions
under
in deaths and injuries that, for the measured changes in speeds, were larger than those
predicted from the global research.
Thus, if New Zealand differs from other countries in relation to the importance of speed and
the value of speed-reducing actions, it is that speed is even more important for safety in
New Zealand than elsewhere. Possible explanations of this include New Zealand’s
challenging mountainous typography and many curved roads with unforgiving roadsides
such that a speeding run-off-road crash that would be survivable in another country may be
Released
less likely to be survivable in New Zealand.
8
Conclusion – lower travel speeds will deliver an array of benefits
In summary, the practical evidence shows that lower travel speeds in New Zealand will
deliver an array of benefits such as:
• major reductions in crash deaths and injuries
• reduced health harm from air and noise pollution
• more liveable cities with greater opportunities for active transport
•
1982
improved social equity
• reduced greenhouse gas emissions
• an improved economy.
Act
This report provides evidence to support strategy, policy and implementation.
Information
Official
the
under
Released
9
1982
Act
Information
Official
the
under
Released
1
Introduction
An expansive body of scientific evidence exists on road safety, but many people are unaware
of it.
1.1
Practically applied evidence can save lives and reduce injuries
Research, data and evidence on road safety can be practically applied to save lives and
reduce injuries from road crashes. Large systems allow data from experiences and events to 1982
be collected from many millions of hours of real-world driving. Careful analyses of massive
data sets and rigorous evaluations
prove what works to reduce crashes and deaths and what
does not. On the other hand, people’s personal experiences and those of their friends are
Act
not enough to accurately identify the risk factors they face on the road.
Over the last 80 years, the approach to identifying road safety problems and solutions has
become increasingly informed by scientific evidence rather than reliance on the feeling that
“this should work” informed only by personal experience. Personal experience is important,
but it is scientific evidence that informs a true understanding of road safety and how to
improve it.
The large body of scientific evidence about road safety, especially for New Zealand, is the
Information
basis of this report.
1.2
Deeper issue – humans are prone to bias when judging risk
Approximately 80 percent of New Zealanders aged over 25 have a full driver licence and
drive a car or truck or ride a motorcycle. Most people judge risk from personal experience,
their observations of others, media coverage of road safety and crashes, conversations with
Official
friends, seeing the occasional crash, and, sometimes, data collected and analysed by
researchers.
the
However, people’s psychological make-up means they usually consider their experiences and
the information they get from around them in ways that are (consciously and unconsciously)
biased to outcomes that appear to suit them. This causes many people to misjudge such
things as risk and can lead to inaccurate, although seemingly sensible, conclusions. This
report describes these psychological biases and the evidence for them occurring and
under
influencing road safety.
1.3
Purpose of this report
This report can be used to promote road safety and build understanding about road safety
issues, especially in relation to speed and speeding.1 It can be used to inform engagement
Released
1
Speed refers simply to the occurrence of movement measures as distance per time, such as kilometres per hour (km/h). Thus, analyses of
the role of speed in crashes relate to changes in risk with changes in speed independent of the speed limit.
Speeding refers to driving
(including riding a motorcycle) above the speed limit (including particular driver or vehicle limits) or driving at an inappropriate speed for
the conditions. Here, we focus speeding primarily on driving above the speed limit. New Zealand Police notes that the other meaning of
speeding is rarely applied, but that other (more serious) charges may be applied in various circumstances.
11
with the media, stakeholders and communities and support decision makers to make
evidence-based decisions.
This report can also be used to address issues and misinformation often raised in opposition
to the management of speed, speed limits and speed enforcement. It draws on both
international and New Zealand research and evidence.
Road safety can be improved if road users (whether drivers, passengers, or people who walk,
cycle and scoot), road safety decision makers, the media and commentators, and
1982
implementers of safety interventions have an evidence-based understanding of the road
safety impacts of speed and speeding.
Although this report focuses on the numbers, each death and serious injury reflects a human
Act
tragedy. The deaths, permanent disabilities, losses, grief and suffering the numbers reflect
are avoidable.
Waka Kotahi has a role in accurately and directly informing the community about the
impacts of speed and speeding and increasing the evidence base used in public dialogue.
1.3.1 Key messages
Communications to communities and other stakeholders should reinforce the following
messages, which are supported by evidence:
Information
• Speed and speeding are major contributors to serious crash outcomes through multiple
mechanisms.
• The evidence is clear that speeding and speed have substantial roles in crash deaths and
serious injuries.
•
Official
The evidence about speed and speeding exists for and applies in New Zealand.
• The human cost of crashes caused by speed and speeding is personal, often tragic, but
also community-wide, profound and avoidable.
the
• There are sound proven ways to manage speed and speeding and, thus, to save many
lives and reduce injuries each year in New Zealand.
• As well as reducing deaths and serious injuries on the roads, improved management
of speed will deliver additional benefits that far outweigh the (often over-estimated)
under
dis-benefits.
• We need to understand and address how people’s psychological make-up means we
often don’t believe the evidence about speed and safety.
Released
12
1.3.2 How this report uses the evidence
This report uses the scientific evidence to:
• explain how the belief arose that “speed is good”
• show how speed is important in both crashes occurring and the severity of crashes
• demonstrate the roles of speeding and speed in serious crashes in New Zealand
• show the real, often hidden, costs of speeding and speed in New Zealand
1982
• identify what we can do to greatly reduce the costs of speeding, speed and risks to us all
• consider how personal perspectives, experiences and psychological make-up mean
people underestimate the risks of speeding and the importance of speeding and speed
Act
in crashes
• indicate optimum speeds that support safety, travel time, emissions and economic
benefits for New Zealand
• show the value of road safety changes for broader issues of public health, the
environment and climate change.
Information
Official
the
under
Released
13
2
Speed and safety – the evidence
The science of road safety includes a great deal of evidence on speed and its effects on how
crashes occur and how serious they are. This evidence comes from many sources, all of
which show how important speed (and, thus, speeding) is in serious crashes (internationally
and in New Zealand).
The evidence is presented in two broad areas:
•
1982
the role of speed in crashes and deaths and serious injuries (discussed in 2.1)
• the effects of managing speed on the economy and other critical public health and
global policy issues (discussed in 2.2).
Act
2.1
Role of speed in crashes and deaths and serious injuries
This section explains:
• how speed is fundamental to crash risk and severity, but drivers tend to underestimate
its importance (2.1.1)
• the risk of speed for crash occurrence and crash severity (2.1.2)
• why speeding is so important to safety in New Zealand (2.1.3)
•
Information
how lower speed limits improve road safety, even though some drivers do not obey the
limit (2.1.4).
2.1.1 Speed is fundamental to crash risk and severity, but drivers tend to
underestimate its importance
Speed is fundamental to the risk of a crash as well as its severity due to the basic laws of
Official
physics. This does not mean speed is the only safety issue – many factors contribute to crash
deaths and trauma. However, the evidence demonstrates that speed is one of the most
the
critical factors.
The energy (which must be absorbed, causing the damage) in a crash is determined by the
mass (or weight) of the vehicle involved and its speed. Energy is half mass (m) times speed
(v) squared (energy = ½m v2). Therefore, doubling the mass doubles the energy, but doubling
the speed does far more than double the energy – it increases the energy exponentially.2
under
Speed is the most important single factor in the formula. It affects not only crash severity,
but also crash occurrence, because it affects how long the vehicle takes to stop, how easily
the vehicle can be manoeuvred, and many other factors (described in this section).
The influence of speed is not intuitive. For example, a car that hits a wall (or tree or other
vehicle) travelling at 27 metres per second or around 97km/h (so less than a 100km/h speed
limit) exerts a force on the wall equivalent to well over 100 times the car’s weight.3
Released
2 AZ Jones (2020) The physics of a car collision. ThoughtCo. www.thoughtco.com/what-is-the-physics-of-a-car-collision-2698920 (retrieved
February 2022).
3 T Banas (2020) How to calculate crash forces. Sciencing. https://sciencing.com/calculate-crash-forces-6038611.html (retrieved November
2021).
14
Drivers generally believe speed has a linear (rather than exponential) relationship with crash
risk, and drivers generally underestimate the role of impact speed on their safety4 as well as
generally underestimating braking distances.5 Perceived risk is an important predictor of
drivers’ speed preferences,6 yet drivers commonly judge risk through incorrect cues and do
not identify various real risks in the road context.7
Despite underestimating the importance of speed, drivers do support more enforcement
actions for speeding. Surveys of drivers in New Zealand show majority support for
1982
enforcement of low-level speeding and a preference for lower, rather than higher,
enforcement thresholds.8
Speed contributes to serious crashes in many ways. Speed increases both the risk of a crash
Act
as well as its severity. Speed does this through more mechanisms than are generally
understood.9
Factors by which speed contributes to crash occurrence
Speed contributes to crash occurrence in nine main ways:
1. As speed increases so does the distance the vehicle travels in the time the driver takes
to see a problem ahead, judge what to do and react (for example, brake to a stop),
because the vehicle is travelling faster for that available time. The vehicle is closer to any
Information
problem situation identified even before the driver has judged the need to stop and
moved their foot to the brake pedal.
2. Once the brakes are applied, the vehicle takes longer to stop from higher travel speeds.
3. The area of vision shrinks with increasing speed: the driver is less likely to see a hazard
in a busy road environment when travelling at a higher speed than at a lower speed
Official
simply because the driver has less time to scan the environment on approach, so is
more likely to miss hazards.
the
under
4 R Elvik (2010) A restatement of the case for speed limits.
Transport policy 17(3): 196–204. https://doi.org/10.1016/j.tranpol.2009.12.006
5 O Svenson (2009) Driving speed changes and subjective estimates of time savings, accident risks and braking.
Applied cognitive psychology 23(4), 543–560. https://doi.org/10.1002/acp.1471
6 LM Ahie, SG Charlton & NJ Starkey (2015) The role of preference in speed choice.
Transportation research part F: Traffic psychology and
behaviour 30, 66–73. https://doi.org/10.1016/j.trf.2015.02.007; SG Charlton & NJ Starkey (2017) Driving on urban roads: How we come to
expect the “correct” speed.
Accident analysis & prevention 108: 251–260. https://doi.org/10.1016/j.aap.2017.09.010
7 SG Charlton, NJ Starkey, JA Perrone & RB Isler (2014) What’s the risk? A comparison of actual and perceived driving risk.
Transportation
Released
research part f: Traffic psychology and behaviour 25(part A): 50–64. https://doi.org/10.1016/j.trf.2014.05.003; S Turner, J Khoo & J England
(2014) How drivers judge the safety of the road. In
Proceedings of the 2014 Australasian road safety research, policing & education
conference. Melbourne, Australia. http://acrs.org.au/files/arsrpe/full-paper_2117.pdf
8 For a summary of these surveys, see New Zealand Police (2020)
Speed evidence review. Wellington: National Road Policing Centre.
9 RF Job & C Brodie (2022) Understanding the role of speeding and speed in serious crash trauma: A case study of New Zealand.
Journal of
road safety 33(1): 5–25. https://doi.org/10.33492/JRS-D-21-00069
15
4. Drivers are less inclined to stop and give way when they are travelling at higher speeds
due to increased braking and then the acceleration afterwards required to return to
their original speed. Research shows a linear relationship between driver approach
speed and failing to yield to pedestrians at an unsignalised pedestrian crossing: at
32km/h,10 75 percent of drivers yield to pedestrians, but with an increase in speed of
just 16km/h, only 40 percent of drivers yield.11
5. At night, even moderate speed in a moderately lit urban environment can mean the
vehicle is travelling at a speed that results in combined judgement, reaction time and
1982
stopping distance that make it impossible to stop within the distance illuminated by the
headlights. A crash with a pedestrian or hazard on the road may be unavoidable by the
Act
time the risk is visible unless speeds are lower.12
6. At a higher speed, the driver is less able to manoeuvre and stay in control of the vehicle
to get around a problem and avoid a crash than at a lower speed.
7. At a higher speed, the vehicle is less able to negotiate a curve or corner than at a lower
speed without the driver losing control and running off the road or crossing to the
wrong side of the road, risking a head-on crash. This is not a rare form of head-on crash
on rural roads, with international studies of head-on crashes showing curves are
associated with more head-on crashes than straight sections of road13 and head-on
crashes are mostly
not associated with overtaking (which is involved in less than
Information
8 percent of head-on crashes even on rural roads), with these crashes more commonly
caused by driving too fast for the conditions.14 The figure is similar for New Zealand with
only 7 percent of head-on fatal and serious injury crashes involving overtaking.15
8. Based on the topography of the road, higher speeds reduce the time from when a risk
becomes visible to the driver to when evasive action is required. For example, the speed
Official
limit may be low because of curves limiting vision for intersections or junctions just
beyond the curve. Therefore, the speed limit is set to allow enough time for entering or
crossing vehicles (or pedestrians) to do so safely (that is, in the time they have before a
the
vehicle that is just out of view behind the curve would reach them) and enough time for
a vehicle travelling along the road with the curve to see, judge and stop. However, a
speeding vehicle can reach the intersection too quickly, causing a crash. The same logic
applies to other road features such as crests of hills that limit vision ahead.
under
10 We have converted research findings in miles per hour (mph) to kilometres per hour (km/h) throughout this paper. In the research, these
numbers were 20mph and a 10mph increase.
11 T Bertulis & DM Dulaski (2014) Driver approach speed and its impact on driver yielding to pedestrian behaviour at unsignalized
crosswalks.
Transportation research record 2464(1): 46–51.
12 For example, see RH Grzebieta (2019) Safe speed limits, Trauma Week 2019 symposium
Pedestrians: Staying safe, Royal Australasian
College Surgeons, 13 February, Melbourne, Australia. www.surgeons.org/-/media/Project/RACS/surgeons-org/files/trauma-verification/17-
r-grzebieta-safe-speed-limits.pdf?rev=be72114dc4ef45689dc3ffa5ede40052&hash=3994BB422E7973A805FBA4C7C061D479
Released
13 M Hosseinpour, AS Yahaya & AF Sadullah (2014) Exploring the effects of roadway characteristics on the frequency and severity of head-
on crashes: Case studies from Malaysian Federal Roads.
Accident analysis & prevention 62: 209–222.
14 P Gårder (2006) Segment characteristics and severity of head-on crashes on two-lane rural highways in Maine.
Accident analysis &
prevention 38(4): 652–661.
15 Waka Kotahi NZ Transport Agency (2011)
High-risk rural roads guide. Wellington: Waka Kotahi NZ Transport Agency.
www.nzta.govt.nz/resources/high-risk-rural-roads-guide/
16
9. Even if an approaching vehicle is in view, other road users may reasonably expect it to
take a certain time to reach them at the prevailing speed limit allowing them time to
cross, yet a speeding vehicle may reach them sooner. This is especially true for older
pedestrians who tend to (mis)judge a safe crossing gap by the distance to the
approaching vehicle more than the speed of the vehicle.16
Factors by which speed contributes to crash severity
Speed contributes to crash severity in four main ways:
1982
1. The higher the speed, the higher the energy, so the greater the forces in a crash. Higher
speeds deliver exponentially more energy into the crash than lower speeds.17 For Act
example, when impact speed increases from 30km/h to 50km/h (a 67 percent increase),
the energy increases 178 percent.
2. Safety features such as crash barriers are designed, located and built to provide
protection up to the speed limit,18 but may become ineffective if hit at speeds over the
limit. Thus, as speed increases, road safety features such as crash barriers, median strips
and impact attenuators19 that are designed to manage crash forces or prevent the
vehicle from being in a more severe crash (for example, from going over a cliff or into
oncoming traffic) are less effective. It is no simple matter to build all barriers, median
strips and so on to withstand high speeds: the cost of doing so may reduce the funds
Information
available for other road safety work or installation may not be possible within the space
available on many roads.
3. As speed increases, active vehicle safety features such as autonomous braking are less
able to stop the vehicle in time to avoid a crash or to reduce speed to safer levels of
impact by the time the impact occurs.
Official
4. As speed increases, the passive protective features of vehicles are increasingly likely to
fail in a crash: the integrity of the vehicle body may fail, leaving little survival room and
crushing the occupants, and restraint systems (that is, airbags and seat belts) may be
the
unable to minimise higher levels of force sufficiently to avoid severe injury or death.
under
16 RFS Job, J Haynes, T Prabhakar, SHV Lee & J Quach (1998) Pedestrians at traffic light controlled intersections: Crossing behaviour in the
elderly and non-elderly. In K Smith, BG Aitken & RH Grzebieta (eds),
Proceedings of the Conference on Pedestrian Safety (pp 3–11).
Canberra: Australian College of Road Safety & Federal Office of Road Safety.
Released
17 IIHS (2021)
Speed. Insurance Institute for Highway Safety. www.iihs.org/topics/speed
18 Waka Kotahi NZ Transport Agency (2021) Appendix A: Permanent road safety hardware & devices. Wellington: Waka Kotahi NZ Transport
Agency. www.nzta.govt.nz/assets/resources/road-safety-barrier-systems/docs/m23-road-safety-barrier-systems-appendix-a.pdf
19 Impact attenuators (such as crash cushions, and barrier end treatments) are designed to absorb the colliding vehicle's kinetic energy to
reduce crash severity.
17
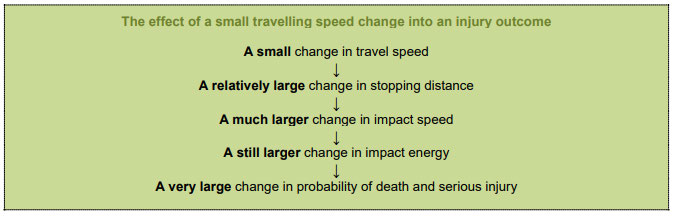 Summary – consequences of a change in travelling speed
The consequences of several of the above factors are highlighted in an Austroads report and
summarised in figure 1.20
1982
Act
Figure 1 – Consequences for injury of a small change in travel speed. Source: Austroads (2018).
2.1.2 Types of evidence that provide the strongest proof of the importance of
speed in crash risk
With all of the above factors adding to risk as speed increases, it is hardly surprising that the
scientific evidence shows speed to have a profound role in road crashes, especially in serious
Information
crashes. There are many hundreds of scientific studies of the effects of speed on road safety,
and many syntheses and analyses that combine results from many studies (combined
analyses are often called meta-analyses). Combined analyses select research studies for their
scientific thoroughness and combine the data from those studies to produce the most
representative real-world evidence. Official
Three types of evidence provide the strongest proof of the importance of speed in crash risk:
detailed analyses of crash impact speeds, scientific studies of the effects of changing the
average speed of travel, and evaluations of different speed-reducing interventions. These
the
are described next.
Detailed analyses of crash impact speeds
The first type of evidence is from detailed analyses of crash impact speeds21 and
consequences in real-world crashes. Many studies and several combined analyses of the
under
probability of death for different impact speeds have been undertaken. These all show a
dramatic effect of impact speed on severity. For example, the most recent combined
analysis for pedestrian crashes found that
each 1km increase in impact speed produced an
11 percent increase in the likelihood of a pedestrian death and a 7 percent increase of
serious injury.22
Released
20 Austroads (2018)
Towards safe system infrastructure: A compendium of current knowledge (research report AP-R560-18). Sydney:
Austroads.
21
Impact speed refers to the speed of the vehicle (relative to the person or object struck) at the instant of collision.
22 Q Hussain, H Feng, R Grzebieta, T Brijs & J Olivier (2019) The relationship between impact speed and the probability of pedestrian fatality
during a vehicle-pedestrian crash: A systematic review and meta-analysis.
Accident analysis & prevention 129: 241–249.
18
Broad relationships have been observed in these studies, which indicate that the likelihood
of death for different impact speeds and crash types increases exponentially above speeds
that are relatively low in relation to New Zealand’s default speed limits. The common crash
types analysed are typically pedestrian crashes, crashes into rigid objects, side-impact
crashes and head-on crashes.23, 24 The most recent analyses (from 2016 and 2019) have
similar findings and indicate that the speeds of impact at which more than 10 percent of
pedestrians will die are those above 30km/h.25 Other studies have shown that the speeds at
which more than 10 percent of pedestrians will be seriously injured are even lower than
1982
30km/h, from around 20km/h.26
Scientific studies of the effects of changing the average speed of travel
Act
The second type of evidence comes from many scientific studies of the effects of changing
the average speed of travel (not impact speeds) on the number of deaths, injuries and
crashes that occur. Combined analyses of the best scientific studies allow more reliable
identification of the speed–safety relationships across a large range of speeds and countries.
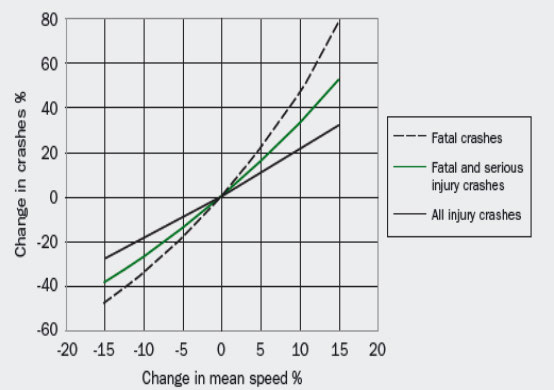
Figure 2 shows the relationship between changes in speed and fatal, serious injury and
all injury crashes, based on combined analyses of international studies.27 More recent
re-analyses validate these fundamental influences of speed on safety.28, 29, 30, 31 Changes in
speed have even greater impacts on higher severity crash outcomes with very small changes
Information
in speed having dramatic impacts on average fatal occurrence:
each 1 percent decrease in
speed yields about a 4 percent decrease in fatal crashes.
Official
the
23 WHO (2008)
Speed management: A road safety manual for decision makers. Geneva, Switzerland: World Health Organization & Global
Road Safety Partnership.
under
24 OECD (2006)
Speed management (report of the Transport Research Centre). Paris: OECD and European Conference of Ministers of
Transport. http://documents1.worldbank.org/curated/en/298381607502750479/pdf/Road-Crash-Trauma-Climate-Change-Pollution-and-
the-Total-Costs-of-Speed-Six-graphs-that-tell-the-story.pdf
25 Q Hussain, H Feng, R Grzebieta, T Brijs & J Olivier (2019) The relationship between impact speed and the probability of pedestrian fatality
during a vehicle-pedestrian crash: A systematic review and meta-analysis.
Accident analysis & prevention 129: 241–249.
26 C Jurewicz, A Sobhani, J Woolley, J Dutschke & B Corben (2016) Exploration of vehicle impact speed: Injury severity relationships for
application in safer road design.
Transportation research procedia 14: 4247–4256.
27 G Nilsson (2004)
Traffic safety dimension and the Power Model to describe the effect of speed on Safety. Sweden: Lund Institute of
Technology.
28 R Elvik, A Høye, T Vaa & M Sørensen (eds) (2009)
The handbook of road safety measures. Bingley, UK: Emerald Group.
Released
29 R Elvik (2010) A restatement of the case for speed limits.
Transport policy 17(3): 196–204. https://doi.org/10.1016/j.tranpol.2009.12.006
30 R Elvik (2013) A re-parameterisation of the power model of the relationship between the speed of traffic and the number of accidents
and accident victims.
Accident analysis & prevention 50: 854–860.
31 R Elvik, A Vadeby, T Hels & I van Shagen (2019) Updated estimates of the relationship between speed and road safety at the aggregate
and individual levels.
Accident analysis & prevention 123: 114–122.
19
1982
Act
Figure 2 – Relationship between changes in speed, fatal, fatal and serious injury, and all injury
crashes. Source: Nilsson (2004).
These speed–fatality risk relationships have led to internationally accepted Safe System
Information
survivable speed thresholds, which are described in section 3 (Safe System and speed), in
particular table 2 (target Safe System speed by road type).
There are two reasons why the graph for impact speed with pedestrians indicates an even
more powerful effect of speed than the graph for average speed and fatal crashes:
• Average speeds are not the same as crash impact speeds because the driver may (or
Official
may not) manage to slow down before the crash occurs, so more factors are involved
(such as inattention or impairment) to complicate the relationships with crash risk.
•
the
While differences or changes in average speeds are a good guide to crash risk (for the
same road and usage conditions), these averages are made up of various speeds that
can influence crash risk differently.
under
Released
20
Evaluations of different speed-reducing interventions
The third type of evidence comes from evaluations of different speed-reducing
interventions. These evaluations show the importance of speed by illustrating that the many
different ways to reduce speeds (safety cameras, road engineering such as speed humps or
gateway treatments,32 and vehicle-based technologies such as speed limiting or intelligent
speed adaptation) all deliver impressive reductions in serious crashes. Individual studies and
scientific reviews of the results show powerful benefits.33, 34, 35
1982
Studies of this type have also been undertaken in New Zealand, and they too show the
importance of speed. Four New Zealand examples are as follows.
• Example 1: An evaluation of gateway treatments designed to slow traffic entering urban
Act
areas found a 23% reduction in serious outcome crashes due to the gateways.36
• Example 2: An evaluation of the impact of adding covert (not visibly marked) mobile
safety cameras to existing enforcement measures found an area-wide 1.6 percent net
reduction in speed produced a net 19 percent reduction in casualties (injuries and
deaths). At camera enforcement locations, a 3.2 percent net reduction in speed resulted
in a 29 percent reduction in casualties.37
• Example 3: Traffic-activated variable speed limit signs that reduced the speed limit at 10
intersections were implemented. Traffic on side roads joining main roads was
Information
electronically detected on approach, and the variable speed limit signs on the main road
were activated to reduce the speed limit to 70km/h. An evaluation found this
intervention reduced speeds by around 7–9km/h on average with a dramatic reduction
in crash trauma: net fatal and serious injury crashes reduced by 79 percent and total
crashes by 51 percent compared with crashes at untreated control locations.38
Official
• Example 4:
Many changes in speed limits have also occurred, which present natural
experiments in the importance of speed limits. A detailed evaluation of two substantial
changes considered the changes in speed as well as changes in deaths and injuries. This
the
evaluation also controlled for other changes in safety policy that applied across all roads
under
32
Gateway treatments are signs combined with other measures (such as physical or painted lane narrowing, raised platforms or rumble
strips) to create a highly visible threshold (or “gateway”) between high and low speed environments.
33 B Turner, S Job & S Mitra (2021)
Guide for road safety interventions: Evidence of what works and what does not work. Washington, DC:
World Bank. www.roadsafetyfacility.org/publications/guide-road-safety-interventions-evidence-what-works-and-what-does-not-work
34 C Wilson, C Willis, JK Hendrikz, R Le Brocque & N Bellamy (2010) Speed cameras for the prevention of road traffic injuries and deaths.
Cochrane database of systematic reviews (11): CD004607. https://doi.org/10.1002/14651858.CD004607.pub4
35 UNECE (2021) UN vehicle regulation will increase road safety thanks to “Black-box” collecting information on crashes (press release,
15 October). United Nations Economic Commission for Europe. https://unece.org/media/press/361071
Released
36 T Makwasha & B Turner (2013) Evaluating the use of rural-urban gateway treatments in New Zealand.
Journal of the Australasian College
of Road Safety 24(4): 14–20.
37 MD Keall, LJ Povey & WJ Frith (2001) The relative effectiveness of a hidden versus a visible speed camera programme.
Accident analysis
& prevention 33
: 277–284. www.sciencedirect.com/science/journal/00014575
38 H Mackie, C Brodie, R Scott, L Hirsch, F Tate, M Russell & K Holst (2017) The signs they are a-changin’: Development and evaluation of
New Zealand's rural intersection active warning system.
Journal of the Australasian College of Road Safety 28(3): 11–21.
21
in New Zealand, by using urban areas where speed limits were not changed as the
control group.39 The evaluation found the following:40
o The large national increase in speed limits in 1985 from 80km/h to 100km/h was
accompanied by a notable increase in fatalities and injuries on rural roads
compared with urban roads.
o The broad reduction in the rural speed limit (from 55mph (88km/h) and in some
cases 60mph (97km/h) to 50mph (80km/h)) to save fuel in response to an oil crisis
1982
in 1973 was accompanied by a notable reduction in fatalities and injuries on rural
roads compared with urban roads.
Because examples 2 and 3 (as well as 4, although it is older) included measures of changes in
Act
speed as well as changes in serious crashes, they allow us to assess the power of speed
reductions in New Zealand. These examples all found reductions in deaths and injuries that,
for the measured changes in speeds, were larger than predicted from the global research.
Thus, if New Zealand differs from other countries in relation to the importance of speed, it is
that speed is even more important for safety in New Zealand than elsewhere.
Two possible explanations exist for the greater sensitivity to speed in New Zealand. First,
New Zealand has a slightly older vehicle fleet than other countries in which most research is
conducted.41 Second, New Zealand has challenging typography with many narrow, curved
Information
roads with unforgiving roadsides that may make crashes more likely to be severe, so a
speeding crash that would be survivable in another country is not survivable in New Zealand.
2.1.3 Why speeding is so important to safety in New Zealand
New Zealand’s crash data identify speeding as a factor in only about 30 percent of crashes,
Official
which we know to be an underestimate. Even at 30 percent, a huge cost is incurred, with
many hundreds of New Zealanders killed and many more seriously injured each decade.
New Zealand Police agrees that 30 percent is likely an underestimate because in many
the
crashes police cannot determine whether speeding was involved. This determination is
extremely difficult. Imagine arriving at the scene of a pedestrian fatality, where the driver is
the only person who knows what happened. That driver may not admit they were speeding
and may blame the pedestrian by claiming they rushed out and the driver did not have time
under
to stop. Unless there are skid marks or witnesses, determining whether the crash involved
speeding is difficult. The same is true for single vehicle run-off road crashes on rural roads
and many other crashes.
39 This is an important control and quite likely means the resulting estimate of the impacts of speed changes on serious crashes is
conservative, because some associated policies would have benefited urban safety more than rural safety such as car-free days, which
were also introduced to manage the oil crisis (but regarded as largely unsuccessful and abandoned less than a year later). See
Released
J Polkinghorne (2014) New Zealand and the 1970s oil shocks: More than just “carless days”. Greater Auckland (3 January).
www.greaterauckland.org.nz/2014/01/03/new-zealand-and-the-1970s-oil-shocks/
40 G Koorey & WB Frith (2017) Changing rural speed limits: Learning from the past. IPENZ Transportation Group Conference, Hamilton,
29–31 March.
41 RF Job & C Brodie (2022) Understanding the role of speeding and speed in serious crash trauma: A case study of New Zealand.
Journal of
road safety 33(1): 5–25. https://doi.org/10.33492/JRS-D-21-00069
22
Fortunately, there is a scientific way to adjust for the likely number of missing speeding-
involved fatal crashes. Overseas studies have compared police estimates of speeding
involvement with better evidence to determine the real involvement of speeding. This
better evidence comes from in-depth crash investigations, crash reconstructions and
modern vehicle event recorder systems (the equivalent of a flight recorder “black box”). If
these “correction” factors are applied to New Zealand data, speeding is more likely to be
involved in around 60 percent of fatal crashes in New Zealand,42 which means that for the
decade 2011 to 2020 around 1920 people died in speeding-related crashes in New Zealand.
1982
2.1.4 Lower speed limits improve road safety even if not all drivers obey them
Act
Lowering speed limits saves lives and reduces injuries. While some drivers speed, most
New Zealand drivers generally try to adhere to speed limits. On-road speed surveys in
New Zealand show most speeds are at or below the speed limit43 and evaluations of speed
limit reductions in New Zealand show that speeds and serious crashes are reduced (see
details below).
Even drivers who speed tend to be influenced by limits, in particular those who sometimes
drive several kilometres per hour above the limit. Even just a few kilometres per hour above
the limit is speeding and adds to serious crash risk. But lowering speed limits lowers the
speeds of this type of speeder as well. (The evidence on the effects of speed management
Information
on this type of speeding is considered in 4.4.)
The evidence for the safety benefits of lowering speed limits is irrefutable: if drivers slow
down, large safety benefits are delivered. Evaluations show strong safety improvements in
Australia, for example.44, 45, 46, 47 As an example of the importance of speed limits, in the US
an increase of 8km/h (5mph) in the maximum state speed limit led to 33,000 more deaths in
Official
crashes during 1995 to 2013,48 and this would be many thousands more since 2013.
The evidence is also strong in New Zealand, as three examples (covering many locations)
the
show. First, before and after evaluations of speed limit reductions in Auckland from 50km/h
to 40km/h or 30km/h and from 100km/h to 80km/h both showed significant reductions in
deaths.49
under
42 RF Job & C Brodie (2022) Understanding the role of speeding and speed in serious crash trauma: A case study of New Zealand.
Journal of
road safety 33(1): 5–25. https://doi.org/10.33492/JRS-D-21-00069
43 Ministry of Transport (2015)
Speed Survey Results 2015. Wellington: Ministry of Transport
www.transport.govt.nz/assets/Uploads/Report/Speed-survey-results-2015.pdf
44 Y Bhatnagar, D Saffron, M De Roos & A Graham (2010) Changes to speed limits and crash outcome: Great Western Highway case study.
In
Proceedings of the Australasian road safety research, policing and education conference (vol 14). Monash University.
45 CM Kloeden, JE Woolley & AJ McLean (2007) A follow-up evaluation of the 50km/h default urban speed limit in South Australia. In
Proceedings of the Road Safety Research, Education and Policing conference,
Melbourne, Australia, 17–19 October.
46 J Mackenzie, T Hutchinson & C Kloeden (2015) Reduction of speed limit from 110 km/h to 100 km/h on certain roads in South Australia:
Released
A follow up evaluation (CASR report 115). Centre for Automotive Research, University of Adelaide.
47 J Sliogeris (1992)
110 kilometre per hour speed limit: Evaluation of road safety effects. Victoria, Australia: VicRoads.
48 CM Farmer (2017) Relationship of traffic fatality rates to maximum state speed limits.
Traffic injury prevention 18(4): 375–380.
49 Abley (2022)
Safe Speeds phase 1: 24 month interim evaluation. Auckland: Abley. https://at.govt.nz/media/1990901/aukland-transport-
report-24-month-safe-speeds-tranche-1-monitoring.pdf
23
Second, an evaluation of the changes in fatal and injury crashes at three locations where
speed limits were reduced compared these locations with control locations where speed
limits remained the same. This evaluation found clear and significant reductions in travel
speeds and in serious crashes at the sections with reduced speed limits compared with the
control sections.50
Third, the evaluation described above of traffic-activated reduced speed limits at
intersections in New Zealand resulted in reduced speeds, 79 percent fewer deaths and
1982
51 percent fewer crashes.51
2.2
Effects of managing speed on the economy and other critical
Act
public health and global policy issues
This section identifies:
• lower speeds typically improve the economy (2.2.1)
• time lost through lower speed driving is overestimated (2.2.2)
• lower speed limits can help with fuel efficiency and reduce air pollution (2.2.3)
• lower speeds can help with congestion (2.2.4)
• why, if speed is so important to road safety, Germany’s road safety record is good
Information
despite some unlimited speeds on its federal motorway system (2.2.5).
2.2.1 Lower speeds typically improve the economy
New Zealanders do not sacrifice human life for economic gain in other spheres, yet we set
speed limits that mean a momentary lapse of focus or a misjudgement can be paid for with
death or serious injury.52
Official
Even if we were to accept that road deaths associated with faster speeds is a cost for
economic gain, there is no evidence such a gain exists. Higher speeds cause many hidden
the
costs, yet commentaries on speed tend to focus on travel time as the sole economic factor.
Lower speeds save many costs and the sole focus on travel time is profoundly misleading.
The hidden savings of lower speed include reducing the high economic cost of crashes and
trauma (on top of grief, pain and suffering), reducing vehicle maintenance costs, reducing
fuel use, and reducing the following three significant harmful effects on health.
under
First, lower speeds generate less road noise, and noise (especially road noise) is directly
linked to a large array of life and health effects: reduced life quality, more stress, less
effective sleep, impaired learning in children, hypertension, cardiovascular disease, diabetes
50 F Tate (2022)
The impact of change in speed limit at three sites (project 5-C4024.00). New Zealand: WSP.
Released
51 H Mackie, C Brodie, R Scott, L Hirsch, F Tate, M Russell & K Holst (2017) The signs they are a-changin’: Development and evaluation of
New Zealand’s rural intersection active warning system.
Journal of the Australasian College of Road Safety 28(3): 11–21. The authors
conclude that these safety gains are larger than expected based on the speed reductions. This may indicate some other mechanism of
improvement on top of the speed reductions, although there is no evidence for this. The large reductions may also reflect a heightened
importance of speed reductions at intersections.
52 People make mistakes, so we should calibrate the speed limit to the risk of the road to stop unnecessary deaths and serious injuries.
24
and death.53 A 2022 study found that children exposed to more environmental noise had a
smaller brain cortex than other children.54
Second, higher speeds produce more air pollution, which causes many harmful effects on
health, including decreased lung function, cardiovascular disease, increased use of health
care services and death.55
The harmful health effects, including death, of noise and air pollution are documented and
recognised by the World Health Organization.56
1982
Third, higher speeds create a barrier to people using active transport in cities, contributing
to the obesity and cardiovascular disease epidemics through reduced walking and increased
pollution from more vehicle motors. All these effects generate huge costs for New Zealand
Act
(noting that some are not readily separated from other costs for analysis).
Finally, higher speeds generate more greenhouse gas emissions, contributing to climate
change. For New Zealand, domestic transport is the largest single source of greenhouse gas
emissions, contributing 48 percent of total carbon dioxide (CO2) emissions and even more of
nitrous emissions. Energy production contributes only 16 percent of greenhouse gas
emissions in New Zealand. New Zealand has committed to reducing greenhouse gas
emissions by 50 percent by 2030. This cannot be achieved without greatly reducing
emissions from domestic transport, and the timeframe is not sufficient to achieve this by
Information
changing the vehicle fleet.
Studies reveal that economically ideal speeds are lower than prevailing speed limits and still
sacrifice human life for economic gains.57
Official
53 For example: W Babisch (2006) Transportation noise and cardiovascular risk: Updated review and synthesis of epidemiological studies
indicate that the evidence has increased.
Noise and health 8(30): 1; T Bodin, M Albin, J Ardö, E Stroh, PO Östergren & J Björk (2009) Road
traffic noise and hypertension: Results from a cross-sectional public health survey in southern Sweden.
Environmental health 8(1): 1–10;
C Clark, H Sbihi, L Tamburic, M Brauer, LD Frank, & HW Davies (2017) Association of long-term exposure to transportation noise and traffic-
the
related air pollution with the incidence of diabetes: A prospective cohort study.
Environmental health perspectives 125(8): 087025;
MM Haines, SA Stansfeld, RFS Job, B Berglund & J Head, J (2001) A follow-up study of the effects of chronic aircraft noise exposure on child
stress responses and cognition.
International journal of epidemiology 30: 839–845; MM Haines, SA Stansfeld, RFS Job, B Berglund, & J Head
(2001) Chronic aircraft noise exposure, stress responses mental health and cognitive performance in school children.
Psychological
medicine 31: 265–277; RFS Job (1988) Community response to noise: A review of factors influencing the relationship between noise
exposure and reaction.
Journal of the Acoustical Society of America 83: 991–1001; RFS Job (1996) The influence of subjective reactions to
noise on health effects of the noise.
Environment international 22: 93–104; M Klatte, K Bergström & T Lachmann (2013) Does noise affect
under
learning? A short review on noise effects on cognitive performance in children.
Frontiers in psychology 4: 578; T Münzel, M Sørensen &
A Daiber (2021) Transportation noise pollution and cardiovascular disease.
Nature reviews cardiology 18(9): 619–636; S Ohlwein, F Hennig,
S Lucht, C Matthiessen, N Pundt, S Moebus, K-H Jöckel & B Hoffmann (2019) Indoor and outdoor road traffic noise and incident diabetes
mellitus: Results from a longitudinal German cohort study.
Environmental epidemiology 3(1).
54 KR Simon, EC Merz, X He & KG Noble (2022) Environmental noise, brain structure, and language development in children.
Brain and
Language 229
: 105–112. https://doi.org/10.1016/j.bandl.2022.105112
55 JO Anderson, JG Thundiyil & A Stolbach (2012) Clearing the air: A review of the effects of particulate matter air pollution on human
health.
Journal of medical toxicology 8(2): 166–175; CA Pope III, N Coleman, ZA Pond, & RT Burnett (2020) Fine particulate air pollution and
human mortality: 25+ years of cohort studies.
Environmental research 183: 108924.
56 WHO (2011)
Burden of disease from environmental noise: Quantification of healthy life years lost in Europe. Geneva, Switzerland: World
Released
Health Organization. Regional Office for Europe; MP Neira (2019) Air pollution and human health: A comment from the World Health
Organization.
Annals of global health 85(1).
57 MD Hosseinlou, SA Kheyrabadi & A Zolfaghari (2015) Determining optimal speed limits in traffic networks.
International Association of
Traffic and Safety Sciences 39(1): 36–41; M Cameron (2003)
Potential benefits and costs of speed changes on rural roads (report CR216).
Victoria, Australia: Monash University Accident Research Centre; M Cameron (2012) Optimum speeds on rural roads based on “willingness
to pay” values of road trauma.
Journal of the Australasian College of Road Safety 23(3): 67–74.
25
1982
Act
Information
Official
the
under
Released
2.2.2 Time lost through lower speed driving is overestimated
It is easy to overestimate the effects of lower speed limits on travel time. For example, if I
travel for 10km on 60km/h speed limit roads and these change to 50km/h limits, I might
estimate the extra time by simply calculating the difference in time travelling continuously at
50km/h and travelling continuously at 60km/h, which would be 2 minutes. However, for
most such journeys this is unrealistic. In reality, during the journey we will slow and stop for
lights or stop signs, slow down to give way, be slowed by other cars and trucks often in lines 1982
of traffic stopped or slowed at intersections, slow down for turns at intersections, give way
to pedestrians at crossings and so on. Thus, we will spend quite a bit of our time travelling at
speeds below 50km/h regardless of the speed limit, so for all that time, the speed limit will
Act
make no difference to our travel time. The practical change in travel time for most such
journeys is small.59
For the effects of lower speeds on congestion, see 2.2.4.
2.2.3 Lower speed limits can help with fuel efficiency and reduce air pollution
Ideal speeds for fuel consumption in cars are determined in rigorously smooth and steady
speed driving conditions – not real-world conditions. These “ideal” speeds may give some
guide to the best speed for fuel consumption on long, flat, even roads with no other traffic
Information
causing slowing and accelerating. However, in cities with stop–start and slow-then-
accelerate traffic, ideal speeds are very different. Often the difference between a 50km/h
and a 30km/h limit is only the speed to which the car accelerates before quite soon
afterwards slowing or stopping for the next intersection, line of traffic or pedestrian
crossing. Accelerating up to 50km/h instead of 30km/h before slowing or stopping again
saves little, if any, time, but costs fuel and wear and tear on brakes, as well as producing
Official
more noise and air pollution. Thus, lowering urban speed limits from 50km/h to 30km/h
reduced emissions by 25%,60 and analyses show that many lives would be saved through
the
reduced air pollution if urban speeds are lowered to 32km/h (20mph) in addition to savings
of crash deaths and serious injuries.61
2.2.4 Lower speeds can help with congestion
Many people assume a decrease in the speed limit will worsen traffic congestion.62 The
under
reality is quite different: it either has little impact or it reduces the extent of congestion. To
59 C Jurewicz (2010)
Impact of lower speed limits for road safety on network operations (No. AP-T143/10). Melbourne: Austroads.
60 M Madireddy, B De Coensel, A Can, B Degraeuwe, B Beusen, I De Vlieger & D Botteldooren (2011). Assessment of the impact of speed
limit reduction and traffic signal coordination on vehicle emissions using an integrated approach.
Transportation research part D: transport
and environment 16(7): 504–508.
61 SJ Jones & H Brunt (2017) Twenty miles per hour speed limits: A sustainable solution to public health problems in Wales.
Journal of
Released
Epidemiology and Community Health 71(7), 699–706.
62 This is acknowledged in the media sometimes with helpful information to counter this view; for example, in
The Guardian – A Jha (2005)
How do speed cameras cause traffic jams?
The Guardian (17 March).
www.theguardian.com/science/2005/mar/17/thisweekssciencequestions2 – and in
The Conversation – R Llewellyn (2018) Increasing the
speed limit won’t get traffic moving faster.
The Conversation (6 October). https://theconversation.com/increasing-the-speed-limit-wont-
get-traffic-moving-faster-104365
27
see what happens, we consider two situations: the speed limit is above the speed of the
traffic (that is, there may be congestion) and the speed limit is equal to the traffic speed.
If the speed limit is higher than the traffic speed, lowering it makes no material difference
to congestion
If the speed of the traffic is below the old and the new (reduced) speed limit (likely caused
by congestion), then lowering the speed limit makes no material difference to travel speed.
For example, if the traffic speed in a congested area is 25km/h, then changing the speed
1982
limit from 50km/h to 30km/h will not reduce the congestion nor will it make the congestion
worse.
Act
The question then becomes, what is the point of lowering the speed limit? There are two
reasons. First, in congestion, drivers may accelerate up to the speed limit before stopping at
the next point of congestion or joining a slow-moving line of traffic. No or very little time is
saved, but the higher the maximum speed, the greater acceleration and the more braking
required, which all add to crash risk and severity, as well as noise pollution, air pollution and
greenhouse gas emissions. Second, further benefits of lower maximum speeds arise from
better management of speed at the times of day when the roads are not congested.
If the speed limit is the same as the traffic speed, either more vehicles will get through a
Information
congestion point if speeds are lower or there will be very little effect
If the speed limit is at or below the traffic speed (which means the area is not particularly
congested), then the complex relationship between speed and vehicle throughput becomes
relevant for changes in speed. At low levels, as speeds increase, the traffic flow initially
improves slightly but with further increases in speed, the reverse effect occurs – the traffic
Official
flow through a specific location (such as an intersection) reduces.
The reason for this is as follows. Advice on driving gaps says at 30km/h a vehicle should leave
the
2 seconds to the car in front, at 40–50km/h 3 seconds, and at higher speeds 4 seconds. This
means that at an intersection with traffic travelling at 30km/h one vehicle gets through the
intersection every 2 seconds, at 50km/h one vehicle gets through every 3 seconds, and at
higher speeds one vehicle gets through every 4 seconds. Therefore, more vehicles get
through this congestion point if speeds are lower. This matters, because for trips in urban
under
areas, the primary generators of congestion are intersections, traffic queues, and braking for
cornering and turning.63
The evidence supports the above commentary. Figure 3 shows the relationship between
speed and traffic flow. It shows that, in the range of the speed limit changes New Zealand is
undertaking (reduction to 30km/h or higher), there are quite small reductions in traffic flow
with lower speeds or traffic flow is improved with lower speeds.
Released
63 J Archer, N Fotheringham, M Symmons & B Corben (2008)
The impact of lowered speed limits in urban and metropolitan areas (report
276). Monash University Accident Research Centre. www.monash.edu.au/miri/research/reports/muarc276.pdf
28
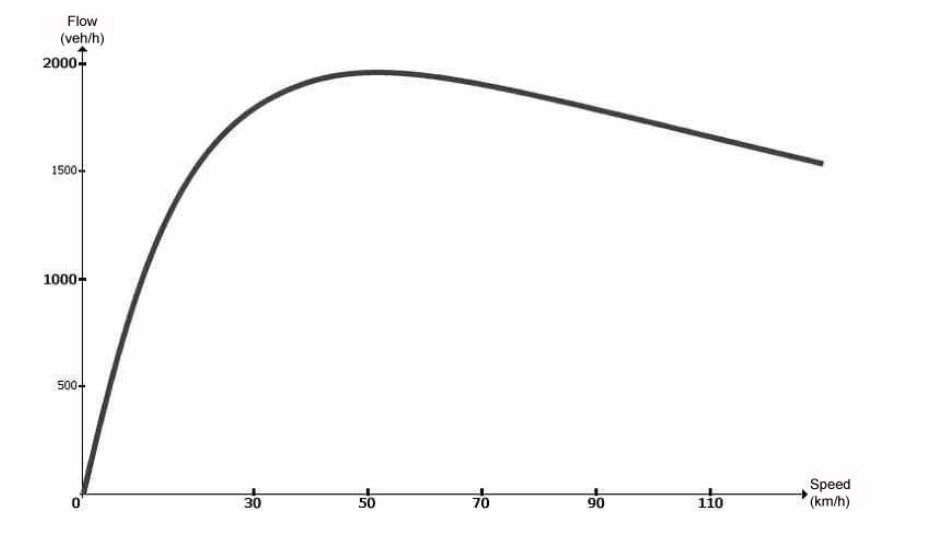
The relationship between speed and traffic flow means decreasing speeds does not
necessarily increase congestion and can improve congestion.64
1982
Act
Figure 3 – Curve relating speed and traffic flow. Source: OECD (2006).
Information
2.2.5 Case study: Speed management on German motorways
Germany is often seen as an example of road safety success without managing speed. This is
misleading. Germany uses many speed management techniques, including speed limits, on
its motorways, although it is famous for having no speed limit.
Official
The federal motorway system in Germany is called the
Bundesautobahn. Autobahnen (motorways) are built to very high safety standards. Although at one time all of Germany’s
motorways famously had no speed limit, speed management is now a vital part of
the
Germany’s road safety approach and a key reason for Germany’s road safety improvements.
German authorities reacted to the number of serious crashes and deaths occurring on its
motorways by putting speed limits on almost half of them. In addition, Germany has over
4600 speed cameras, a low enforcement tolerance with 3km/h over the speed limit being a
under
punishable offence, and 50km/h maximum urban speed limits65 with 30km/h limits in many
city centres and residential areas.66
64 OECD (2006)
Speed management (report of the Transport Research Centre) Paris: OECD and European Conference of Ministers of
Released
Transport. http://documents1.worldbank.org/curated/en/298381607502750479/pdf/Road-Crash-Trauma-Climate-Change-Pollution-and-
the-Total-Costs-of-Speed-Six-graphs-that-tell-the-story.pdf
65 WHO (2018)
Global status report on road safety. Geneva, Switzerland: World Health Organization.
66 ETSC (2015) Germany unblocks 30km/h zones. European Transport Safety Council (17 April). https://etsc.eu/germany-unblocks-30kmh-
zones/#:~:text=Germany's percent20Federal percent20Transport percent20Minister percent20Alexander,to percent20implement percent2
030km percent2Fh percent20zones.
29
However, the country is still significantly behind the road safety records of the best-
performing countries in Europe (Sweden, The Netherlands and Norway) that have speed
limits on all of their streets and roads, including motorways. Due to extreme speeds, despite
being the best engineered roads in Europe, Germany’s motorways are less safe than those of
similar countries in Europe, with the motorways of the UK, Switzerland, Denmark,
The Netherlands, Ireland and France all having better safety records.67
1982
Act
Information
Official
the
under
Released
67 ETSC (2008)
German Autobahn: The speed limit debate (speed factsheet 01-08). Brussels: European transport Safety Council.
https://etsc.eu/wp-content/uploads/Speed_Fact_Sheet_1.pdf
30
3
Safe System and speed
New Zealand adopted Safe System principles in its Safer Journeys national road safety
strategy68 and further refined the approach and added targets under the Road to Zero
national strategy.69 Fatalities occur, not just because of driver error, but because the system
is unforgiving (for example, speed limits too high for the prevailing environment or possible
crash types).
A Safe System approach recognises that people make mistakes. It reduces the price paid for 1982
a mistake, so crashes don’t result in death or serious injury. Mistakes are inevitable – deaths
and serious injuries from road crashes are not.
Act
3.1
Safe System principles
A Safe System recognises that people, speeds, vehicles and road infrastructure must interact
in a way that ensures everyone’s safety. People should not, and do not need to, die or be
seriously injured for the sake of mobility.
Therefore, a Safe System:70
• accepts that people make mistakes and protects road users from a mistake resulting in
death or serious injury
Information
• manages speeds, roads and vehicles to limit crash forces to levels that are survivable for
the human body
• motivates governments and people who design and maintain roads, manufacture
vehicles, and administer safety programmes to accept and address shared responsibility
for safety and to stop blaming road users for system inadequacies
Official
• adheres to the underlying premise that the transport system should not compromise
safety for the sake of factors such as cost or faster travel times.
the
Safe System principles guide interventions towards an ultimate goal of eliminating road
crash deaths and injuries. They also emphasise the many elements of the system that must
be improved rather than continuing the (broadly failing) focus of the last 80 years of just
improving road users. As the current national road safety strategy, Road to Zero, notes:71
We must also turn our attention to fixing a transport system that fails to
under
protect people – by improving our road network, tackling unsafe speeds
and lifting the safety of our vehicle fleet.
68 New Zealand Government (2010)
Safer Journeys: New Zealand’s road safety strategy 2010–2020. Wellington: Ministry of Transport.
69 New Zealand Government (2019)
Road to Zero: New Zealand’s road safety strategy 2020–2030. Wellington: New Zealand Government.
www.transport.govt.nz//assets/Uploads/Report/Road-to-Zero-strategy_final.pdf
Released
70 This description is based on WHO & United Nations Regional Commissions (2021)
Global plan: Decade of action for road safety 2021–
2030. Geneva, Switzerland: World Health Organization. But it also adopts the position on shared responsibility recently advanced as more
internally consistent with the safety system. See RFS Job, J Truong & C Sakashita (2022) The ultimate safe system: Redefining the Safe
System approach for road safety.
Sustainability 14(5): 2978. https://doi.org/10.3390/su14052978
71 New Zealand Government (2019)
Road to Zero: New Zealand’s road safety strategy 2020–2030. Wellington: New Zealand Government,
p 15. www.transport.govt.nz//assets/Uploads/Report/Road-to-Zero-strategy_final.pdf
31
To be consistent with the principles, a Safe System must accommodate human error rather
rely on errors not occurring. Only on this basis can the system deliver on the vision of zero
deaths and serious injuries in road crashes. Thus, the ultimate Safe System is a system “in
which road users cannot be killed or seriously injured regardless of their behaviour or the
behaviour of other road users”.72 However, in the absence of such a system, improving road
user behaviour continues to save many lives and injuries.
3.2
Safe System speeds – 20–30km/h for the safety of vulnerable
1982
road users
The speed–fatality risk relationships for average speed and impact speed (described in 2.1.2)
Act
have led to internationally accepted Safe System speeds. These speeds are supported in
many global guidance documents for road safety, including those by the World Health
Organization,73 International Red Cross,74 United Nations,75 International Transport Forum of
the OECD76 and Global Road Safety Facility of the World Bank.77 Most recently, the Academic
Expert Group for the third global ministerial conference on road safety also explicitly
recommended Safe System speed limits, especially the adoption of 30km/h for the safety of
vulnerable road users,78 and the World Bank assessed 30km/h zones for pedestrians as a
“highly effective” intervention.79
Safe System speeds from the International Transport Forum are in table 2.80 These speeds
Information
are based on the evidence described earlier on death and injury risk related to travel speed
and impact speed, but they are a compromise to the need for mobility, so are higher than
the speeds required to achieve zero deaths and serious injuries. First, these speeds are set at
Official
72 RFS Job, J Truong & C Sakashita (2022) The ultimate Safe System: Redefining the Safe System approach for road safety.
Sustainability 14(5): 2978. https://doi.org/10.3390/su14052978
73 GRSP & WHO (2008)
Speed management: A road safety manual for decision makers and practitioners. Geneva, Switzerland: World Health
Organization & Global Road Safety Partnership.
the
74 GRSP & WHO (2008)
Speed management: A road safety manual for decision makers and practitioners. Geneva, Switzerland: World Health
Organization & Global Road Safety Partnership; GRSF (World Bank) & GRSP (International Red Cross & Red Crescent Society) (2020)
Guide
for determining readiness for speed cameras and other automated enforcement. Geneva, Switzerland: Global Road Safety Facility & Global
Road Safety Partnership.
75 WHO & United Nations Regional Commissions (2021)
Global plan: Decade of action for road safety 2021–2030. Geneva, Switzerland:
World Health Organization.
under
76 ITF (2022)
The Safe System approach in action. Paris, France: International Transport Forum, OECD; OECD. (2006)
Speed management
(report of the Transport Research Centre). Paris, France: OECD and European Conference of Ministers of Transport.
http://documents1.worldbank.org/curated/en/298381607502750479/pdf/Road-Crash-Trauma-Climate-Change-Pollution-and-the-Total-
Costs-of-Speed-Six-graphs-that-tell-the-story.pdf
77 B Turner, S Job & S Mitra (2021)
Guide for road safety interventions: Evidence of what works and what does not work. Washington, DC:
World Bank. www.roadsafetyfacility.org/publications/guide-road-safety-interventions-evidence-what-works-and-what-does-not-work;
RFS Job & LW Mbugua (2020)
Road crash trauma, climate change, pollution and the total costs of speed: Six graphs that tell the story (GRSF
note 2020.1). Washington, DC: Global Road Safety Facility, World Bank.
http://documents1.worldbank.org/curated/en/298381607502750479/pdf/Road-Crash-Trauma-Climate-Change-Pollution-and-the-Total-
Costs-of-Speed-Six-graphs-that-tell-the-story.pdf
Released
78 C Tingvall & the Academic Expert Group (2021)
Saving lives beyond 2020
: The next steps (recommendations of the Academic Expert
Group for the third global ministerial conference on road safety). Stockholm: Swedish Transport Administration.
79 B Turner, S Job & S Mitra (2021)
Guide for road safety interventions: Evidence of what works and what does not work. Washington, DC:
World Bank. www.roadsafetyfacility.org/publications/guide-road-safety-interventions-evidence-what-works-and-what-does-not-work
80 ITF (2016)
Zero road deaths and serious injuries: Leading a paradigm shift to a safe system. Paris: International Transport Forum, OECD.
http://dx.doi.org/10.1787/9789282108055-en
32
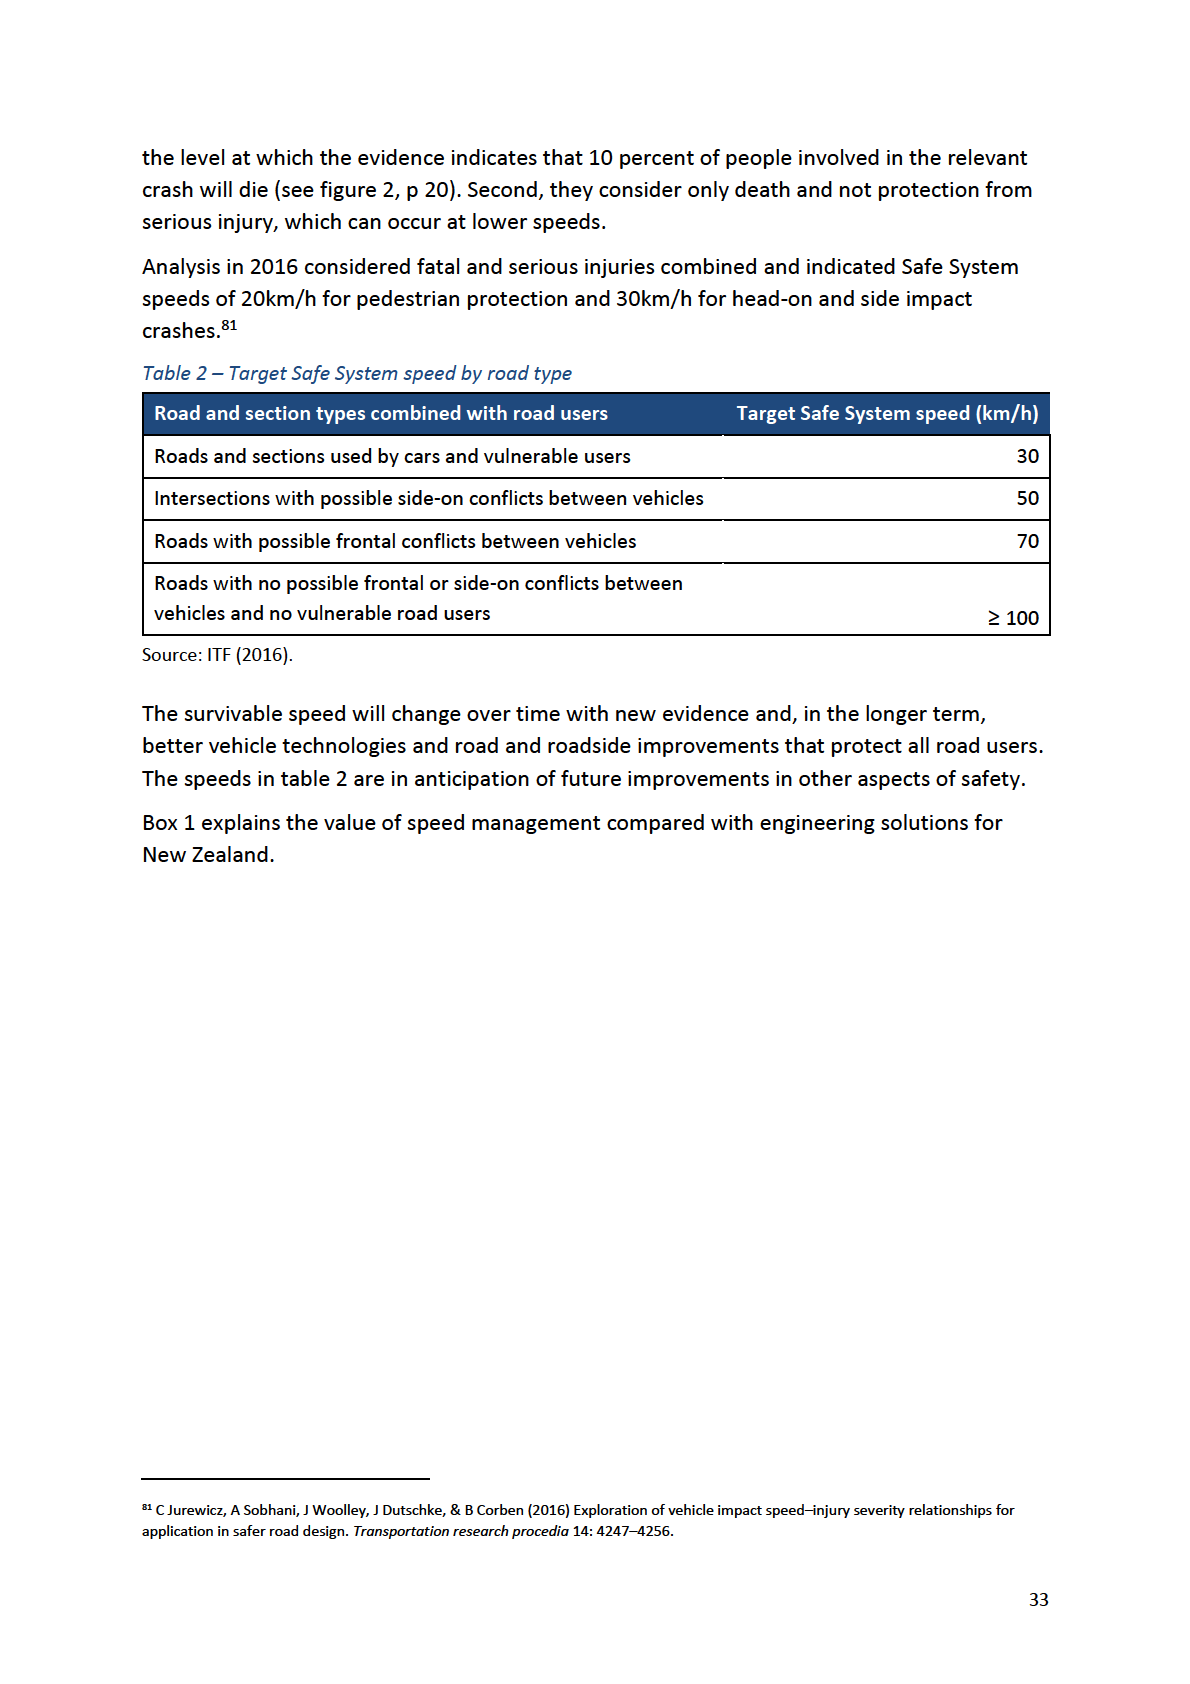
1982
Act
Information
Official
the
under
Released
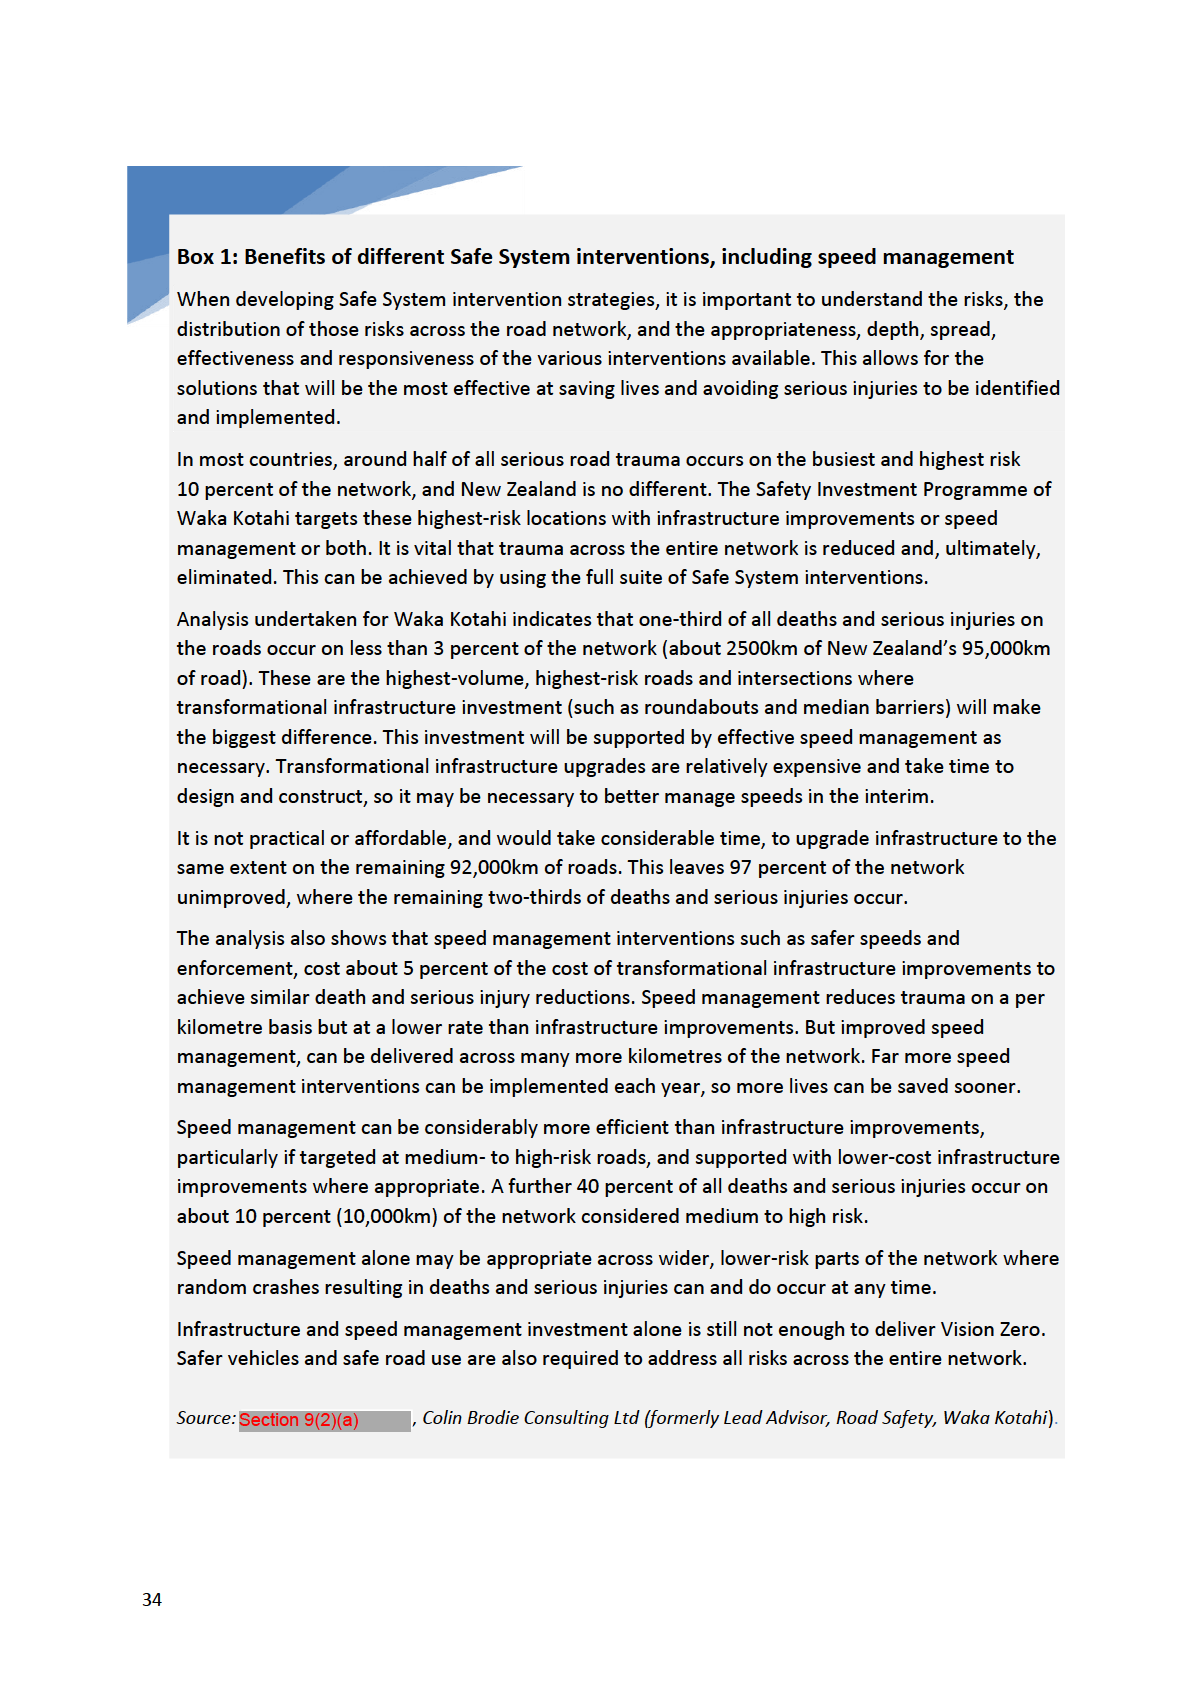
1982
Act
Information
Official
the
under
Released
To save lives and serious injuries, speed limits must increasingly consider Safe System speeds
– speeds that are based on scientifically robust findings about human behaviour and human
tolerance of physical force. It is no longer acceptable to set speed limits based on the speed
85 percent of drivers choose to travel at. In New Zealand, this approach and the increase in
speeds, particularly from 80km/h to 100km/h in 1985, have left a legacy of speeds limits that
are unsafe for the conditions, so produce high death and injury rates.82 The International
Transport Forum’s 2016 Safe System report identified New Zealand and Australian rural
speed limits as examples of unsafe speed limits, particularly with topographical challenges
1982
compounding the lack of safety in New Zealand, and compared New Zealand and Australia
speed limits with the lower 70km/h or 80km/h limits in countries with much better road
safety performance.83
Act
An example of inadequate speed limit setting in rural settings is where high speeds are
allowed on narrow, low-standard roads with an unstable gravel shoulder as the only
recovery space between the vehicle and endless lines of roadside trees, utility poles,
drainage channels and myriad other hazards. In countries such as The Netherlands and
Sweden, the default speed limit in these rural environments is 70km/h or 80km/h. In
New Zealand and Australia, the default rural speed limit is 100km/h regardless of road and
roadside conditions. When a vehicle leaves the roadway at this speed, the impact forces
with unforgiving roadside objects are well in excess of a person’s biomechanical
Information
tolerances.84
Official
the
under
Released
82 G Koorey & WB Frith (2017) Changing rural speed limits: Learning from the past. IPENZ Transportation Group Conference, Hamilton,
29–31 March.
83 ITF (2016)
Zero road deaths and serious injuries: Leading a paradigm shift to a safe system. Paris: International Transport Forum, OECD.
http://dx.doi.org/10.1787/9789282108055-en
84 ITF (2016)
Zero road deaths and serious injuries: Leading a paradigm shift to a safe system. Paris: International Transport Forum, OECD,
p 109. http://dx.doi.org/10.1787/9789282108055-en
35
4
Promotion of speed and psychological mistakes we all
make – the evidence
Everyone uses the roads, but people are not deeply informed about road safety because it
has developed into a strongly scientific and technical discipline. Many in the community base
their views on personal experience not scientific evidence. People often mistrust and
disbelieve the evidence (which amount to many people’s experiences turned into numbers) 1982
that does not align with their individual experiences.
This mistrust and disbelief are common to many aspects of risk judgement and is not a
simple matter to change. This section explores common views that are inconsistent with the
Act
evidence and how people arrive at these views.
This section covers:
• how people came to believe speed is safe and good for them (4.1)
• the continuing risk of high speeds despite driving skills and safety improvements (4.2)
• reducing speed is critical for road safety – it’s not a ploy to raise revenue from
enforcement (4.3)
• the importance of targeting people who speed by small amounts (4.4)
Information
• advice to the road safety community (4.5)
• why people think that because they speed without having a serious crash, the evidence
about speed and speeding must be wrong (4.6)
• speed management is not the only way to reduce speed and speeding -- it’s one tool in
the toolbox (4.7)
Official
• why evidence from other countries often applies in New Zealand (4.8)
• most road deaths and serious injuries are of local people (4.9).
the
4.1
How people came to believe speed is safe and good for them
Many believe higher speed road travel is good for the economy,85 so good for people, saving
time with almost no other cost, and that travelling at speed is fun. It can seem inconsistent
that road safety practitioners want to reduce travel speeds to keep people safe – after all,
under
each of us is still here despite travelling at (or above) existing speed limits, with the many
who are killed through speeding not around to tell their story. There seems to be no reason
to slow people’s journeys. How did society come to this inaccurate view about speed? The
answer lies with the development and promotion of the motor vehicle and the motor racing
industry and the unrealistic depiction of speed in movies, television, games and online.
Released
85 This mistake is even the basis of policy by politicians (for example, R Llewellyn (2018) Increasing the speed limit won’t get traffic moving
faster.
The Conversation (6 October). https://theconversation.com/increasing-the-speed-limit-wont-get-traffic-moving-faster-104365
36
4.1.1 Impact of the motor racing industry
Before cars and motorcycles achieved high speeds, travel was at the speed of a trotting or,
albeit rarely, galloping horse. Horses typically trot at around 13km/h.86 The car industry
stepped in to change this: falsely promoting the value and safety of speed and escalating
motor racing events to promote the glamor of high speed and the value of driving skill in
keeping us safe.
A master stroke of public messaging was the phrase, “The nut behind the wheel”, which
1982
appeared in poems and other printed and promotional materials from the 1920s on. The nut
behind the wheel, the problem causing crashes, was the driver, and the message was
couched in engineering terms to emphasise that the problem was not the car or its speed
Act
but the person driving. This has been combined with massive commitment to and promotion
of motor racing through Formula 1, stock cars, rally driving and motorcycle racing. There is a
lot to learn from motor racing that has real value for road safety. However, as explained
below, road safety is not about driving skill or safety at speed, even though racing and rally
drivers and navigators have a great deal of skill.
The motor racing industry does aim to protect its drivers and others involved as well as to
promote the sport, and it has done so largely effectively although the level of safety the
sport has achieved is often overestimated (as described below).
Information
The industry contributes significantly to road safety through the UK FIA Foundation,87 which
funds road safety programmes and runs the major motor racing programmes, including
Formula 1 Grand Prix. The United Nations Special Envoy for Road Safety appointed in 2015
was also the FIA president.
However, many car manufacturers continue to actively promote speed as fun, sexy and
Official
desirable in their car advertising. In New Zealand, examples abound, including connecting
cars with motor racing such as the Toyota advertisement, “Finding New Zealand’s next world
the
champion”, which depicts high-risk driving at a speed excessive for the conditions (a utility is
shown fully airborne on a dirt road),88 or a promotional description of a car that emphasises
performance, sports technologies, power and connection with the racetrack:89
The all-new Ford Fiesta ST is the most responsive, engaging and fun-to-
drive Fiesta ST ever, featuring a range of sports technologies that enhance
under
power and performance, cornering and agility, and versatility for scenarios
from the school run to race track.
In addition, the views people hold about risk in road use are strongly supported by the
deeper systematic psychological mistakes people make when judging risk, as described in
4.6.
Released
86 Deep Hollow Ranch (2021) How fast can a horse run? (Top & average speed). www.deephollowranch.com/horse-speed
87 www.fiafoundation.org
88 Driven (2020) Watch: What’s the best car ad?
Driven (27 November). www.driven.co.nz/news/watch-what-s-the-best-car-ad/
89 Ford (2019) The Ford Fiesta ST: Latest reviews. (23 October). www.faganford.co.nz/news/details/303/the-ford-fiesta-st-latest-reviews
37
4.1.2 Depiction of speed in movies, television, games and online
Another major influencer of our perceptions of speed and risk comes from the thousands of
occasions in which speed is depicted in movies, television, games and online. At some level,
people know these depictions are not realistic; it’s part of the fun of getting into the story’s
adventure with the character by accepting the premise of the story and the action involved.
If people don’t do this, thinking the story unreal or absurd, the magic of entertainment is
lost. In addition, sometimes the story and action do seem real and possible. Thus, we are
1982
shown and “accept” the following misleading ideas:
• It is possible with skill to travel at high speed without crashing. The popularity of such
depictions is evident in the many
Fast & Furious movies, the central role of the sports
Act
car (or motorcycle) in the James Bond series, and the pervasiveness of car chase scenes
in police shows and crime thrillers.
• More skilled drivers are less likely to crash than less skilled drivers: In most car chases
the good guys win – their superior skill often allows them to not crash while the bad
guys crash.
• Macho heroes and aspirational characters like to and can drive fast, often performing
dramatic, extreme-risk stunts safely and impressing people.
• Heroes survive crashes even at high speeds and even when not wearing a seatbelt. Not
Information
only do they survive, but they can be uninjured, out of the car in a split second, and
chasing down the bad guys on foot.
4.1.3 Consequences of the message that travelling at high speed can be done
safely
Official
Overall, through entertainment and advertising, people are bombarded with messages
about the safety of high speed and the role of skill in making high-speed driving safe. Is it any
wonder that the messages about speeding from road safety experts, with much less airtime,
the
do not have the same level of influence?
The above, sometimes inadvertent and sometimes deliberate, activities have given three
important wrong impressions.
First, they appear to prove the value of car-handling skills in road safety, which we accept as
under
self-evident.
Second, they make travelling at high speed seem fun and possible to do safely.
Third, they have shifted our thinking away from speed being responsible for fatal and serious
crashes to humans being responsible. This is so, even though speed delivers energy into the
crashes into hard objects or other cars, pedestrians, cyclists or motorcyclists, making them
fatal or severe crashes.
Released
The importance of these mistaken impressions is supported by evidence, which shows that
people exposed to more media and images that encourage speeding are more likely to
38
speed.90 People inevitably make mistakes. Speed compounds mistakes and adds to the
severity of consequences.
The evidence for each of the three mistaken impressions is discussed next (in 4.2 to 4.4),
because of the profound influence they have had on road safety.
4.2
Continuing risk of high speeds despite driving skills and safety
improvements
1982
4.2.1 Increasing driver skill increases driver confidence, increasing risk taking
A study showed that, on public roads, more skilled drivers have more crashes. The crash
Act
records (on public roads) of racing and rally drivers were compared with the average for all
drivers. Racing and rally drivers were found to have more crashes than average drivers.91
This finding surprises many of us (because of our mistaken belief in car-handling skills as
critical to safety), yet it is consistent with the extensive body of scientific evidence on the
limited value of car-handling skills for road safety (discussed in 5.2).
As background to understanding the above evidence, it is helpful to understand that risk-
taking by road users is a motivation problem. Whether people take risks when driving is
influenced by whether they think they can “get away with it” (that is, not crash, be fined or
Information
lose their licence) and the perceived value (“risk utility”) of taking the risk.92 (This is also a
broad human characteristic in risk taking generally.93) Supporting this finding are
New Zealand studies that show driver perceptions of risk and their reasons for driving
(motivation) are important predictors of their speed preferences.94 Increasing driver skill has
the effect of increasing the driver’s confidence in being able to travel faster without
crashing, so commonly increases risk taking (see 5.2). Therefore, more skilled drivers take
Official
more risks.
the
90 KB Stefanidis, V Truelove, M Nicolls & J Freeman (2022) Perceptions matter: Speeding behaviour varies as a function of increasing
perceived exposure to content encouraging the behaviour.
Traffic injury prevention 1–6.
91 WA Tillman & GE Hobbs (1949) The accident-prone automobile driver.
American journal of psychiatry 106: 321–331. A more recent
formal study could not be found, although crashes by famous Formula 1 race car drivers reported in the media suggest the problem
under
continues. These include a crash by Lewis Hamilton while still an active F1 driver (D Johnson (2015) Lewis Hamilton: Heavy partying is to
blame for my Monte Carlo car crash.
The Telegraph (12 November).
www.telegraph.co.uk/sport/motorsport/formulaone/lewishamilton/11992509/Lewis-Hamilton-Heavy-partying-is-to-blame-for-my-Monte-
Carlo-car-crash.html) and fatal crashes by other drivers after leaving Formula 1 driving (A Henry (2006) Ferrari icon Clay Regazzoni dies in
car crash aged 67.
The Guardian (16 December). www.theguardian.com/sport/2006/dec/16/formulaone.gdnsport3; R Horton (1999)
Reflections on another age: Mike Hawthorn remembered.
Atlas Formula 1 journal. http://atlasf1.autosport.com/99/jan27/horton.html).
Other research confirms that expert police drivers show as much over-confidence in their own driving, comparing themselves with other
experts, as do normal drivers, comparing themselves with other normal drivers: AE Waylen, MS Horswill, JL Alexander & FP McKenna
(2004) Do expert drivers have a reduced illusion of superiority?
Transportation research part F: Traffic psychology and behaviour 7(4–5):
323–331.
Released
92 T Prabhakar, SHV Lee & RFS Job (1996) Risk taking, optimism bias and risk utility in young drivers. In L St John (ed),
Proceedings of the
road safety research and enforcement conference (pp 61–68). Sydney, NSW: Roads & Traffic Authority of NSW.
93 ND Weinstein (1988) The precaution adoption process.
Health psychology 7(4): 355–386.
94 LM Ahie, SG Charlton & NJ Starkey (2015) The role of preference in speed choice.
Transportation research part F: Traffic psychology and
behaviour 30: 66–73. https://doi.org/10.1016/j.trf.2015.02.007; SG Charlton & NJ Starkey (2017) Driving on urban roads: How we come to
expect the “correct” speed.
Accident analysis & prevention 108: 251–260. https://doi.org/10.1016/j.aap.2017.09.010
39
This does not mean that drivers should have no skills – basic skills are needed to drive safely.
However, the facts show that high levels of skill make safety worse. While we can all think of
scenarios in which more skill might help us avoid a crash, the evidence from large numbers
of cases tells us that these scenarios are not as common or important to overall road safety
as the extra confidence and risk-taking that is created by the higher levels of skill.
4.2.2 Continuing risk of high speeds despite improved safety features
If skill is not what is saving racing drivers, what is? For the short distances driven overall in
1982
motor racing, there are a lot of high-risk crashes, including fatal and serious injury crashes. In
addition, some crashes from which drivers can walk away in Formula 1 car racing would be
Act
fatal on an average road in an average car.95
The racing industry has done an extraordinary job in creating safety in a high-risk sport. One
important lesson is how much can be achieved by managing the safety aspects of the
system. In Formula 1 Grand Prix car racing, these system features are as follows:
• Cars: Formula 1 has steadily improved vehicle engineering to protect racing car drivers.
• Protective clothing: Drivers wear particularly effective protective clothing and helmets
and, since 2019, must also wear a neck brace.
• Vulnerable road users: School children are never and pedestrians are rarely crossing the
Information
race track. Where pedestrians have been on the track, such as marshals or drivers after
a crash, some deaths have occurred. There are also no cyclists and no mixing of
motorcycles and cars.
• Speed management: Pedestrians are in pit areas, so low speeds are required and
enforced. Even then, pedestrians have been injured in crashes in pit areas.
Official
• Managing the risk of secondary crashes: When an incident occurs in the race, a safety
car is deployed to slow speeds.
•
the
Exposure management: Races are allowed to last a maximum of 3 hours or drivers are
changed, and races may be shortened due to bad weather conditions. Only one person
is in each vehicle.
• Traffic management: There are no trucks, buses, train crossings and two-way traffic.
• Race track sides: The track is very different from a standard road: there are no
under
90 degree angle roads entering at intersections and there are wide clear zones or
effective cushions and crash barriers.
• Driver error management: Drivers are not impaired by alcohol or fatigued by many
hours of driving (races are limited to a maximum of 3 hours) or age and failing
eyesight.96
Released
95 For many examples from 2020 seasons, see the video compilation of crashes: Formula 1 (2021) The 10 most dramatic crashes of the 2020
F1 season.
YouTube. www.youtube.com/watch?v=ZGd9A2IhQeU
96 Even in high-speed rally car racing on public roads, many of the normal risks are eliminated: the car may have added structural
protection, drivers and navigators wear helmets as well as great seatbelts, and traffic and other road users are managed (school children
are not crossing the road, other traffic is not entering from side roads, and there are no cyclists, motorcyclists, trucks and oncoming traffic).
40
The lesson we should learn from the racing industry is the power of the system to protect
people – through traffic management, pedestrian protection through speed control or
prevented access, complete negation of head-on traffic, more protection in vehicle
engineering, and the value of safe roadsides. However, even all this (as well as the highly
skilled drivers in Formula 1) is not enough to save drivers from the extraordinary risks of very
high speeds and close quarter driving.
Continuous improvement in road, roadside and vehicle technologies for safety Formula 1
1982
can be expected to gradually and eventually lead to zero deaths over many decades of
racing.
4.3
Act
Reducing speed is critical for road safety – it’s not a ploy to raise
revenue from enforcement
The evidence briefly presented earlier shows that speed, and thus speed management, is
critical to road safety. The most credible road safety organisations agree that the evidence
overwhelmingly proves speed plays a major role in road safety and managing speed
powerfully improves road safety. These organisations include the:
• International Red Cross and Red Crescent Society, including its road safety arm, the
Global Road Safety Partnership
Information
• International Road Association (also known as the Permanent International Association
of Road Congresses)
• International Transport Forum of the OECD
• United Nations
• World Bank, including its road safety arm, the Global Road Safety Facility
Official
• World Health Organization.
In 2021, the Academic Expert Group for the third global ministerial conference on road
the
safety also supported strong speed management and a zero-tolerance approach to
speeding,97 and the International Transport Forum reported on the critical role of the Safe
System (which New Zealand has adopted) for improving road safety and the fundamental
role of speed management in delivering a Safe System.98
under
Enforcement using safety cameras (or speed cameras) does collect revenue for the Crown,
but more importantly these cameras save lives and prevent injuries. Scientific evaluations
across many countries support this. The extent of the safety benefits depends on many
factors, such as the size of the penalty, number of cameras, swiftness and unavoidability of
the penalty, and features of the processes for evaluating safety camera effects.99
Released
97 C Tingvall & the Academic Expert Group (2021)
Saving lives beyond 2020
: The next steps (recommendations of the Academic Expert
Group for the third global ministerial conference on road safety). Stockholm: Swedish Transport Administration.
98 ITF (2022)
The Safe System approach in action. Paris, France: International Transport Forum, OECD.
99 RFS Job (2022) Evaluations of speed camera interventions can deliver a wide range of outcomes: Causes and policy implications.
Sustainability 14(3): 1765. https://doi.org/10.3390/su14031765
41
A 2010 systematic review of the evidence from scientific studies using the best
methodologies concluded that, although more research is needed to establish the exact
level of benefit for various camera programmes, “the consistency of reported reductions in
speed and crash outcomes across all studies show that speed cameras are a worthwhile
intervention for reducing the number of road traffic injuries and deaths”.100 Many more
evaluations since then continue to show the safety benefits of fixed and mobile speed
cameras.101 In 2021, a World Bank assessment of evidence on safety interventions rated
speed cameras as “highly effective”.102
1982
Speed cameras have delivered powerful reductions in serious crashes in New Zealand as well
as showing the clear additional safety value of including covert mobile camera enforcement.
Act
The addition of covert mobile cameras to existing camera enforcement reduced speeding
broadly and produced a 19 percent reduction in casualties (injuries and deaths) across the
target road network. At enforcement locations, the effects were larger: a 3.2 percent net
reduction in speed, resulting in a 29 percent reduction in casualties (compared with
untreated locations).103 This New Zealand study (the only one of its type) not only shows the
importance of safety cameras but also the importance of a mix of visible and covert camera
enforcement.
4.4
Importance of also targeting people who speed by small amounts
Information
Low-level speeding adds significantly to serious crash (fatal or injury) risk. For example, at
40km/h in a 30km/h zone, the risk of a serious crash is elevated by over 80 percent
compared with the risk at the speed limit.104
Per driver, extreme speeding does create much more risk of a serious crash than low-level
speeding. Extreme speeding “appears” to be the main contributor for three reasons.
Official
First, extreme speeding crashes are more likely to be reported in the news because the
cause is (apparently) clear and the results are horrible and more dramatic for photos and
the
television coverage. Low-level speeding in even serious crashes often goes undetected, so is
not likely to be reported in the news.
Second, people notice extreme speeding and generally disapprove of it, branding the driver
as dangerous or stupid and someone who should be caught and stopped from driving.
under
100 C Wilson, C Willis, JK Hendrikz, R Le Brocque & N Bellamy (2010) Speed cameras for the prevention of road traffic injuries and deaths.
Cochrane database of systematic reviews (11): CD004607. https://doi.org/10.1002/14651858.CD004607.pub4
101 L Carnis & E Blais (2013) An assessment of the safety effects of the French speed camera program.
Accident analysis & prevention 51:
301–309; E De Pauw, S Daniels, T Brijs, E Hermans & G Wets (2014) An evaluation of the traffic safety effect of fixed speed cameras.
Safety
science 62: 168–174; A Høye (2015) Safety effects of fixed speed cameras: An empirical Bayes evaluation.
Accident analysis & prevention 82: 263–269; P Tankasem, T Satiennam, W Satiennam & P Klungboonkrong (2019) Automated speed control on urban arterial road: An
experience from Khon Kaen City, Thailand.
Transportation research interdisciplinary perspectives 1: 100032.
Released
102 B Turner, S Job & S Mitra (2021)
Guide for road safety interventions: Evidence of what works and what does not work. Washington, DC:
World Bank. www.roadsafetyfacility.org/publications/guide-road-safety-interventions-evidence-what-works-and-what-does-not-work
103 MD Keall, LJ Povey & WJ Frith (2001) The relative effectiveness of a hidden versus a visible speed camera programme.
Accident analysis
& prevention 33
: 277–284. www.sciencedirect.com/science/journal/00014575
104 Calculated by applying the classic Nilsson curve of risk: G Nilsson (2004)
Traffic safety dimension and the Power Model to describe the
effect of speed on safety. Sweden:
Lund Institute of Technology.
42
However, people often do not detect low-level speeding. Thus, we actively brand extreme
speeding as the main problem and the news seems to support this.
Finally, a focus on extreme speeding rather than low-level speeding has been contributed to
by many road safety messages (see 4.5 for details).
It is not viable to assess the role of low-level compared with high-level speeding by analysing
crash data because speeding is often missed as a factor and low-level speeding is more likely
to be missed.105 However, the science in road safety provides an objective picture. Low-level 1982
speeding contributes more to speeding deaths and injuries than does extreme speeding
because low-level speeding is so much more common, as demonstrated in New Zealand
speed surveys, which measure the speed of each vehicle in many locations.106
Act
Thus, concentrating on extreme speeding will address only a small but visible proportion of
the deadly speeding problem. The uncomfortable truth is that the speeding problem is
caused by many of us, and to address it we all need to actively aim to drive at or below the
speed limit all the time. The evidence shows that low-level speeding is contributing greatly
to speeding-related deaths and injuries. Thus, it is appropriate to deter all speeding to save
lives.
Speeding is significantly reduced by enforcement107 (including in New Zealand108) and speeds
are lowered by reducing speed limits. Enforcement and lower limits are both proven to save
Information
lives and reduce trauma. Some speeding, including extreme speeding, will continue,
indicating a need for more action.
Extreme speeding is more visible than low-level speeding, and when a crash occurs with
extreme speeding it is more likely to be covered in the media because the consequences are
more visually dramatic. However, we do have enough scientific evidence to determine the
Official
effects of enforcement on extreme speeding and on lower-level speeding, through detailed
records of exact speeds before and after the addition of speed cameras. Such analyses
indicate that speed cameras reduce extreme speeding even more than they reduce low-level
the
speeding.109 An evaluation of the benefits of adding covert mobile camera enforcement in
New Zealand found a similar pattern – extreme speeding was reduced more than the
average speed.110
under
105 RF Job & C Brodie (2022) Understanding the role of speeding and speed in serious crash trauma: A case study of New Zealand.
Journal of
road safety 33(1): 5–25. https://doi.org/10.33492/JRS-D-21-00069
106 Ministry of Transport (2015)
Speed Survey Results 2015. Wellington: Ministry of Transport
www.transport.govt.nz/assets/Uploads/Report/Speed-survey-results-2015.pdf
107 R Elvik (2012) Speed limits, enforcement, and health consequences.
Annual review of public health 33(1): 225–238.
https://doi.org/10.1146/annurev-publhealth-031811-124634
Released
108 LJ Povey, WJ Frith, & MD Keall (2003)
An investigation of the relationship between speed enforcement, vehicle speeds and injury crashes
in New Zealand. Wellington: Land Transport Safety Authority.
www.transportationgroup.nz/papers/2003/01_Povey_Keall_Frith.pdf
109 R Elvik (2019) A comprehensive and unified framework for analysing the effects on injuries of measures influencing speed.
Accident
analysis & prevention 125: 63–69.
110 MD Keall, LJ Povey & WJ Frith (2001) The relative effectiveness of a hidden versus a visible speed camera programme.
Accident analysis
& prevention 33
: 277–284. www.sciencedirect.com/science/journal/00014575
43
4.5
Advice to the road safety community
On the issues of low-level speeding and extreme speeding, many road safety messages are
misleading the community and media. The road safety community has helped to create the
misperception of the importance of extreme speeding and the acceptability of low-level
speeding. The approach must change to better reflect the scientific evidence.
Road safety advocates, including police, tend to identify extreme behaviours to justify road
safety actions (for example, using extreme speeding to justify speed enforcement). A case of 1982
a driver speeding at 100km/h in a 50km/h zone is likely to be noted to the media, but the
case of a driver caught at 60km/h in a 50km/h zone is not. The extreme speeder is
considered more newsworthy and a more acceptable target for community derision. Act
The systematic over-emphasis of extreme speeding causes many problems. It:
• encourages a misperception that extreme speeding is the speeding problem and
moderate speeding is not much of a safety issue
• normalises moderate speeding, making it seem acceptable, so a driver who speeds at
55km/h in a 50km/h zone may feel safe and normal in doing this, compared with their
negative feelings about a driver doing 100km/h in a 50km/h zone that they heard about
on the news
•
Information
increases the demand to focus enforcement on extreme speeders and let moderate
speeders (who kill more people) go unpunished.
There is no doubt that on a per occasion basis extreme speeding is more dangerous than
moderate speeding. However, low-level speeding is killing and injuring more people in
New Zealand than is extreme speeding, because low-level speeding is so common. A focus
Official
on extreme speeding may be politically acceptable, but leaves moderate speeding relatively
untouched. All speeding must be discouraged to deliver better safety outcomes for the
community. Thus, when justifying speed enforcement measures, the message should reduce
the
the normalisation of low-level speeding:
Our speed enforcement this week shows that most drivers are doing the
right thing – most drivers were not speeding, for which we are thankful.
Unfortunately, we still caught [number] drivers travelling above the speed
under
limit. Speeding is dangerous and will be penalised.
4.6
Why people think because they speed without having a serious
crash, the evidence about speed and speeding must be wrong
Humans are not good at judging the risk for events based on personal experience, which is
the way most people judge the risk of having a serious crash, unless they have scientific
evidence.
Released
When judging personal risk, humans have a set of deep psychological biases that affect our
judgement. These self-serving biases have been proven in scientific studies. One bias is over-
confidence in abilities and behaviours: most people believe they are better drivers than the
average. Large surveys in Australia revealed the majority of drivers thought they were better
44
than average, some thought they were around average and only 2 percent thought they
were worse than average.111 The same bias is found in other countries in which it has been
tested.112 People cannot mostly be better than average with so few people below average.
Somehow the population has to average out as, well, average.
In addition to over-confidence, humans over-estimate their ability to control outcomes
(“illusion of control”) and have an optimism bias about their future (expecting to have better
future lives than average for their peers with more good things and fewer bad things
1982
happening to them).113 People’s optimism about their future is sometimes referred to as the
“illusion of invulnerability” when it is about the risk of a bad thing happening such as causing
a serious road crash.
Act
Studies show New Zealanders share these same biases:114 over-confidence about driving
abilities and optimism bias about crash risk.115
Part of the problem creating these mistakes is that as individuals we only have data from
one individual (ourselves) compared with the power we can reach by combining data over
the crash experiences of many millions of drivers, as done in scientific studies. Even if we
drive long distances each year for many years, we would need to live for millions of years to
have enough personal experiences to judge the effects of speeding. For this reason, the
scientific evidence is a better guide to reality than our personal experiences.
Information
Despite this, people tend to judge risk in terms of “if it hasn’t happened to me yet, it won’t
happen in the future” and “I haven’t had a fatal crash yet, so I never will”. Because no one
has two fatal crashes in a lifetime, this apparent claim of safety would have applied to
everyone involved in a fatal crash until the second it happened. Things that have never
happened before do happen, and people can’t rely on personal experience to understand
Official
the risk of speed.
the
under
111 RFS Job (1990) The application of learning theory to driving confidence: The effect of age and the impact of random breath testing.
Accident analysis & prevention 22: 97–107.
112 O Svenson (1981) Are we all less risky and more skillful than our fellow drivers?
Acta Psychologica 47(2): 143–148.
www.sciencedirect.com/journal/acta-psychologica/vol/47/issue/2; BA Jonah (1986) Accident risk and risk-taking behaviour among young
drivers.
Accident analysis & prevention 18: 255−271.
113 FJ Chua & RFS Job (1999) Event-specific versus unitary causal accounts of optimism bias.
Journal of behavioural medicine 22: 457–491;
ND Weinstein (1984) Why it won't happen to me: Perceptions of risk factors and susceptibility.
Health psychology 3(5): 431–457;
ND Weinstein (1980) Unrealistic optimism about future life events.
Journal of personality and social psychology 39(5): 806–820.
Released
114 D Walton & K Smith (2009) Survival confidence of New Zealanders in outdoor and post-earthquake situations.
Australian journal of
emergency management 24(3): 38–43; HG Seaward & S Kemp (2000) Optimism bias and student debt.
New Zealand journal of psychology 29(1): 17–19.
115 D Walton & J Bathurst (1998) An exploration of the perceptions of the average driver’s speed compared to perceived driver safety and
driving skill.
Accident analysis & prevention 30(6): 821–830; N Harre & CG Sibley (2007) Explicit and implicit self-enhancement biases in
drivers and their relationship to driving violations and crash-risk optimism.
Accident analysis & prevention 39(6): 1155–1161.
45
4.7
Speed management is one tool in the toolbox
Managing speed is not the only way to improve safety. Road safety is being improved in
New Zealand in many ways, including through promotion, enforcement, vehicle safety
regulation and maintenance, and road safety design engineering improvements, as well as
emergency response and post-crash care.
Waka Kotahi and other agencies at various levels are working to improve road infrastructure
with barriers, safer designs for curves, safer designs for intersections, bicycle lanes and safer 1982
pedestrian facilities. These works take time and significant resources.
The path to achieving a safe road system must include speed management because speed is
Act
the most powerful contributor to crash forces. It is also the most cost-effective way to save
lives – more lives can be saved through speed management than with infrastructure for the
same budget.
4.8
Evidence from other countries often applies in New Zealand
New Zealand is unique in many ways. It has a particular combination of features and
challenges in relation to road safety, so a clear case exists for not simply assuming that all
actions that work overseas will work here. This is especially the case when considering the
right messages to encourage attitudinal change, which rely on an understanding of a
Information
population’s social values and beliefs. Thus, distinctiveness, local attitudes, beliefs and the
nature of the road transport system (which is influenced by New Zealand’s challenging
typography) must be considered when applying some aspects of speed management.
On the other hand, evidence from various countries has regularly been applied successfully
in New Zealand, including the successes of safety cameras, lower speed limits and speed-
Official
managing infrastructure.116 In addition, New Zealand studies confirm the vital role of speed
and speeding in serious crashes as well as life and injury saving successes in managing
speed.117
the
In terms of road safety, New Zealand has more in common with many countries than it has
differences. This is especially true for many elements of speed and severe crash risk. Most
importantly, the role of speed in road safety in New Zealand, universal laws of physics,
universal vulnerability of the human body to force, and similarity of human reaction times
under
116 B Turner, S Job & S Mitra. (2021)
Guide for road safety interventions: Evidence of what works and what does not work. Washington, DC:
World Bank. www.roadsafetyfacility.org/publications/guide-road-safety-interventions-evidence-what-works-and-what-does-not-work;
C Wilson, C Willis, JK Hendrikz, R Le Brocque & N Bellamy (2010) Speed cameras for the prevention of road traffic injuries and deaths.
Cochrane database of systematic reviews (11): CD004607. https://doi.org/10.1002/14651858.CD004607.pub4; A Delaney, H Ward,
M Cameron & AF Williams (2005) Controversies and speed cameras: Lessons learnt internationally.
Journal of public health policy 26(4):
404–415.
117 Accident Rehabilitation & Compensation Insurance Corporation & LTSA (2000)
Down with speed: A review of the literature and the
Released
impact of speed on New Zealanders. Wellington: Land Transport Safety Authority; MD Keall, LJ Povey & WJ Frith (2001) The relative
effectiveness of a hidden versus a visible speed camera programme.
Accident analysis & prevention 33
: 277–284.
www.sciencedirect.com/science/journal/00014575; T Makwasha & B Turner (2013) Evaluating the use of rural-urban gateway treatments
in New Zealand.
Journal of the Australasian College of Road Safety 24(4): 14–20; RF Job & C Brodie (2022) Understanding the role of
speeding and speed in serious crash trauma: A case study of New Zealand.
Journal of road safety 33(1): 5–25.
https://doi.org/10.33492/JRS-D-21-00069
46
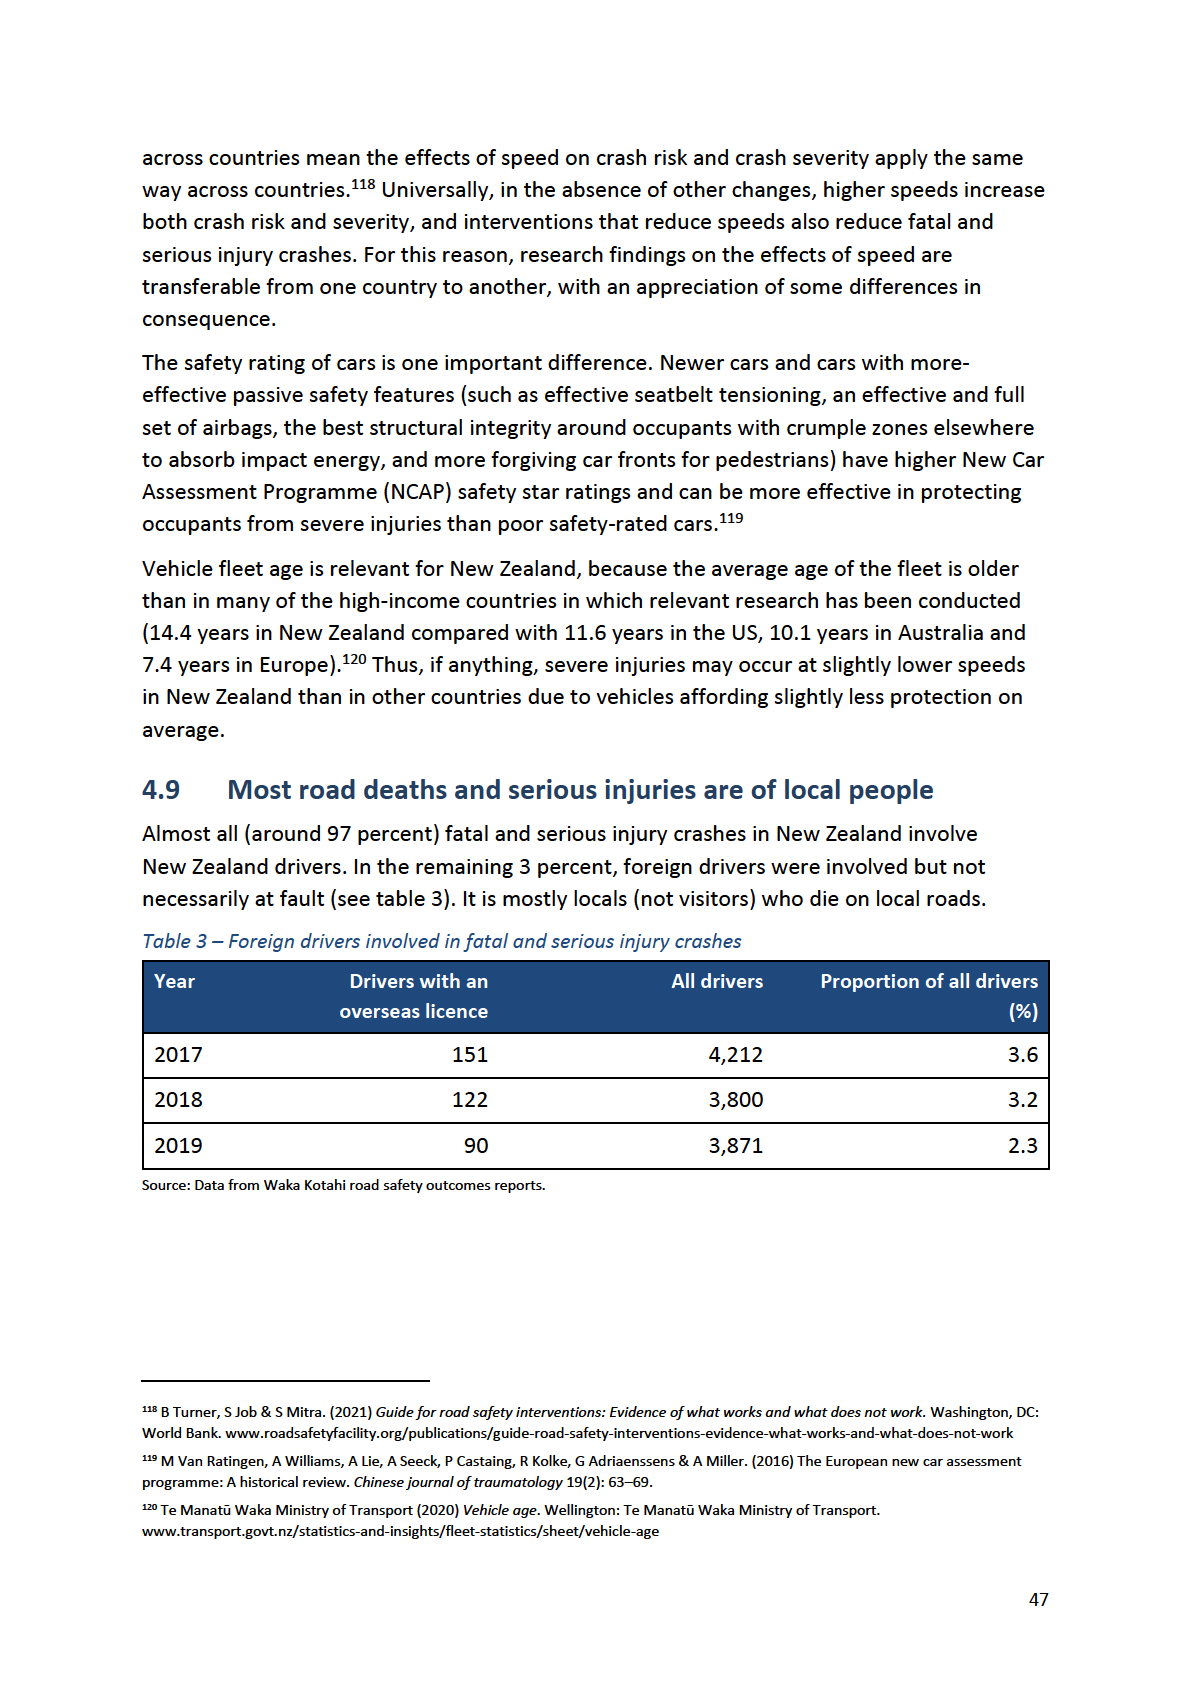
1982
Act
Information
Official
the
under
Released
5
Recap – actions that work and actions that do not
This section summarises the actions proven to work and not work to reduce deaths and
serious injuries from speed. In road safety, it is critical we choose actions demonstrated to
work so we do not waste time and resources on ineffective actions. Interventions based on
“gut instinct” rather than evidence may be popular, but they will not achieve desired results.
The six actions demonstrated to reduce deaths and serious injuries, especially in relation to
speed, and the three that do not are described in 5.1 and 5.2, respectively.
1982
5.1
Actions proven to reduce deaths and serious injuries
Act
Six actions are proven to reduce deaths and serious injuries, especially in relation to speed:
•
Lower speed limits – evaluations in New Zealand support international findings (see
2.1.4 and 4.6).
•
Speed enforcement, including safety (speed) cameras, with more safety gains from
covert cameras being added to visible cameras – evaluations in New Zealand support
international findings (see 2.1.2, 4.3 and 4.6).
•
General deterrence (through many actions that improve it such as effective unavoidable
penalties and promotion of enforcement) is a powerful motivator of behaviours and can
Information
be improved by maximising the chances that speeding behaviour is detected and
effectively punished.121
•
Graduated licensing systems where speed is addressed within the constraints placed on
novice drivers.122 In New South Wales, Australia, the introduction of a penalty for
provisional drivers of licence loss, instead of just a fine and demerit points, led to a
Official
34 percent reduction in speeding-related deaths involving these provisional drivers.123
the
under
121 B Turner, S Job & S Mitra (2021)
Guide for road safety interventions: Evidence of what works and what does not work. Washington, DC:
Released
World Bank. www.roadsafetyfacility.org/publications/guide-road-safety-interventions-evidence-what-works-and-what-does-not-work;
R Homel (1988)
Policing and punishing the drinking driver: A study of general and specific deterrence. New York: Springer-Verlag.
122 AF Williams, BC Tefft & JG Grabowski (2012) Graduated driver licensing research, 2010–present.
Journal of safety research 43(3): 195–
203; JT Shope (2007) Graduated driver licensing: Review of evaluation results since 2002.
Journal of safety research 38(2): 165–175.
123 C Sakashita & RFS Job (2015) Employing refined licensing conditions to reduce the serious crashes of young drivers.
Journal of local and
global health science 43.
48
• Many
road engineering measures reduce speeds and reduce serious crashes such as
speed humps, speed cushions, raised platform crossings and raised intersections, lane
narrowing, chicanes, gateway treatments and roundabouts.124
•
Vehicle technologies such as intelligent speed adaptation125 (especially as more than
just a warning to the driver), continuous speed monitoring and speed limiting.126
5.2
Actions not proven to reduce deaths and serious injuries
1982
It is vital we do not divert precious road safety resources into ineffective actions (even if
they are popular and accepted by the public) such as:
• car-handling skill-based driver training (see 5.2.1)
Act
• education, including school-based education and driver training (see 5.2.2)
• awareness raising that simply uses crash risk and severity as a deterrent (see 5.2.3).
5.2.1 Car handling skill-based driver training
Direct evidence exists that car-handling skill-based training does not improve road safety
(and often increases crash rates) and that such training increases driver over-confidence
(thus, risk taking).127 This does not mean all forms of driver training do not work (discussed
further below).
Information
The highly credible Cochrane Library has published methodologically rigorous reviews of the
evidence, which show no safety benefits from post-licence driver training. For example, a
review of post-licence driver training concludes:128
Official
the
124 RFS Job & LW Mbugua (2020)
Road crash trauma, climate change, pollution and the total costs of speed: Six graphs that tell the story (GRSF note 2020.1). Washington, DC: Global Road Safety Facility, World Bank.
http://documents1.worldbank.org/curated/en/298381607502750479/pdf/Road-Crash-Trauma-Climate-Change-Pollution-and-the-Total-
Costs-of-Speed-Six-graphs-that-tell-the-story.pdf; T Makwasha & B Turner. (2013) Evaluating the use of rural-urban gateway treatments
in New Zealand.
Journal of the Australasian College of Road Safety 24(4): 14–20; J Huang, P Liu, X Zhang, J Wan, & Z Li (2011) Evaluating
under
the speed reduction effectiveness of speed bump on local streets.
11th International Conference of Chinese Transportation Professionals
2348–2357. http://ascelibrary.org/doi/abs/10.1061/41186(421)234
125
Vehicle intelligent speed adaptation involves advanced vehicle technology systems to determine the speed limits applicable for the
vehicle in its current location to assist drivers to stick to the speed limit. Technology using a global navigation satellite system such as GPS is
linked to a speed zone database and thus allows the vehicle (or the mobile phone) to “know” its location and the speed limit on that road.
126 OMJ Carsten, M Fowkes, F Lai, K Chorlton, S Jamson, FN Tate & R Simpkin. (2008)
Intelligent speed adaptation: Final report to
Department for Transport. University of Leeds and MIRA Ltd.
127 For a brief review, see B Turner, S Job & S Mitra (2021)
Guide for road safety interventions: Evidence of what works and what does not
work. Washington, DC: World Bank. www.roadsafetyfacility.org/publications/guide-road-safety-interventions-evidence-what-works-and-
what-does-not-work; A Katila, E Keskinen, M Hatakka & S Laapotti (2004) Does increased confidence among novice drivers imply a
Released
decrease in safety? The effects of skid training on slippery road accidents.
Accident analysis & prevention 36(4): 543–550.
www.sciencedirect.com/science/journal/00014575; NP Gregersen (1996) Young drivers’ overestimation of their own skill: An experiment
on the relation between training strategy and skill.
Accident analysis & prevention 28(2): 243–250; B Jones (1995) The effectiveness of skid-
car training for teenage novice drivers in Oregon.
The Chronicle of American Driver & Traffic Safety Education Association 43(1): 1–8.
128 K Ker, IG Roberts, T Collier, FR Beyer, F Bunn & C Frost. Post-licence driver education for the prevention of road traffic crashes.
Cochrane
database of systematic reviews (3): CD003734. DOI: 10.1002/14651858.CD003734
49
This systematic review provides no evidence that post-licence driver
education [training] is effective in preventing road traffic injuries or
crashes. … Because of the large number of participants included in the
meta-analysis (close to 300,000 for some outcomes) we can exclude, with
reasonable precision, the possibility of even modest benefits.
A 2003 review of the evidence states:129
No one form of education [training] … was found to be substantially more
1982
effective than another, nor was a significant difference found between
advanced driver education and remedial driver education.
Reviews in 1995 and 2009 demonstrate increased crash rates following vehicle-handling
Act
skills-based training such as skid training.130
The same pattern of no road safety benefits from skills-based training for car drivers also
applies for motorcycle riders – benefits are absent in a systematic review of the evidence131
and in a well-controlled evaluation of post-licence rider training.132
This does not mean all forms of driver training do not work. Evidence indicates that many
hours of supervised on-road driver experience reduces the subsequent crash rates of novice
drivers.133 It is not clear why this works. We can only speculate about why this works where
Information
other forms of driver training fail. It may be that the many hours of on-road supervised
practice teaches drivers to better anticipate traffic and hazards or that the supervisor
teaches safe non–risk-taking habits such as driving within the speed limit and wearing a
seatbelt.
5.2.2 Education (including school-based education and driver training)
Official
Education (including school-based education and driver training) is not a solution to road
safety. Education has only small effects on road safety at best, and even these effects, if they
the
occur at all, will take most of the rest of this century to permeate the population, based on
New Zealand’s average life expectancy of around 82 years. There may be value in some
aspects of school-based road safety education (for example, training children how and
where to cross the road safely), but evaluations are poor and effects often weak or non-
existent.134 under
129 K Ker, IG Roberts, T Collier, FR Beyer, F Bunn & C Frost (2003) Post-licence driver education for the prevention of road traffic crashes.
Cochrane database of systematic reviews (3): CD003734. DOI: 10.1002/14651858.CD003734.
130 B Jones (1995) The effectiveness of skid-car training for teenage novice drivers in Oregon.
The Chronicle of American Driver & Traffic
Safety Education Association 43(1): 1–8; R Elvik, A Høye, T Vaa & M Sørensen (eds) (2009)
The handbook of road safety measures. Bingley,
UK: Emerald Group.
131 K Kardamanidis, A Martiniuk, RQ Ivers, MR Stevenson & K Thistlethwaite (2010) Motorcycle rider training for the prevention of road
traffic crashes.
The Cochrane Library. www.cochrane.org/CD005240/INJ_motorcycle-rider-training-for-preventing-road-traffic-crashes
Released
132 RQ Ivers, C Sakashita, T Senserrick, J Elkington, S Lo, S Boufous & L de Rome (2016) Does an on-road motorcycle coaching program
reduce crashes in novice riders? A randomised control trial.
Accident analysis & prevention 86: 40–46.
133 NP Gregersen, A Nyberg & HY Berg. (2003) Accident involvement among learner drivers: An analysis of the consequences of supervised
practice.
Accident analysis & prevention 35(5): 725–730.
134 R Elvik, A Høye, T Vaa & M Sørensen (eds) (2009).
The handbook of road safety measures. Bingley, UK: Emerald Group.
50
An evaluation of school-based bicycle safety education found an increase in crashes with the
education.135
A 2020 review of high school driver education (training) concluded: “The net result of high
school driver education is increased numbers of crashes.”136 A comprehensive review of the
evidence on school-based driver training by the Cochrane Library concluded:137
The results show that driver education [in schools] leads to early licensing.
They provide no evidence that driver education reduces road crash
1982
involvement, and suggest that it may lead to a modest but potentially
important increase in the proportion of teenagers involved in traffic
crashes.
Act
This result may seem unusual given the changes we can create in many other areas of
behaviour through education and training. Three factors appear to create this result.
First, education creates knowledge, but the human behaviours involved in most serious
crashes are not knowledge problems – people do not speed because they do not know there
is a law against it – speeding is a motivation problem. Not drink-driving and not wearing a
seat-belt are also not issues of skill – they too are motivation issues. Therefore, education is
the wrong tool for this particular job.
Information
Second, as identified earlier, training creates over-confidence and thus more risk-taking.
Third, as the Cochrane Library review identified, school-based driver training has the added
disadvantage of starting people driving at a younger age. This matters, because young
drivers have more crashes because they are young not just because they are inexperienced.
Drivers who start driving at a later age are safer, even though they have the same level of
Official
experience at the start of driving as do younger drivers. Age matters because of relatively
recently discovered brain development phases. The frontal cortex of the human brain does
not fully develop until between ages 19 and 25.138 The frontal cortex is critical in the
the
processes of inhibiting the urge to do something (like driving fast or attempting to take a
corner too fast to impress friends). Therefore, the lack of development of this part of the
brain weakens its ability to control such urges in younger drivers. Socially, we may not find it
reasonable to delay driving until this part of the brain is fully developed in everyone, but
delaying solo driving improves road safety and facilitating earlier solo driving harms safety.
under
135 JB Carlin, P Taylor & T Nolan (1998) School based bicycle safety education and bicycle injuries in children: A case-control study.
Injury
prevention 4(1): 22–27.
Released
136 B O’Neill (2020) Driver education: How effective?
International journal of injury control and safety promotion 27(1): 61–68.
137 Roberts IG, Kwan I. (2001). School-based driver education for the prevention of traffic crashes.
Cochrane database of systematic reviews (3), p 2.
138 BJ Casey, RM Jones & TA Hare (2008) The adolescent brain.
Annals of the New York Academy of Sciences 1124: 111–126.
doi: 10.1196/annals.1440.010; SB Johnson & VC Jones (2011) Adolescent development and risk of injury: Using developmental science to
improve interventions
Injury prevention 17(1): 50–54.
51
5.2.3 Awareness raising that uses crash risk or severity as a deterrent
Awareness raising that simply uses crash risk or severity as a deterrent is a weak
intervention. Awareness raising is easy to measure and easy to achieve through advertising,
so is often misleadingly offered as the evidence of success. The valuable objective of road
safety promotions is a change to safer behaviour, measured in observations of behaviour or
in crash outcomes. We should not assume on the basis of theory that raising awareness of
crash risk will achieve this – evidence for this in road safety is poor to non-existent.
1982
As background to why this action fails to deliver road safety gains, see the discussion about
over-confidence and personal illusions of invulnerability (4.6). Over-confidence leads a
person to accept that others have a serious crash risk, but they do not because of “superior
Act
driving” and “invulnerability”.
By following the evidence carefully, we can identify forms of awareness raising that do
reduce serious crashes. For example, promotion of improved or more extensive
enforcement or stronger penalties can reduce serious crashes – as has occurred with the
promotion of mobile safety cameras before their introduction, upcoming random breath
testing or mandatory seat belt laws.139 There is a natural tendency to attribute these
benefits to the enforcement (which is essential for sustained benefits) but the benefits of
such programmes when advertised in advance often occurs before it is possible for the
Information
enforcement itself to create the benefits.140 This works because over-confidence in driving
ability does not mean the safety camera will not catch the speeding driver, so the risk of the
penalty applies to “me” even if I believe I am a great driver.
Official
the
under
Released
139 DC Herbert (1980)
Road safety in the seventies: Lessons for the eighties (Traffic Accident Research Unit report 4/80). New South Wales:
Department of Motor Transport; NSW Centre for Road Safety, RTA (2010)
Do you see what I see: Re-introduction of mobile speed cameras. Sydney: Roads & Traffic Authority & Government of NSW.
140 RFS Job (1988) Effective and ineffective use of fear in health promotion campaigns
. American journal of public health 78: 163–167;
DC Herbert (1980)
Road safety in the seventies: Lessons for the eighties (Traffic Accident Research Unit report 4/80). New South Wales:
Department of Motor Transport.
52
6
Conclusion
This report has presented practical scientific evidence from around the world and from
New Zealand. That evidence leads compellingly to the following conclusions:
• Speed and speeding are major contributors to both crash occurrence and crash severity
through many identified mechanisms, demonstrating that speeding and speed have
substantial roles in crash deaths and serious injuries
• The evidence regarding speed and speeding exists for and applies in New Zealand. If
1982
New Zealand differs from the global evidence it is that speed is even more critical in
serious crashes in New Zealand, possibly because of New Zealand’s topography leading
Act
to many curved road sections and unforgiving roadsides, which result in crashes at
speed being less survivable.
• As well as reducing deaths and serious injuries on the roads, improved management
of speed will deliver additional benefits that far outweigh the (often over-estimated)
dis-benefits.
• We need to understand and address how people’s psychological make-up and
interpretation of experience means we often don’t believe the evidence.
The evidence in this report shows that reducing both urban and non-urban travel speeds in
Information
New Zealand will:
• deliver large reductions in crash deaths and injuries each year
• reduce health harm from air pollution and noise pollution
• create more liveable cities with greater opportunities for active transport
• improve social equity
Official
• reduce greenhouse gas emissions
• improve New Zealand’s economy.
the
The report also presents a variety of actions that can deliver the needed reductions in travel
speed and the evidence for their success, as well as noting a few actions we might expect to
work that the evidence shows do not work and may even do harm.
This report explains the effects of speed and speeding not only on road safety, but also on
under
many health and social issues, helps us understand why we often resist the evidence based
on our psychological biases and misjudgement of risk, and offers the evidence for and value
of lower speeds. All this is presented for road safety implementers and decision makers at all
levels, for road users (whether drivers, passengers, or people who walk, cycle and scoot),
and for the media and commentators to understand, accept, support and deliver lower
travel speeds for New Zealand.
Released
53
References
Abley (2022)
Safe Speeds phase 1: 24 month interim evaluation. Auckland: Abley.
https://at.govt.nz/media/1990901/aukland-transport-report-24-month-safe-speeds-tranche-1-
monitoring.pdf
Accident Rehabilitation & Compensation Insurance Corporation & LTSA (2000).
Down with speed: A
review of the literature and the impact of speed on New Zealanders. Wellington: Land Transport
Safety Authority.
1982
Ahie, LM, Charlton, SG, & Starkey, NJ (2015) The role of preference in speed choice.
Transportation
research Part F: Traffic psychology and behaviour 30: 66–73.
https://doi.org/10.1016/j.trf.2015.02.007
Act
Anderson, JO, Thundiyil, JG, & Stolbach, A (2012). Clearing the air: A review of the effects of
particulate matter air pollution on human health.
Journal of medical toxicology 8(2): 166–175.
Archer, J, Fotheringham, N, Symmons, M, & Corben, B (2008)
The impact of lowered speed limits in
urban and metropolitan areas (report 276) Monash University Accident Research Centre.
www.monash.edu.au/miri/research/reports/muarc276.pdf
Austroads (2018)
Towards Safe System infrastructure: A compendium of current knowledge (research
report AP-R560-18). Sydney: Austroads.
Babisch, W (2006) Transportation noise and cardiovascular risk: updated review and synthesis of
epidemiological studies indicate that the evidence has increased.
Noise and health 8(30): 1.
Information
Banas, T (2020) How to calculate crash forces. Sciencing. https://sciencing.com/calculate-crash-
forces-6038611.html (retrieved November 2021).
Bertulis, T, & Dulaski, DM (2014) Driver approach speed and its impact on driver yielding to
pedestrian behavior at unsignalized crosswalks.
Transportation research record 2464(1): 46–51.
Bhatnagar, Y, Saffron, D, De Roos, M, & Graham, A (2010) Changes to speed limits and crash
Official
outcome: Great Western Highway case study. In
Proceedings of the Australasian road safety
research, policing and education conference (vol 14). Monash University.
Bodin, T, Albin, M, Ardö, J, Stroh, E, Östergren, PO, & Björk, J (2009) Road traffic noise and
the
hypertension: Results from a cross-sectional public health survey in southern Sweden.
Environmental
Health 8(1): 1–10.
Cameron, M (2003)
Potential benefits and costs of speed changes on rural roads (report CR216).
Victoria, Australia: Monash University Accident Research Centre.
Cameron, M (2012) Optimum speeds on rural roads based on “willingness to pay” values of road
under
trauma.
Journal of the Australasian College of Road Safety 23(3): 67–74.
Cameron, M (2022) Economic Analysis of Optimum Speeds on Rural State Highways in New Zealand.
Wellington: Waka Kotahi NZ Transport Agency
Carlin, JB, Taylor, P, & Nolan, T (1998) School based bicycle safety education and bicycle injuries in
children: a case-control study.
Injury prevention 4(1): 22–27.
Carnis, L, & Blais, E (2013) An assessment of the safety effects of the French speed camera program.
Accident analysis & prevention 51: 301–309.
Released
Carsten, OMJ, Fowkes, M, Lai, F, Chorlton, K, Jamson, S, Tate, FN, Simpkin, R (2008) Intelligent speed
adaptation: Final report to Department for Transport. University of Leeds and MIRA Ltd.
Casey, BJ, Jones, RM, & Hare, TA (2008) The adolescent brain. Annals
of the New York Academy of
Sciences 1124: 111–126. doi: 10.1196/annals.1440.010.
54
Charlton, SG, & Starkey, NJ (2017) Driving on urban roads: How we come to expect the “correct”
speed.
Accident analysis & prevention 108: 251–260. https://doi.org/10.1016/j.aap.2017.09.010
Charlton, SG, Starkey, NJ, Perrone, JA, & Isler, RB (2014) What’s the risk? A comparison of actual and
perceived driving risk.
Transportation research part F: Traffic psychology and behaviour 25 (part A):
50–64. https://doi.org/10.1016/j.trf.2014.05.003
Chua, FJ, & Job, RFS (1999) Event-specific versus unitary causal accounts of optimism bias.
Journal of
behavioural medicine 22: 457–491.
Clark, C, Sbihi, H, Tamburic, L, Brauer, M, Frank, LD, & Davies, HW (2017) Association of long-term
1982
exposure to transportation noise and traffic-related air pollution with the incidence of diabetes: A
prospective cohort study.
Environmental health perspectives 125(8): 087025.
De Pauw, E, Daniels, S, Brijs, T, Hermans, E, & Wets, G (2014) An evaluation of the traffic safety effect
Act
of fixed speed cameras.
Safety science 62: 168–174.
Deep Hollow Ranch (2021) How fast can a horse run? (Top & average speed).
www.deephollowranch.com/horse-speed
Delaney, A, Ward, H, Cameron, M, & Williams, AF (2005) Controversies and speed cameras: Lessons
learnt internationally.
Journal of public health policy 26(4): 404–415.
Driven (2020) Watch: What’s the best car ad?
Driven (27 November).
www.driven.co.nz/news/watch-what-s-the-best-car-ad/
Elvik, R (2010) A restatement of the case for speed limits.
Transport policy 17(3): 196–204.
Information
https://doi.org/10.1016/j.tranpol.2009.12.006
Elvik, R (2012) Speed limits, enforcement, and health consequences.
Annual review of public health 33(1): 225–238. https://doi.org/10.1146/annurev-publhealth-031811-124634
Elvik, R (2013) A re-parameterisation of the power model of the relationship between the speed of
traffic and the number of accidents and accident victims.
Accident analysis & prevention 50: 854–
860.
Official
Elvik, R (2019) A comprehensive and unified framework for analysing the effects on injuries of
measures influencing speed.
Accident Analysis & Prevention 125: 63–69.
the
Elvik, R, Høye, A, Vaa, T, & Sørensen, M (eds) (2009)
The handbook of road safety measures. Bingley,
UK: Emerald Group.
Elvik, R, Vadeby, A, Hels, T, & van Shagen, I (2019) Updated estimates of the relationship between
speed and road safety at the aggregate and individual levels
Accident Analysis & Prevention 123:
114–122.
under
ETSC (2008) German Autobahn: The Speed Limit Debate. European Transport Safety Council Speed
Factsheet 01-08.
ETSC (2015) Germany unblocks 30km/h zones. European Transport Safety Council (17 April)
https://etsc.eu/germany-unblocks-30kmh-
zones/#:~:text=Germany's percent20Federal percent20Transport percent20Minister percent20Alexa
nder,to percent20implement percent2030km percent2Fh percent20zones
Farmer, CM (2017) Relationship of traffic fatality rates to maximum state speed limits.
Traffic injury
prevention 18(4): 375–380.
Released
FIA Foundation, www.fiafoundation.org
Ford (2019) The Ford Fiesta ST: Latest reviews. (23 October).
www.faganford.co.nz/news/details/303/the-ford-fiesta-st-latest-reviews
55
Gårder, P (2006) Segment characteristics and severity of head-on crashes on two-lane rural highways
in Maine.
Accident Analysis & Prevention 38(4): 652–661.
Formula 1 (2021) The 10 most dramatic crashes of the 2020 F1 season (video).
YouTube. www.youtube.com/watch?v=ZGd9A2IhQeU
Gregersen, NP (1996) Young drivers’ overestimation of their own skill-an experiment on the relation
between training strategy and skill.
Accident Analysis & Prevention 28(2): 243–250.
Gregersen, NP, Nyberg, A, & Berg, HY (2003) Accident involvement among learner drivers: An
analysis of the consequences of supervised practice.
Accident Analysis & Prevention 35(5): 725–730.
1982
GRSF (World Bank) & GRSP (International Red Cross & Red Crescent Society) (2020).
Guide for
determining readiness for speed cameras and other automated enforcement. Geneva, Switzerland:
Global Road Safety Facility & Global Road Safety Partnership
Act
GRSP & WHO (2008)
Speed management: A road safety manual for decision makers and
practitioners. Geneva, Switzerland: World Health Organization & Global Road Safety Partnership.
Grzebieta, RH (2019) Safe speed limits, Trauma Week 2019 symposium,
Pedestrians: Staying safe,
Royal Australasian College Surgeons, 13 February, Melbourne, Australia. www.surgeons.org/-
/media/Project/RACS/surgeons-org/files/trauma-verification/17-r-grzebieta-safe-speed-
limits.pdf?rev=be72114dc4ef45689dc3ffa5ede40052&hash=3994BB422E7973A805FBA4C7C061D479
Haines, MM, Stansfeld, SA, Job, RFS, Berglund, B, & Head, J (2001) A follow-up study of the effects of
chronic aircraft noise exposure on child stress responses and cognition.
International Journal of
Epidemiology 30: 839–845.
Information
Haines, MM, Stansfeld, SA, Job, RFS, Berglund, B, & Head, J (2001) Chronic aircraft noise exposure,
stress responses mental health and cognitive performance in school children.
Psychological medicine 31: 265–277.
Harre, N, & Sibley, CG (2007) Explicit and implicit self-enhancement biases in drivers and their
relationship to driving violations and crash-risk optimism.
Accident Analysis & Prevention 39(6):
Official
1155–1161.
Henry, A (2006) Ferrari icon Clay Regazzoni dies in car crash aged 67.
The Guardian (16 December).
www.theguardian.com/sport/2006/dec/16/formulaone.gdnsport3
the
Herbert, DC (1980)
Road safety in the seventies: Lessons for the eighties (Traffic Accident Research
Unit report 4/80). New South Wales: Department of Motor Transport.
Homel R (1988)
Policing and punishing the drinking driver: A study of general and specific deterrence. New York: Springer-Verlag.
under
Horton, R (1999) Reflections on another age: Mike Hawthorn remembered.
Atlas Formula 1 journal.
http://atlasf1.autosport.com/99/jan27/horton.html
Hosseinlou, MD, Kheyrabadi, SA, Zolfaghari, A (2015) Determining optimal speed limits in traffic
networks.
International Association of Traffic and Safety Sciences 39(1): 36–41.
Hosseinpour, M, Yahaya, AS, & Sadullah, AF (2014) Exploring the effects of roadway characteristics
on the frequency and severity of head-on crashes: Case studies from Malaysian Federal Roads.
Accident Analysis & Prevention 62: 209–222.
Høye, A (2015) Safety effects of fixed speed cameras: An empirical Bayes evaluation.
Accident
Released
Analysis & Prevention 82: 263–269.
Huang, J, Liu, P, Zhang, X, Wan, J, & Li, Z (2011) Evaluating the speed reduction effectiveness of speed
bump on local Streets.
11th International Conference of Chinese Transportation Professionals 2348–
2357. http://ascelibrary.org/doi/abs/10.1061/41186(421)234
56
Hussain, Q, Feng, H, Grzebieta, R, Brijs, T, & Olivier, J (2019) The relationship between impact speed
and the probability of pedestrian fatality during a vehicle-pedestrian crash: A systematic review and
meta-analysis.
Accident Analysis & Prevention 129: 241–249.
Understand inequality (no date)
Inequality: A New Zealand conversation. www.inequality.org.nz/understand/
IIHS (2021)
Speed. Insurance Institute for Highway Safety. www.iihs.org/topics/speed
ITF (2016) Zero road deaths and serious injuries: Leading a paradigm shift to a safe system. Paris:
International Transport Forum, OECD. http://dx.doi.org/10.1787/9789282108055-en
1982
ITF (2022)
The Safe System approach in action. Paris, France: International Transport Forum, OECD.
Ivers, RQ, Sakashita, C, Senserrick, T, Elkington, J, Lo, S, Boufous, S, & de Rome, L (2016) Does an on-
road motorcycle coaching program reduce crashes in novice riders? A randomised control trial.
Act
Accident Analysis & Prevention 86: 40–46.
Jha, A (2005) How do speed cameras cause traffic jams? The Guardian (17 March).
www.theguardian.com/science/2005/mar/17/thisweekssciencequestions2
Job, RFS (1988) Community response to noise: A review of factors influencing the relationship
between noise exposure and reaction.
Journal of the Acoustical Society of America 83: 991–1001.
Job, RFS (1988) Effective and ineffective use of fear in health promotion campaigns
. American journal
of public health 78: 163–167.
Job, RFS (1990) The application of learning theory to driving confidence: The effect of age and the
Information
impact of random breath testing.
Accident analysis & prevention 22: 97–107.
Job, RFS (1996) The influence of subjective reactions to noise on health effects of the noise.
Environment international 22: 93–104.
Job, RFS (2022) Evaluations of speed camera interventions can deliver a wide range of outcomes:
Causes and policy implications.
Sustainability 14(3): 1765. https://doi.org/10.3390/su14031765
Official
Job, RF, & Brodie, C (2022) Understanding the role of speeding and speed in serious crash trauma:
A case study of New Zealand.
Journal of road safety 33(1): 5–25. https://doi.org/10.33492/JRS-D-21-
00069
the
Job, RFS, Haynes, J, Prabhakar, T, Lee, SHV, & Quach, J (1998) Pedestrians at traffic light controlled
intersections: Crossing behaviour in the elderly and non-elderly. In K Smith, BG Aitken, &
RH Grzebieta (eds),
Proceedings of the conference on pedestrian safety (pp 3–11). Canberra:
Australian College of Road Safety & Federal Office of Road Safety.
Job, RFS, & Mbugua, LW (2020)
Road crash trauma, climate change, pollution and the total costs of
under
speed: Six graphs that tell the story (GRSF note 2020.1). Washington, DC: Global Road Safety Facility,
World Bank. http://documents1.worldbank.org/curated/en/298381607502750479/pdf/Road-Crash-
Trauma-Climate-Change-Pollution-and-the-Total-Costs-of-Speed-Six-graphs-that-tell-the-story.pdf
Job RFS, Truong, J, & Sakashita, C (2022) The ultimate safe system: Redefining the Safe System
approach for road safety.
Sustainability 14(5): 2978. https://doi.org/10.3390/su14052978
Johnson, D (2015) Lewis Hamilton: Heavy partying is to blame for my Monte Carlo car crash.
The Telegraph (12 November).
www.telegraph.co.uk/sport/motorsport/formulaone/lewishamilton/11992509/Lewis-Hamilton-
Released
Heavy-partying-is-to-blame-for-my-Monte-Carlo-car-crash.html
Johnson, SB, and Jones, VC (2011) Adolescent development and risk of injury: Using developmental
science to improve interventions.
Injury Prevention 17(1): 50–54.
57
Jonah, BA (1986) Accident risk and risk-taking behaviour among young drivers.
Accident Analysis &
Prevention 18: 255−271.
Jones, AZ (2020) The physics of a car collision. ThoughtCo. www.thoughtco.com/what-is-the-physics-
of-a-car-collision-2698920 (retrieved February 2022).
Jones, B (1995) The effectiveness of skid-car training for teenage novice drivers in Oregon.
The
Chronicle of American Driver & Traffic Safety Education Association 43(1): 1–8.
Jones, SJ, & Brunt, H (2017) Twenty miles per hour speed limits: A sustainable solution to public
health problems in Wales.
Journal of Epidemiology and Community Health 71(7), 699–706.
1982
Jurewicz, C. (2010).
Impact of lower speed limits for road safety on network operations (No. AP-
T143/10). Melbourne: Austroads.
Jurewicz, C, Sobhani, A, Woolley, J. Dutschke, J, & Corben, B. (2016) Exploration of vehicle impact
Act
speed: Injury severity relationships for application in safer road design.
Transportation Research
Procedia 14: 4247–4256.
Kardamanidis, K, Martiniuk, A, Ivers, RQ, Stevenson, MR, & Thistlethwaite, K (2010) Motorcycle rider
training for the prevention of road traffic crashes.
The Cochrane Library.
www.cochrane.org/CD005240/INJ_motorcycle-rider-training-for-preventing-road-traffic-crashes
Katila, A, Keskinen, E, Hatakka, M, & Laapotti, S (2004) Does increased confidence among novice
drivers imply a decrease in safety? The effects of skid training on slippery road accidents.
Accident
Analysis & Prevention 36(4): 543–550.
Information
Keall, MD, Povey, LJ, & Frith, WJ. (2001) The relative effectiveness of a hidden versus a visible speed
camera programme.
Accident analysis & prevention 33: 277–284.
www.sciencedirect.com/science/journal/00014575
Ker, K, Roberts, IG, Collier, T, Beyer, FR, Bunn, F, & Frost, C (2003) Post-licence driver education for
the prevention of road traffic crashes.
Cochrane database of systematic reviews (3): CD003734.
DOI: 10.1002/14651858.CD003734
Official
Klatte, M, Bergström, K, & Lachmann, T (2013) Does noise affect learning? A short review on noise
effects on cognitive performance in children.
Frontiers in psychology 4: 578.
Kloeden, CN, Woolley, JE, & McLean, AJ (2007)
A follow-up evaluation of the 50km/h default urban
the
speed limit in South Australia. Proceedings of the Road Safety Research, Education and Policing
Conference,
Melbourne, Australia, 17–19 October.
Koorey, G, & Frith, WB (2017) Changing rural speed limits: Learning from the past. IPENZ
Transportation Group Conference, Hamilton, 29–31 March.
under
Llewellyn, R (2018) Increasing the speed limit won’t get traffic moving faster.
The Conversation (6 October). https://theconversation.com/increasing-the-speed-limit-wont-get-traffic-moving-faster-
104365
Mackenzie, J, Hutchinson, T, & Kloeden, C (2015) Reduction of speed limit from 110 km/h to 100
km/h on certain roads in South Australia: A follow up evaluation (CASR report 115). Centre for
Automotive Research, University of Adelaide.
Mackie, H, Brodie, C, Scott, R, Hirsch, L, Tate, F, Russell, M, & Holst, K (2017) The signs they are a-
changin’: Development and evaluation of New Zealand’s rural intersection active warning system.
Released
Journal of the Australasian College of Road Safety 28(3): 11–21.
58
Madireddy, M, De Coensel, B, Can, A, Degraeuwe, B, Beusen, B, De Vlieger, I, & Botteldooren, D
(2011). Assessment of the impact of speed limit reduction and traffic signal coordination on vehicle
emissions using an integrated approach.
Transportation research part D: transport and environment 16(7): 504–508.
Makwasha, T, & Turner, B (2013) Evaluating the use of rural-urban gateway treatments in
New Zealand.
Journal of the Australasian College of Road Safety 24(4): 14–20.
Ministry of Transport (2015)
Speed Survey Results 2015. Wellington: Ministry of Transport
www.transport.govt.nz/assets/Uploads/Report/Speed-survey-results-2015.pdf
1982
Münzel, T, Sørensen, M, & Daiber, A. (2021) Transportation noise pollution and cardiovascular
disease.
Nature reviews cardiology 18(9): 619–636.
Neira, MP (2019) Air pollution and human health: A comment from the World Health Organization.
Act
Annals of global health 85(1).
New Zealand Government (2010)
Safer Journeys. New Zealand’s Road Safety Strategy 2010–2020.
Wellington: Ministry of Transport.
New Zealand Government (2019)
Road to Zero: New Zealand’s Road Safety Strategy 2020–2030.
Wellington: New Zealand Government. www.transport.govt.nz//assets/Uploads/Report/Road-to-
Zero-strategy_final.pdf
New Zealand Police (2020)
Speed evidence review. Wellington: National Road Policing Centre.
Nilsson, G (2004)
Traffic safety dimension and the Power Model to describe the effect of speed on
Information
safety. Sweden: Lund Institute of Technology.
NSW Centre for Road Safety, RTA (2010)
Do you see what I see: Re-introduction of mobile speed
cameras. Sydney: Roads & Traffic Authority and Government of New South Wales.
O’Neill, B (2020) Driver education: How effective?
International journal of injury control and safety
promotion 27(1): 61–68.
OECD (2006)
Speed management (report of the Transport Research Centre). Paris: OECD & European
Official
Conference of Ministers of Transport.
http://documents1.worldbank.org/curated/en/298381607502750479/pdf/Road-Crash-Trauma-
Climate-Change-Pollution-and-the-Total-Costs-of-Speed-Six-graphs-that-tell-the-story.pdf
the
Ohlwein, S, Hennig, F, Lucht, S, Matthiessen, C, Pundt, N, Moebus, S, Jöckel, K-H, & Hoffmann, B.
(2019) Indoor and outdoor road traffic noise and incident diabetes mellitus: Results from a
longitudinal German cohort study.
Environmental epidemiology 3(1).
DOI: 10.1097/EE9.0000000000000037
under
Polkinghorne, J (2014) New Zealand and the 1970s oil shocks: More than just “carless days”. Greater
Auckland (3 January). www.greaterauckland.org.nz/2014/01/03/new-zealand-and-the-1970s-oil-
shocks/
Pope III, CA, Coleman, N, Pond, ZA, & Burnett, RT (2020) Fine particulate air pollution and human
mortality: 25+ years of cohort studies.
Environmental research 183: 108924.
Povey, LJ, Frith, WJ, & Keall, MD (2003) An investigation of the relationship between speed
enforcement, vehicle speeds and injury crashes in New Zealand. Wellington: Land Transport Safety
Authority. www.transportationgroup.nz/papers/2003/01_Povey_Keall_Frith.pdf
Released
Prabhakar, T, Lee, SHV, & Job, RFS (1996) Risk taking, optimism bias and risk utility in young drivers.
In L St John (ed),
Proceedings of the Road Safety Research and Enforcement Conference (pp 61–68).
Sydney, NSW: Roads & Traffic Authority of NSW.
59
Roberts, IG, Kwan, I (2001) School-based driver education for the prevention of traffic crashes.
Cochrane database of systematic reviews (3).
Sakashita, C, & Job, RFS (2015) Employing refined licensing conditions to reduce the serious crashes
of young drivers.
Journal of local and global health science 43.
Seaward, HG, & Kemp, S (2000) Optimism bias and student debt.
New Zealand journal of psychology 29(1): 17–19.
Shope, JT (2007) Graduated driver licensing: Review of evaluation results since 2002.
Journal of
safety research 38(2): 165–175.
1982
Simon, KR, Merz, EC, He, X, Noble, KG (2022) Environmental noise, brain structure, and language
development in children.
Brain and language 229: 105–112.
https://doi.org/10.1016/j.bandl.2022.105112
Act
Sliogeris, J (1992)
110 kilometre per hour speed limit: Evaluation of road safety effects. Victoria,
Australia: VicRoads.
Stefanidis, KB, Truelove, V, Nicolls, M, & Freeman, J (2022) Perceptions matter: Speeding behavior
varies as a function of increasing perceived exposure to content encouraging the behavior.
Traffic
injury prevention 1–6.
Svenson, O (1981) Are we all less risky and more skilful than our fellow drivers?
Acta psychologica
47(2): 143–148.
Svenson, O (2009) Driving speed changes and subjective estimates of time savings, accident risks and
Information
braking.
Applied cognitive psychology 23(4): 543–560. https://doi.org/10.1002/acp.1471
Tankasem, P, Satiennam, T, Satiennam, W, & Klungboonkrong, P (2019) Automated speed control on
urban arterial road: An experience from Khon Kaen City, Thailand.
Transportation research
interdisciplinary perspectives 1: 100032.
Tate, F (2022)
The impact of change in speed limit at three sites (project 5-C4024.00). New Zealand:
WSP.
Official
Te Manatū Waka Ministry of Transport (2020)
Vehicle age. Wellington: Te Manatū Waka Ministry of
Transport . www.transport.govt.nz/statistics-and-insights/fleet-statistics/sheet/vehicle-age
the
Tillman, WA, & Hobbs, GE (1949) The accident-prone automobile driver.
American journal of
psychiatry 106: 321–331.
Tingvall, C, & Academic Expert Group (2021)
Saving lives beyond 2020: The next steps (recommendations of the Academic Expert Group for the third global ministerial conference on road
safety). Stockholm, Sweden: Swedish Transport Administration.
under
Turner, B, Job, S, & Mitra, S (2021)
Guide for road safety interventions: Evidence of what works and
what does not work. Washington, DC: World Bank. www.roadsafetyfacility.org/publications/guide-
road-safety-interventions-evidence-what-works-and-what-does-not-work
Turner, S, Khoo, J, & England, J (2014) How drivers judge the safety of the road. In
Proceedings of the
2014 Australasian Road Safety Research, Policing & Education Conference. Melbourne, Australia.
http://acrs.org.au/files/arsrpe/full-paper_2117.pdf
UNECE (2021) UN vehicle regulation will increase road safety thanks to “black-box” collecting
information on crashes
(press release, 15 October). United Nations Economic Commission for
Released
Europe. https://unece.org/media/press/361071
Van Ratingen, M, Williams, A, Lie, A, Seeck, A, Castaing, P, Kolke, R, Adriaenssens, G, & Miller, A
(2016) The European New Car Assessment Programme: A historical review.
Chinese journal of
traumatology 19(2): 63–69.
60
Waka Kotahi NZ Transport Agency (2011)
High-risk rural roads guide. Wellington: Waka Kotahi
NZ Transport Agency. www.nzta.govt.nz/resources/high-risk-rural-roads-guide/
Waka Kotahi NZ Transport Agency (2021) Appendix A: permanent road safety hardware & devices.
Wellington: Waka Kotahi NZ Transport Agency. www.nzta.govt.nz/assets/resources/road-safety-
barrier-systems/docs/m23-road-safety-barrier-systems-appendix-a.pdf
Walton, D, & Bathurst, J (1998) An exploration of the perceptions of the average driver's speed
compared to perceived driver safety and driving skill.
Accident Analysis & Prevention 30(6): 821–830.
Walton, D, & Smith, K (2009) Survival confidence of New Zealanders in outdoor and post-earthquake 1982
situations.
Australian journal of emergency management 24(3): 38–43.
Waylen, AE, Horswill, MS, Alexander, JL, & McKenna, FP (2004) Do expert drivers have a reduced
illusion of superiority?
Transportation research part F: Traffic psychology and behaviour 7(4–5): 323–
Act
331.
Weinstein, ND (1980) Unrealistic optimism about future life events.
Journal of personality and social
psychology 39(5):
806–820.
Weinstein, ND (1984) Why it won't happen to me: Perceptions of risk factors and susceptibility.
Health psychology 3(5): 431–457.
Weinstein, ND (1988) The precaution adoption process.
Health psychology 7(4): 355–386.
Williams, AF, Tefft, BC, & Grabowski, JG (2012) Graduated driver licensing research, 2010–present.
Journal of safety research 43(3): 195–203.
Information
Wilson, C, Willis, C, Hendrikz, JK, Le Brocque, R, & Bellamy, N. (2010) Speed cameras for the
prevention of road traffic injuries and deaths.
Cochrane database of systematic reviews (11):
CD004607. https://doi.org/10.1002/14651858.CD004607.pub4
WHO (2008)
Speed management: A road safety manual for decision makers. Geneva, Switzerland:
World Health Organization & Global Road Safety Partnership.
WHO (2011)
Burden of disease from environmental noise: Quantification of healthy life years lost in
Official
Europe. Geneva, Switzerland: World Health Organization, Regional Office for Europe.
WHO (2018)
Global status report on road safety. Geneva, Switzerland: World Health Organization.
the
WHO & United Nations Regional Commissions (2021)
Global plan: Decade of action for road safety
2021–2030. Geneva, Switzerland: World Health Organization.
under
Released
61