1982
Act
Information
Official
the
under
Released
TABLE OF CONTENTS
1 PROJECT BACKGROUND
..................................................................................................... 2
2 PROJECT OBJECTIVES
.......................................................................................................... 3 1982
3 FINDINGS
................................................................................................................................ 3
4 CORRELATION ANALYSIS
.................................................................................................... 4
Act
5 LIKELIHOOD OF SPEED TICKETED DRIVERS BEING INVOLVED IN INJURY
............... 8
6 DRIVER PROFILE
.................................................................................................................. 10
7 TIME OF DAY ANALYSIS
.................................................................................................... 19
8 SPEED ANALYSIS
................................................................................................................. 25
9 LIMITATIONS
....................................................................................................................... 27
Information
Official
the
under
Released
Internal / Public Release / Media etc.
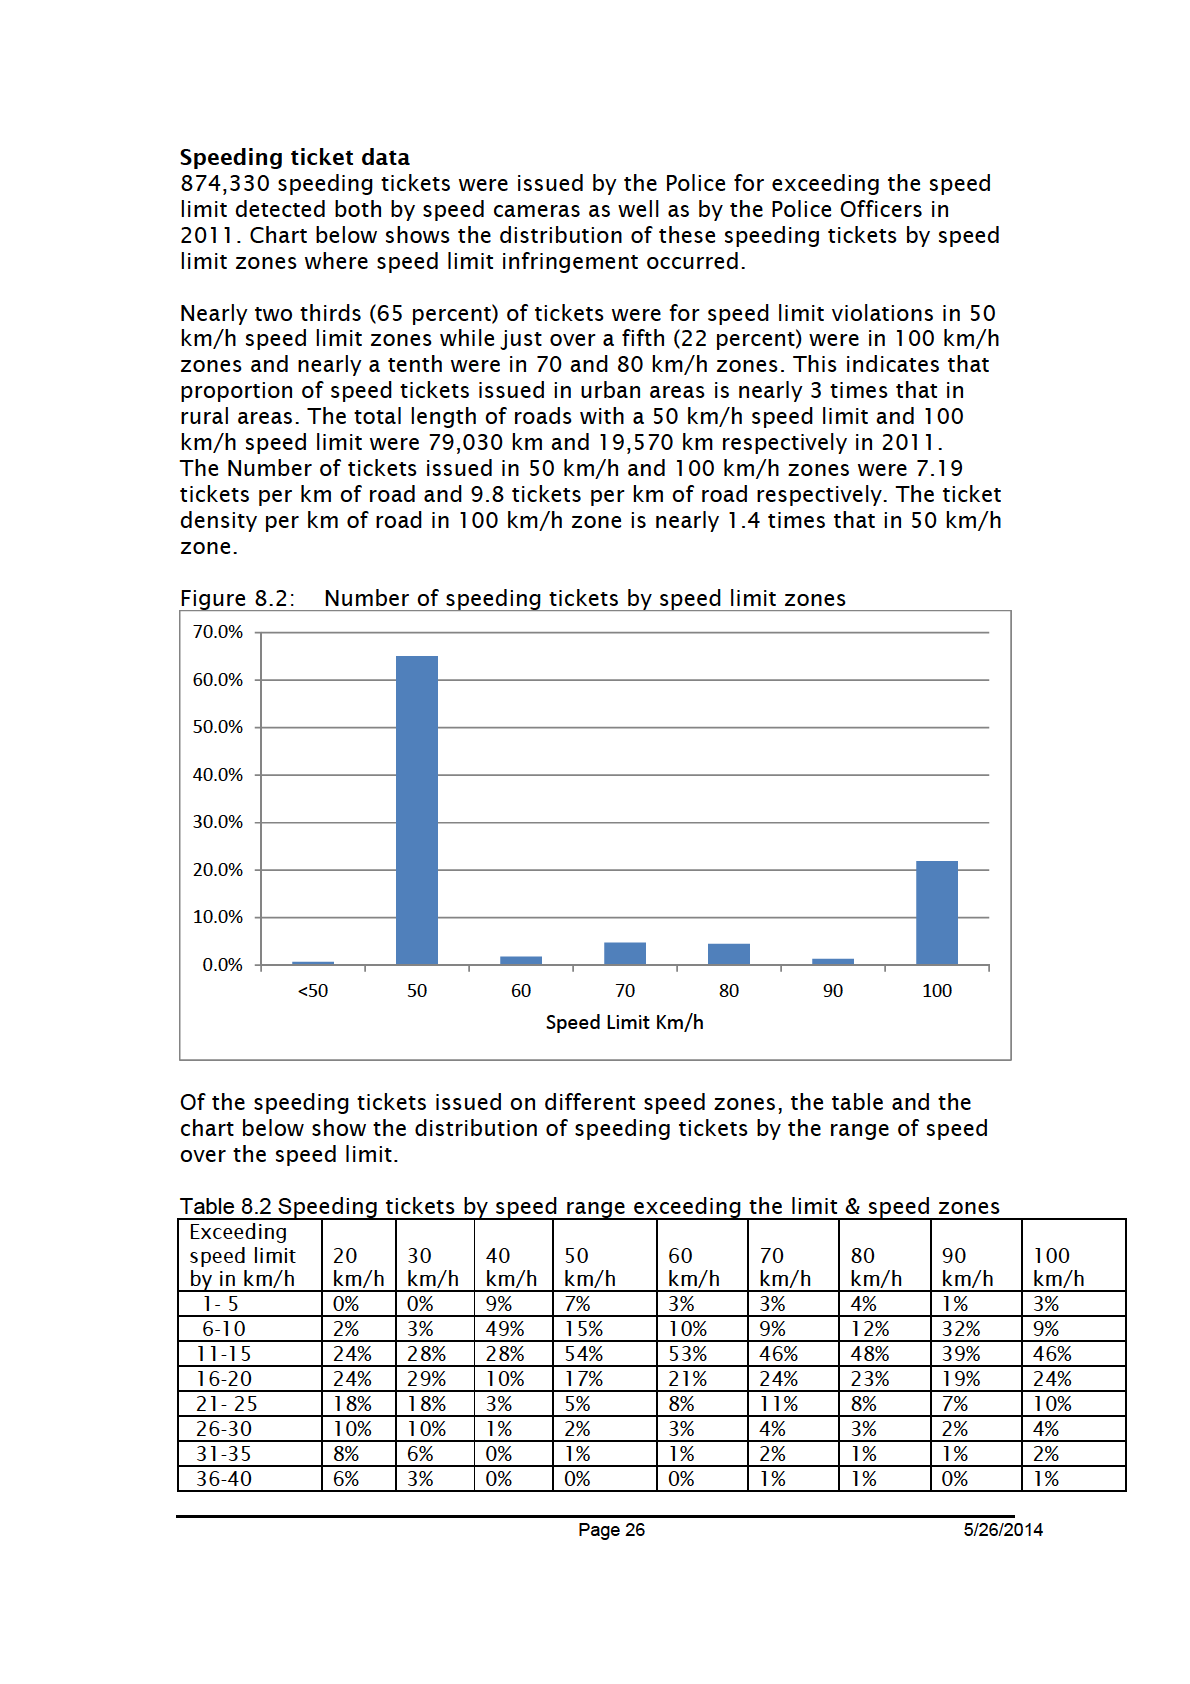
1 Project background
Driving too fast for conditions is one of the major factors involved in motor
vehicle crashes resulting in deaths and serious injuries on New Zealand
roads. For the past five year period, 2009-2013, driving too fast for
conditions was one of the contributing factors in 15 percent of injury
crashes.
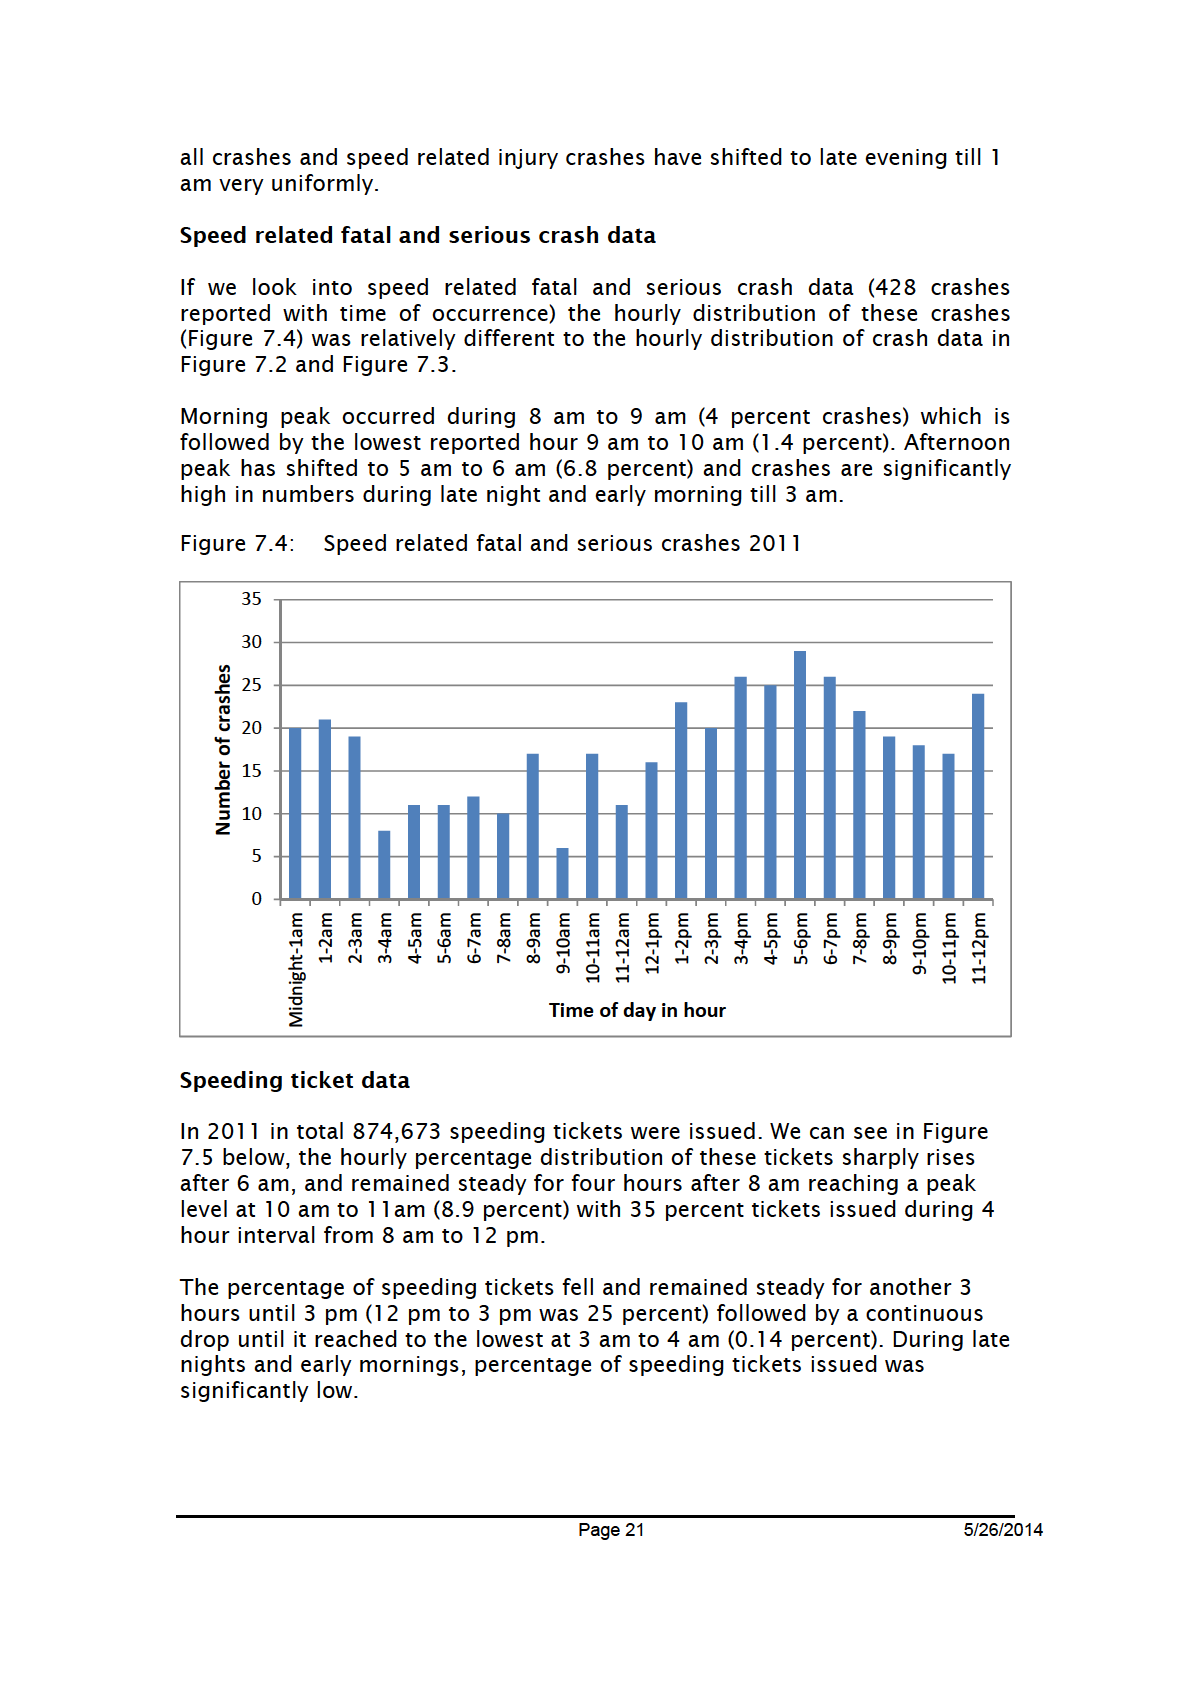
In 2011 driving too fast for conditions was a contributing factor in 78 fatal
1982
crashes, 351 serious injury crashes and 1109 minor injury crashes resulting
in 86 deaths (30% of all deaths), 472 serious injuries (23% of all serious
injuries ) and 1693 minor injuries (16 % of minor injuries ). The estimated
Act
social cost of these injury crashes in 2011 was approx. $721 million. The
social cost of a road crash or a road injury is defined as the total cost that
occurs as a result of the road crash or injury (MOT, 2013).
Even if speed may not be specified by NZ Police as a contributory cause of a
crash higher speeds result in higher levels of severity simply through the
kinetic energy and associated with the crash speed. In order to address the
problem of drivers exceeding posted speed limits the NZ Transport Agency
(NZTA) invests through Road Policing Programme (RPP) to engage with NZ
Information
Police who carries out the speed enforcement activity. The NZTA investment
for 2011/12 RPP was $296.9 million, of which $ 51 million was allocated to
speed enforcement activities. The NZ Police carries out speed enforcement
activities through
directed patrols and traffic surveillance using radar/laser speed
Official
detection apparatus
mobile and fixed speed cameras
evaluation of photographs taken by speed cameras
the
issuing infringement offence notices and prosecution follow up
The total number of tickets (Traffic Offence Notices, TONs) issued to those
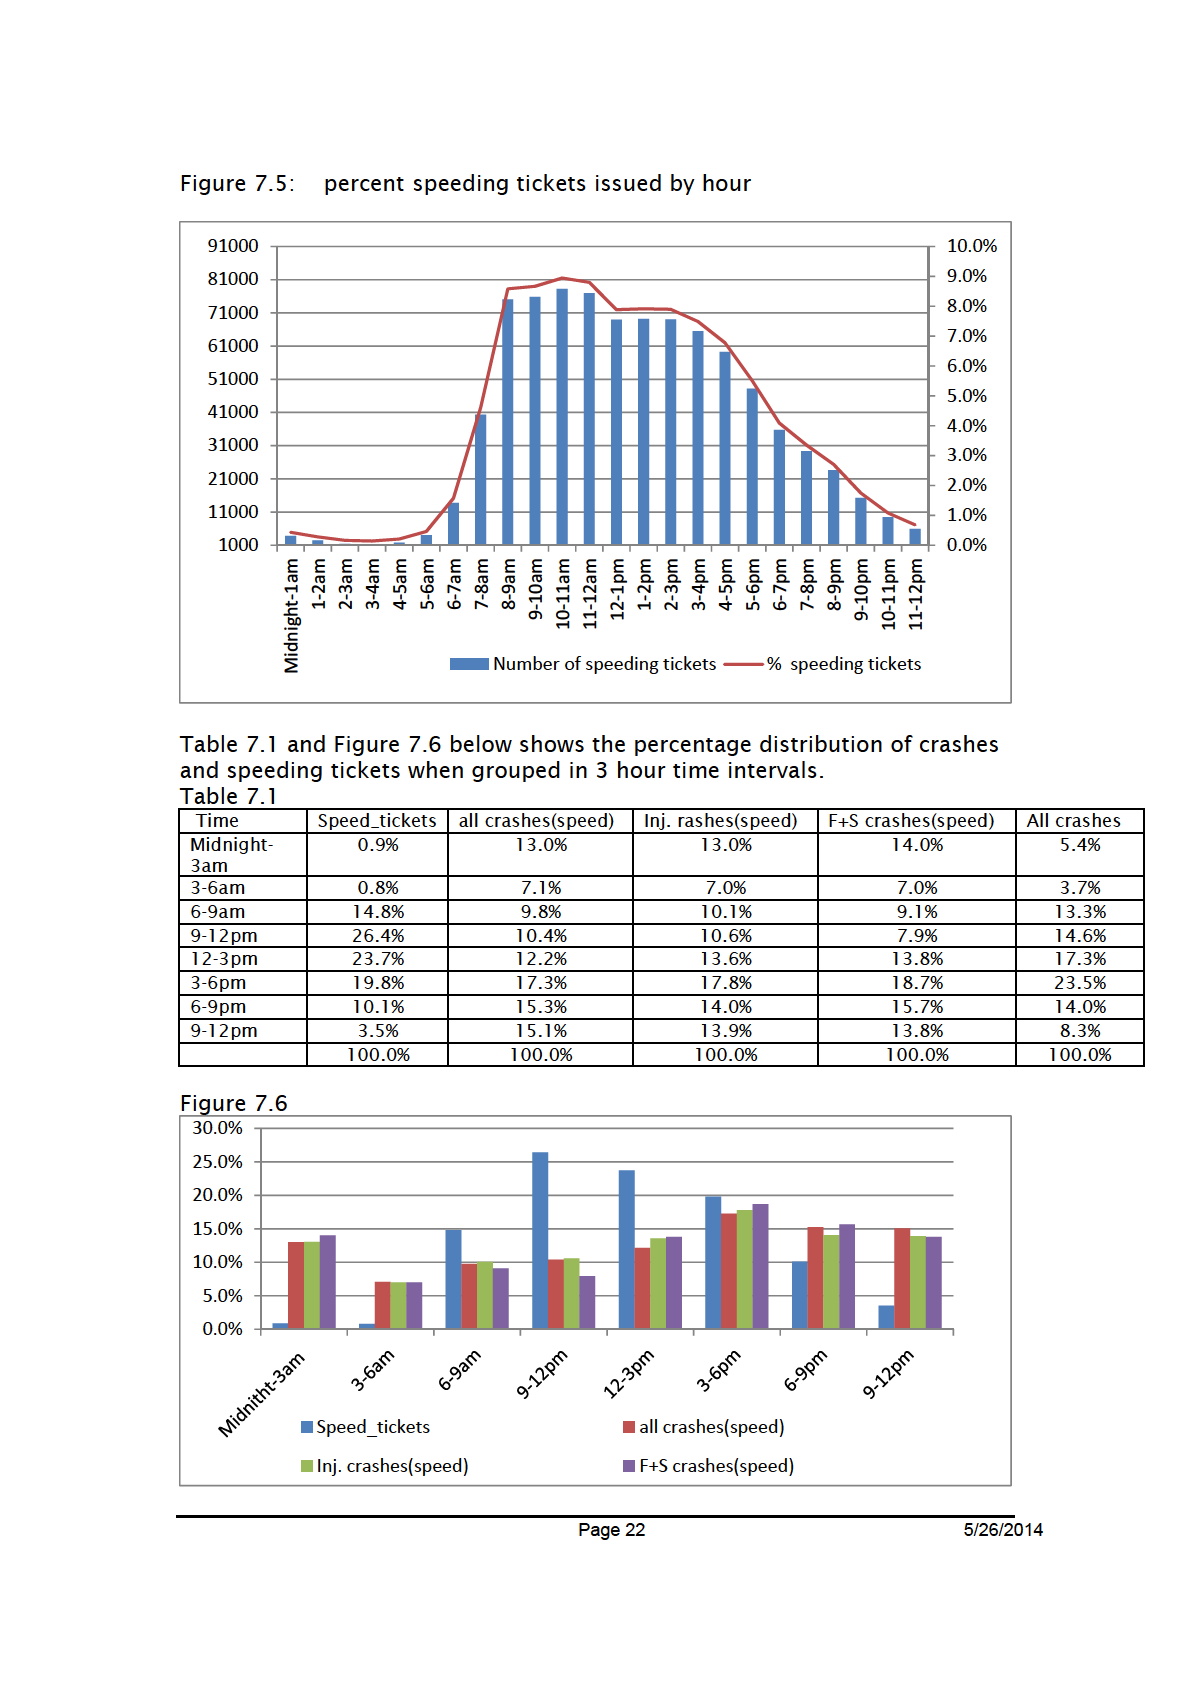
detected driving over the speed limit in the calendar-year 2011 was 874,673.
It included both the speed camera issued tickets as well as tickets issued by
under
the Police Officer.
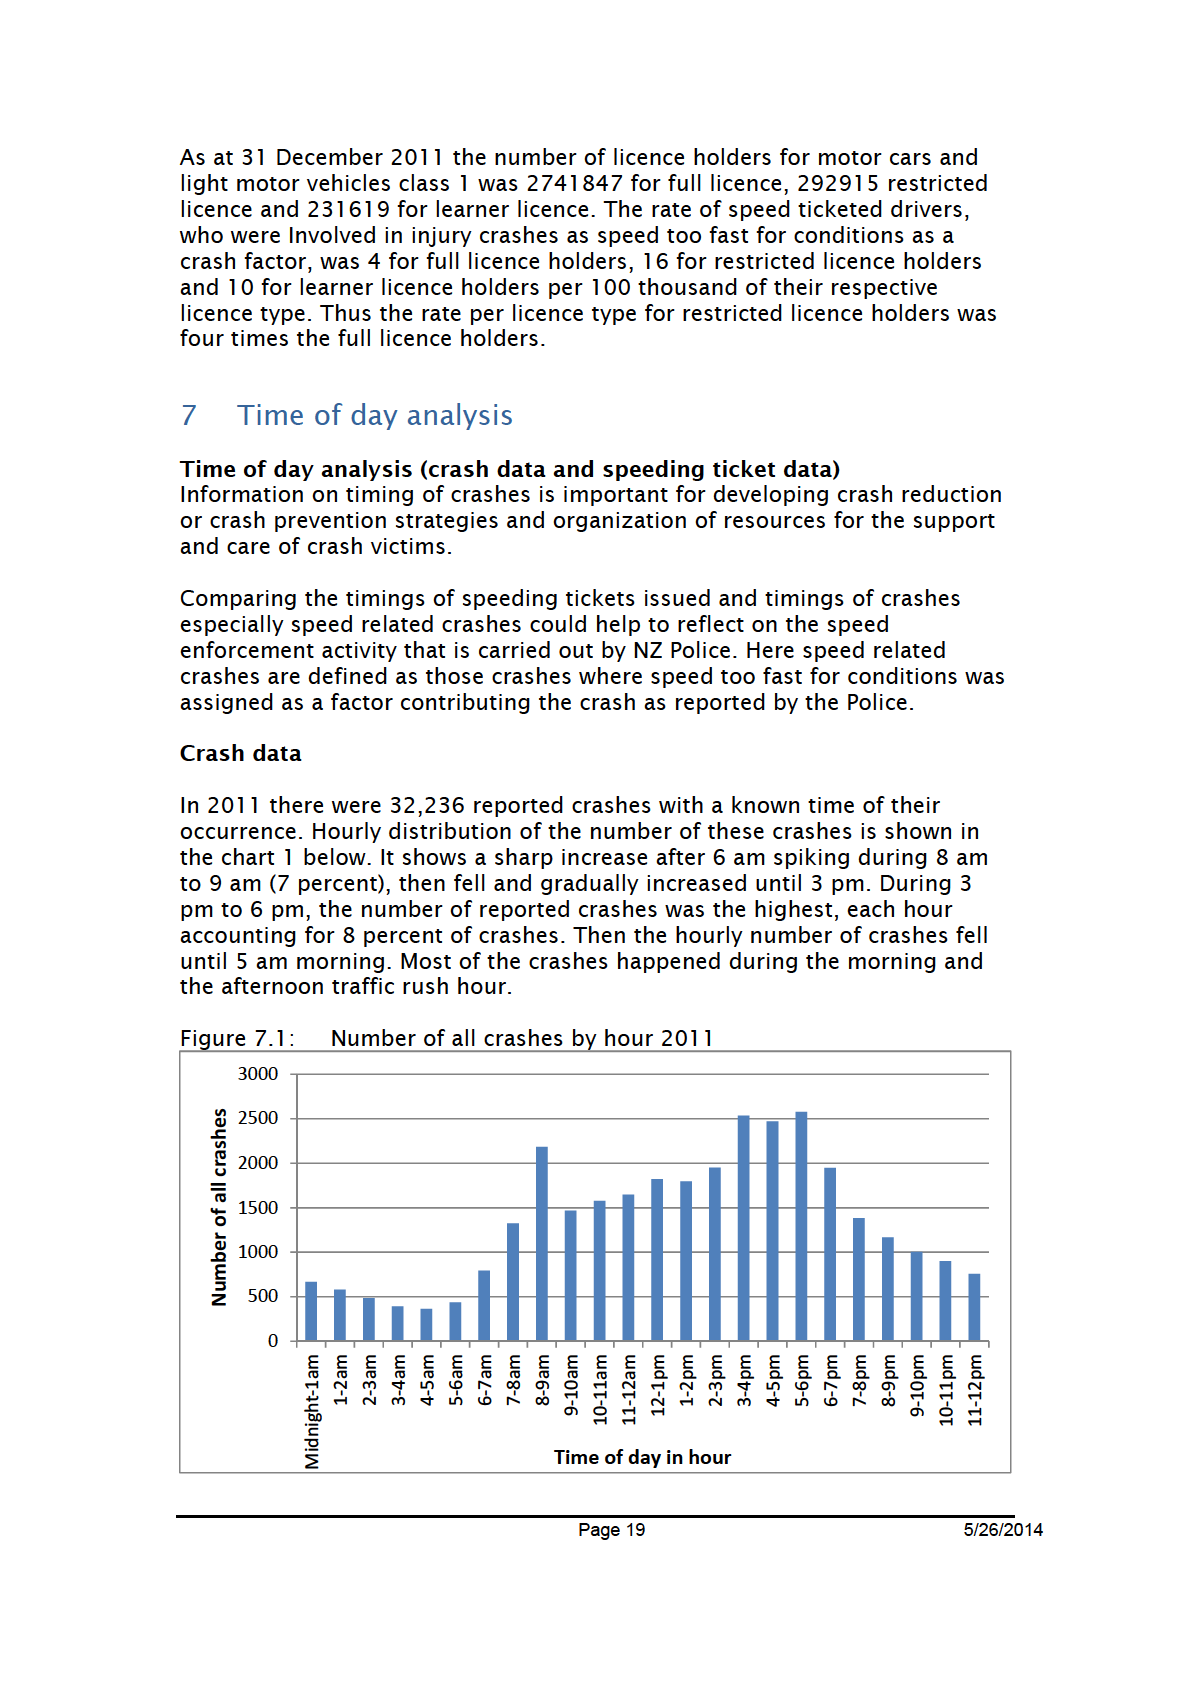
Motor vehicle crash data was obtained from the Crash Analysis System (CAS)
database. For the calendar year 2011, the total number of crashes reported
by the police and recorded in the CAS was 32,455.
This project aims to analyze speeding ticket data and crash data for the year
Released
2011 to achieve the objectives outlined in the next section.
Page
2
5/26/2014
2 Project objectives
To explore correlations if any between the number of speeding tickets
issued and the number of all crashes
To explore the likelihood of speed ticketed drivers being involved in
injury crashes
To profile speed ticketed drivers who were involved in injury crashes
To analyze the times of the day speeding tickets were issued 1982
compared to crashes
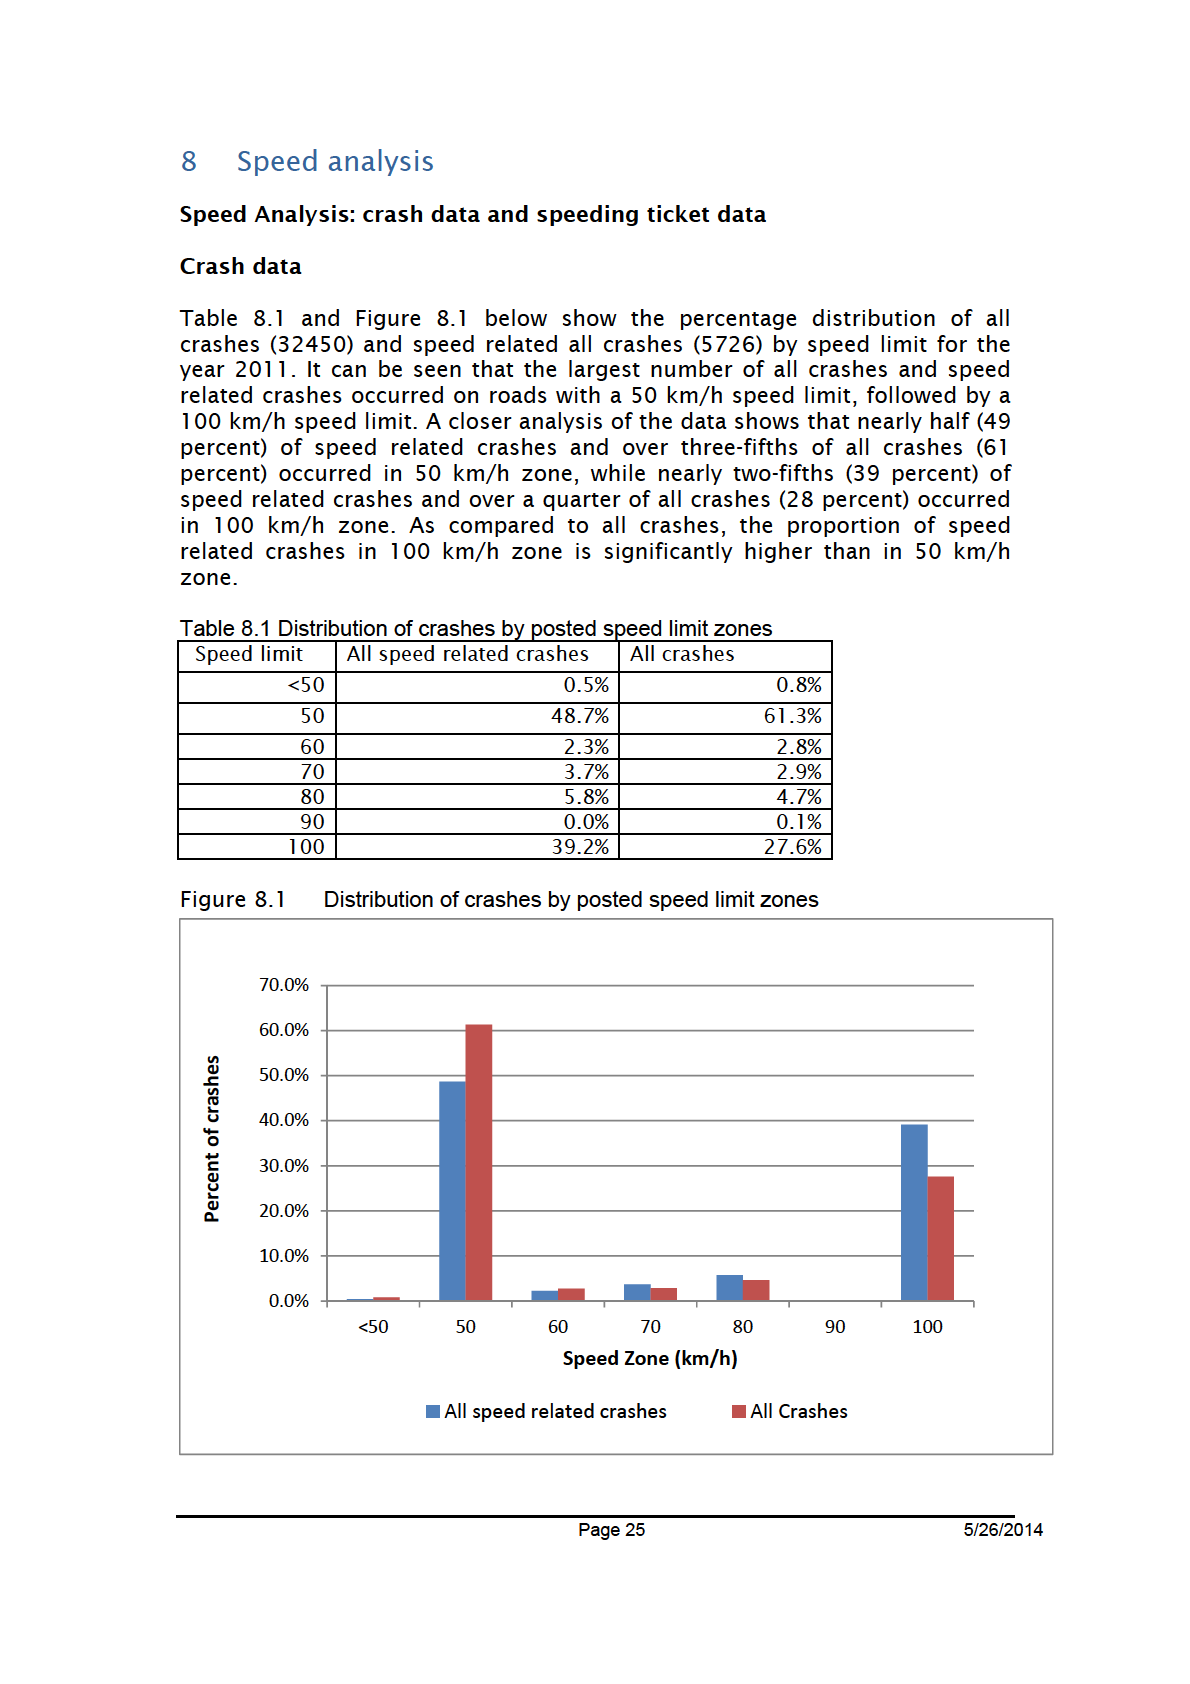
To analyze speeding tickets and crashes in terms of posted speed
limit
Act
3 Findings
Key findings
Very few drivers who were speed ticketed in the sample period were
involved in an injury crash (one in every two hundred drivers). These
drivers may not necessarily have been at-fault in these crashes and at-
Information
fault drivers in any kind of injury crash accounted for only one in every
five hundred speed ticketed drivers.
Even fewer drivers that got a speeding ticket were involved in an injury
crash with “speed too fast for conditions” as a crash factor (one in
every three thousand speed ticketed drivers).
Official
Of the speed ticketed drivers involved as an at-fault driver in an injury
crash, two-thirds held a full licence, a fifth held a restricted licence and
the
a sixteenth held a learner licence. However, on the basis of rate
per
licence type speed ticketed drivers with a restricted licence were two
and half times as likely as drivers with a full licence to be involved in
an injury crash as an at-fault driver.
under
Time analysis showed that half of the speed related crashes and a
third of all crashes happened between 6 pm and 6 am. During this
time period the number of speeding tickets issued was fifteen percent
however most of the speed tickets were issued between 6 am and 6
pm.
Released
Page
3
5/26/2014
Other findings
The regression equation shows that for each increase of one thousand
speeding tickets in a fortnight there was on average a fall of nine
crashes during that fortnight. Please note that this was a statistical
relationship, not the cause and effect relationship.
Between midnight and 6 am, the lowest number of speeding tickets
was issued (less than 2 percent) however the reported number of all
1982
speed related crashes were nearly 20 percent during this time period.
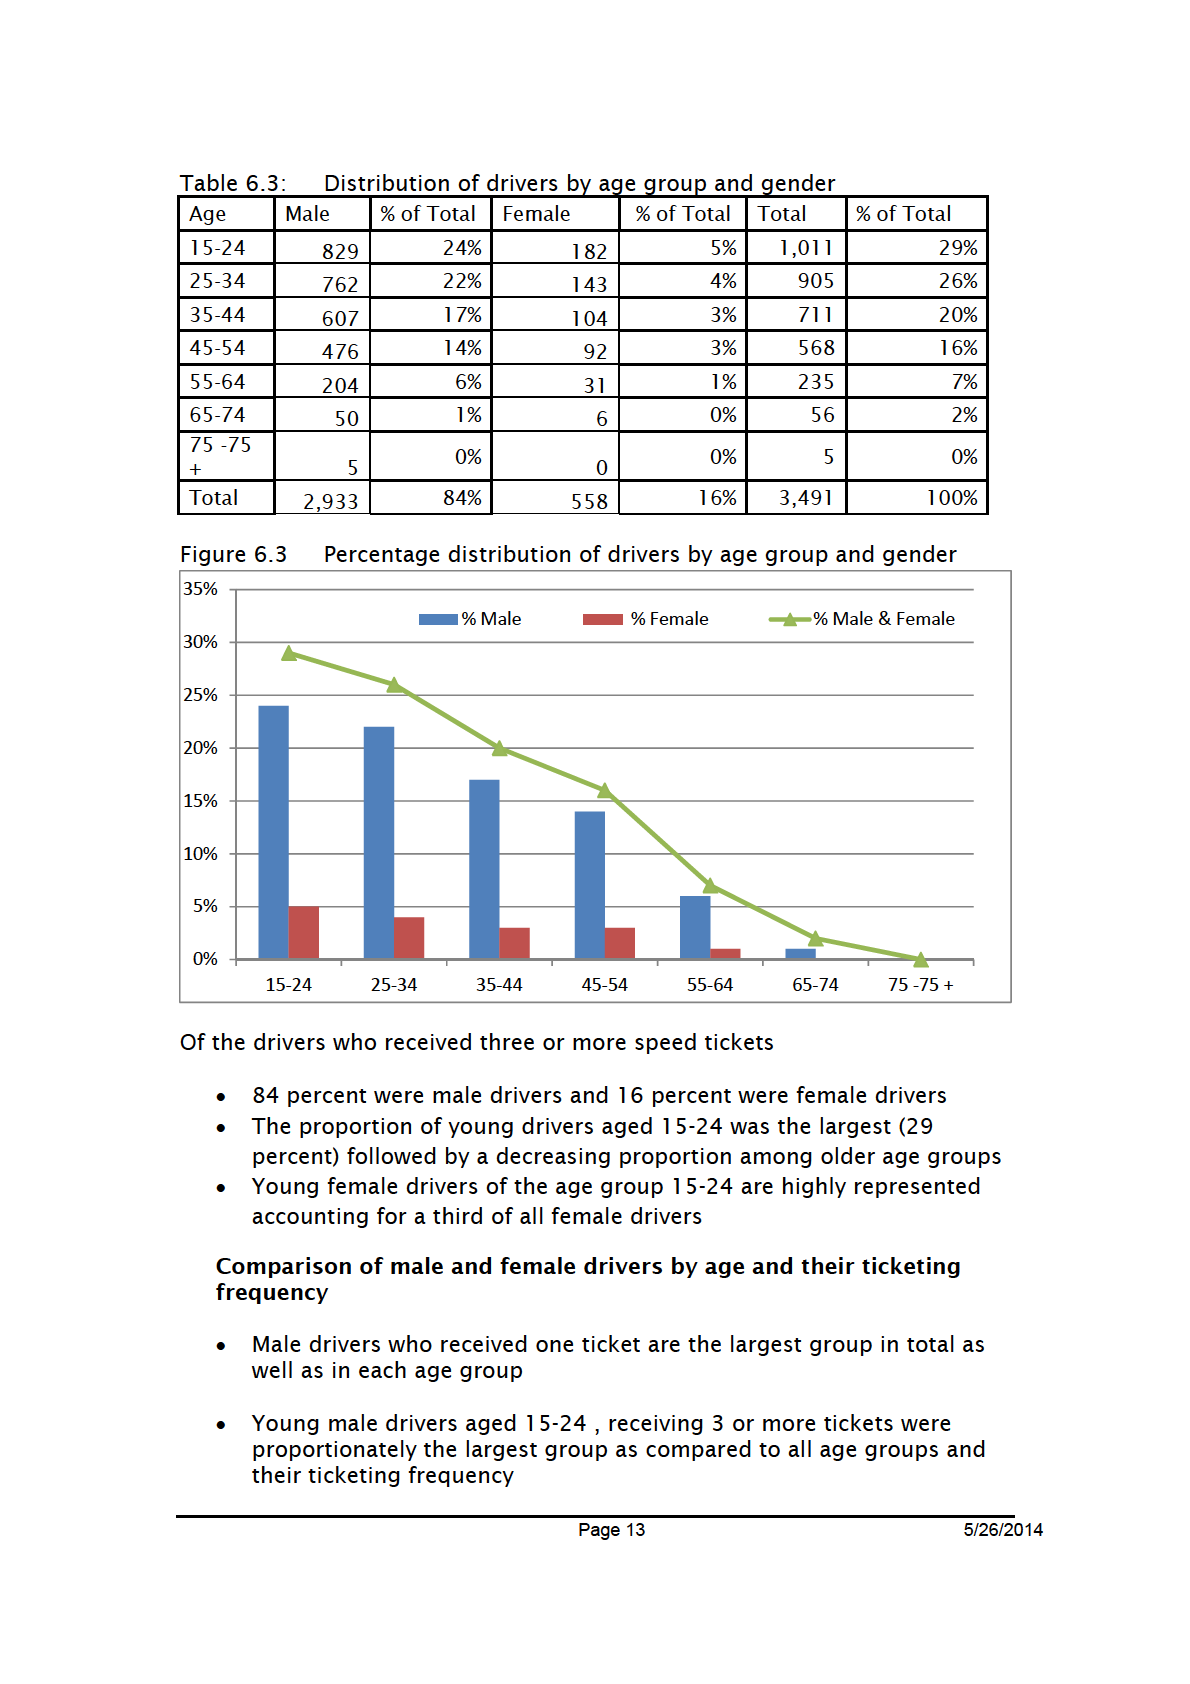
Most drivers who got three or more speeding tickets were male ( 84
Act
percent), young drivers aged 15-24 accounted for a third and young
male drivers aged 15-24 accounted for a quarter.
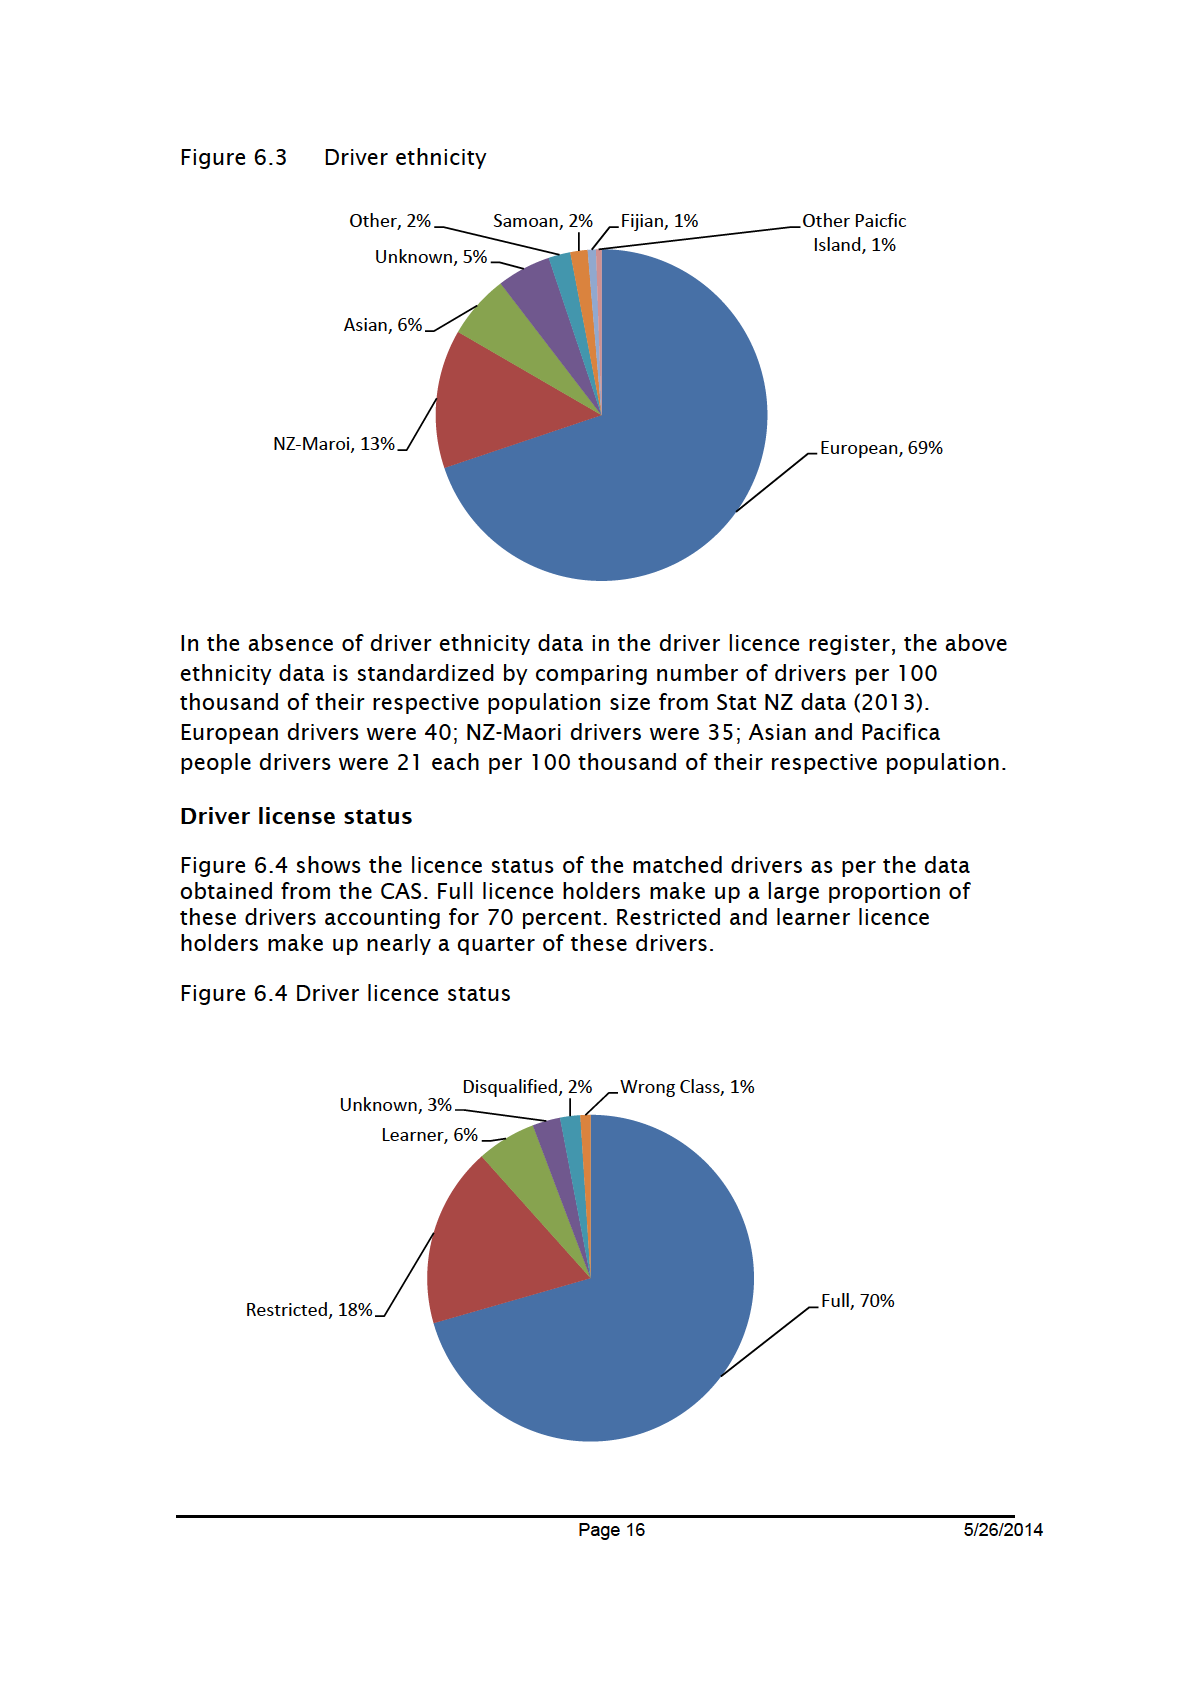
Of the speed ticketed drivers who were involved in an injury crash as
an at-fault driver two-thirds were Europeans and an eighth were NZ-
Maori, however their rate was similar when compared with their
respective population size, nearly forty per 100 thousand of their
respective population size.
Information
The number of speeding tickets issued in urban areas was nearly three
times the speed tickets issued in rural areas. The ticket density per
kilometre of road length in 50 km/h zones was nearly twelve times
that in 100 Km/h zones.
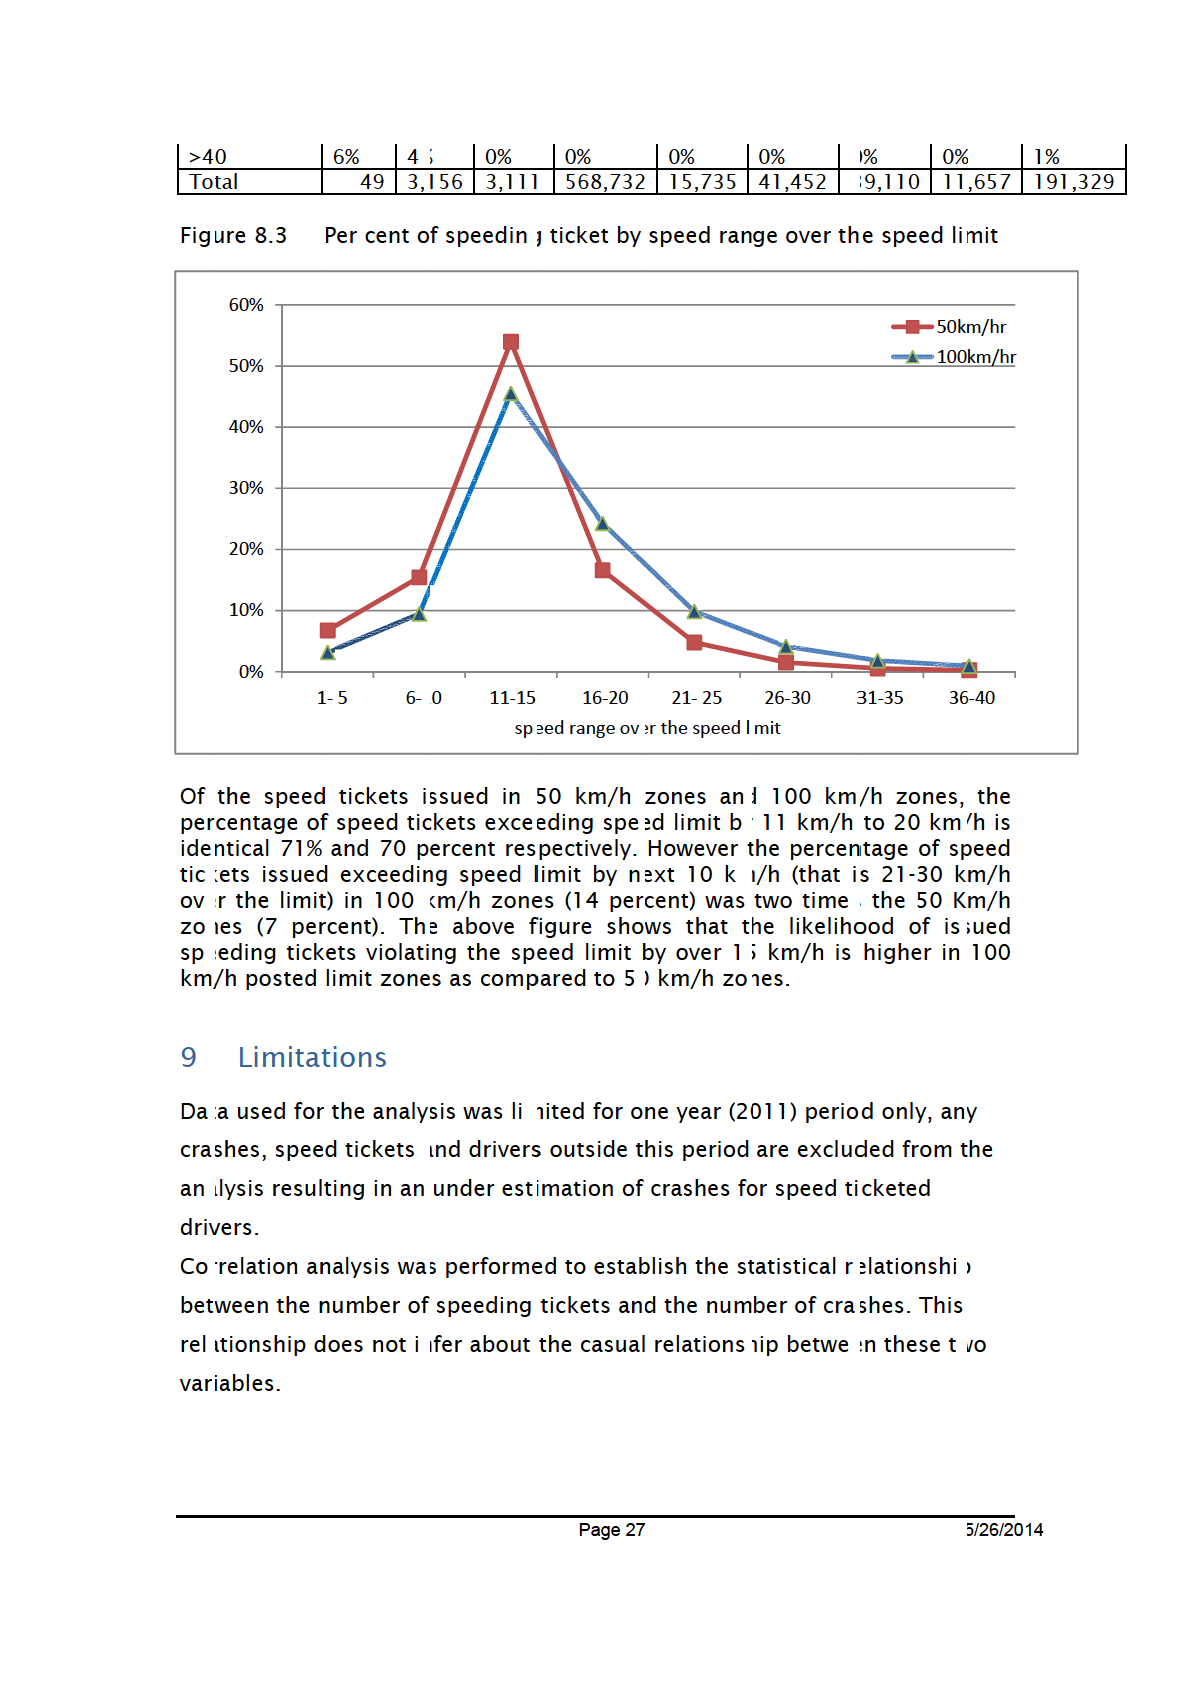
Of the speed tickets issued in 50 km/h and 100 km/h areas, the
Official
percentage of speed tickets exceeding speed limit by 11 km/h to 20
km/h was similar (70 percent each). However the number of speed
tickets issued exceeding the posted speed limit by 21-30 km/h in 100
the
km/h zones (14 percent) was double the 50 Km/h zones (7 percent).
4 Correlation analysis
under
In New Zealand speed limit enforcement is carried out by the NZ Police. The
speed limit is the maximum legal speed a driver can travel on a given section
of a road which is set by a road controlling authority. According to guidelines
in the speed limit rule, if a vehicle is detected by a speed camera exceeding
the speed limit plus the tolerance, speeding ticket is sent to the owner of the
vehicle and if detected by the Police Officer, speeding ticket is given to the
driver of the vehicle.
Released
The tolerance of speeding is publicised as 10km/h over the speed limit in
standard situations, 6km/h for heavy motor vehicles, and 4km/h in school
zones. It is also publicized that the tolerance is dropped to 4km/h on some
Page
4
5/26/2014
long weekends.
Speeding ticket data used in this analysis was obtained from the NZ Police.
The total number of speeding tickets issued in 2011 was 874,673, including
both the speed camera issued tickets as well as tickets issued by the Police
Officer.
The motor vehicle crash data was extracted from the Crash Analysis System
(CAS) database. This analysis included all crashes (32,455) reported by the
1982
NZ Police that occurred during the calendar year 2011.
The analysis is based on the whole population of the data records available in
both the datasets (CAS database for all crashes and all speeding tickets
Act
reported by the NZ Police), so it does not involve sampling error.
As these two official data sets are independently owned and managed by
different government entities for their own business purposes, the
correlation analysis carried out here will only be the statistical relationship or
association between the number of speed tickets issued and number of
crashes occurred during the same time. There may be or may not be the
cause and effect relationship between these variables (change in one variable
causing a change on the other), it is beyond the scope of this project to
Information
examine cause and effect relationship.
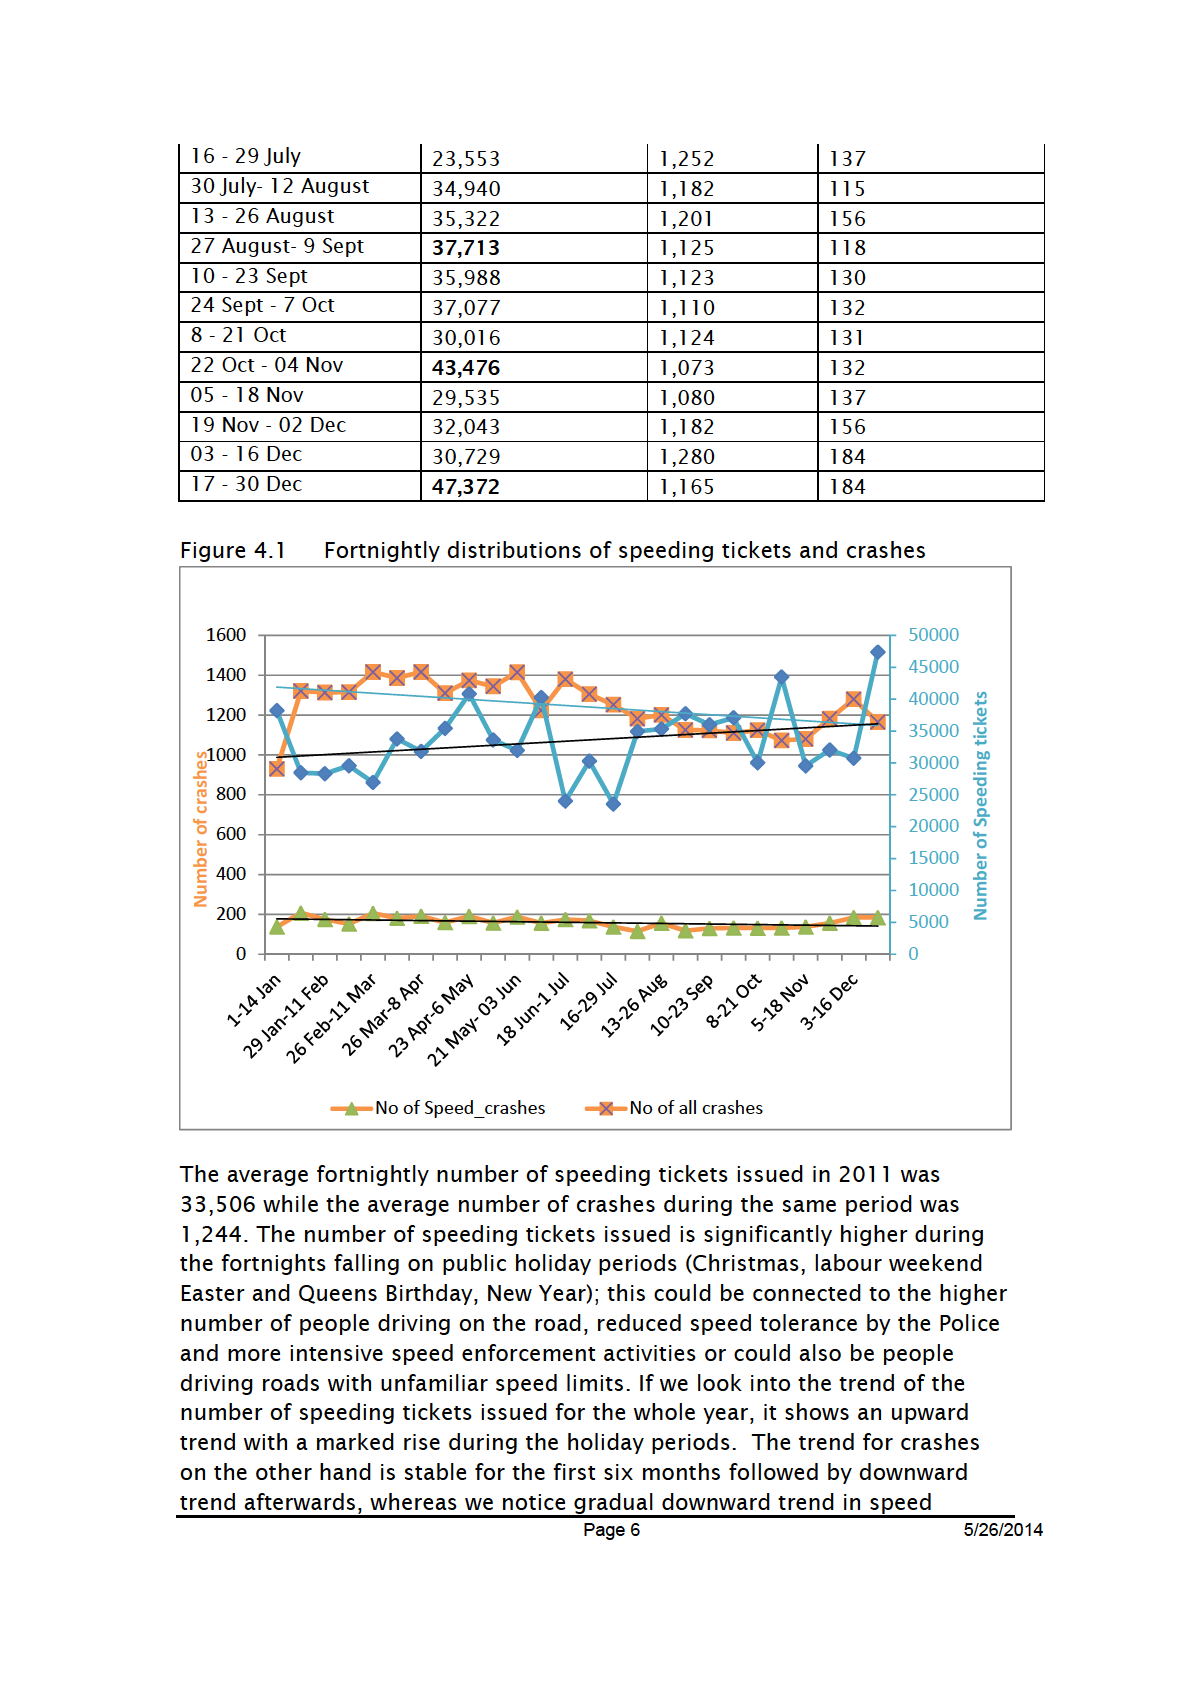
The number of speeding tickets issued in each fortnight and the number of
crashes that occurred during the corresponding fortnight are given in Table
4.1 and Figure 4.1. For the year 2011, Dec 31 was the only one day left after
26th fortnight, so number of speeding tickets issued and number of crashes
Official
occurred on that day was excluded from the analysis.
Table 4.1: Fortnightly distribution of speeding tickets and crashes
the
Fortnights (2011)
No of speeding
No of all
No of speed related
tickets issued
crashes
crashes
01 - 14 Jan
38,204 930
137
15 - 28 Jan
28,458 1,321
207
29 Jan - 11 Feb
28,302 1,313
175
under
12 - 25 Feb
29,560 1,315
152
26 Feb - 11 March
26,938 1,416
205
12 March- 25 March
33,767 1,386
181
26 March - 08 April
31,813 1,416
191
09 - 22 April
35,416 1,310
159
23 April - 06 May
40,818 1,374
190
07 - 20 May
33,602 1,344
157
Released
21 May- 03 June
31,951 1,415
187
04 - 17 June
40,253 1,224
156
18 June- 01 July
24,018 1,380
174
02 - 15 July
30,279 1,305
168
Page
5
5/26/2014
1982
Act
Information
Official
the
under
Released
1982
Act
Information
Official
the
under
Released
Table 4.2
Number of speeding tickets
Number of crashes/
issued/fortnight
fortnight
Number of speeding tickets
1
issued/fortnight
Number of crashes/
-0.435236569
1
fortnight
The correlation coefficient, r value obtained is -0.44, which means the
fortnightly number of speeding tickets and the corresponding number of
1982
crashes have a negative moderate correlations (Taylor, 1990 interprets
correlation coefficient, r as- if absolute value of r =0 no correlations at all, r
<=0.35 weak correlations, r is 0.36 to 0.67 moderate correlations, and 0.68
Act
to 1.0 as strong correlations).
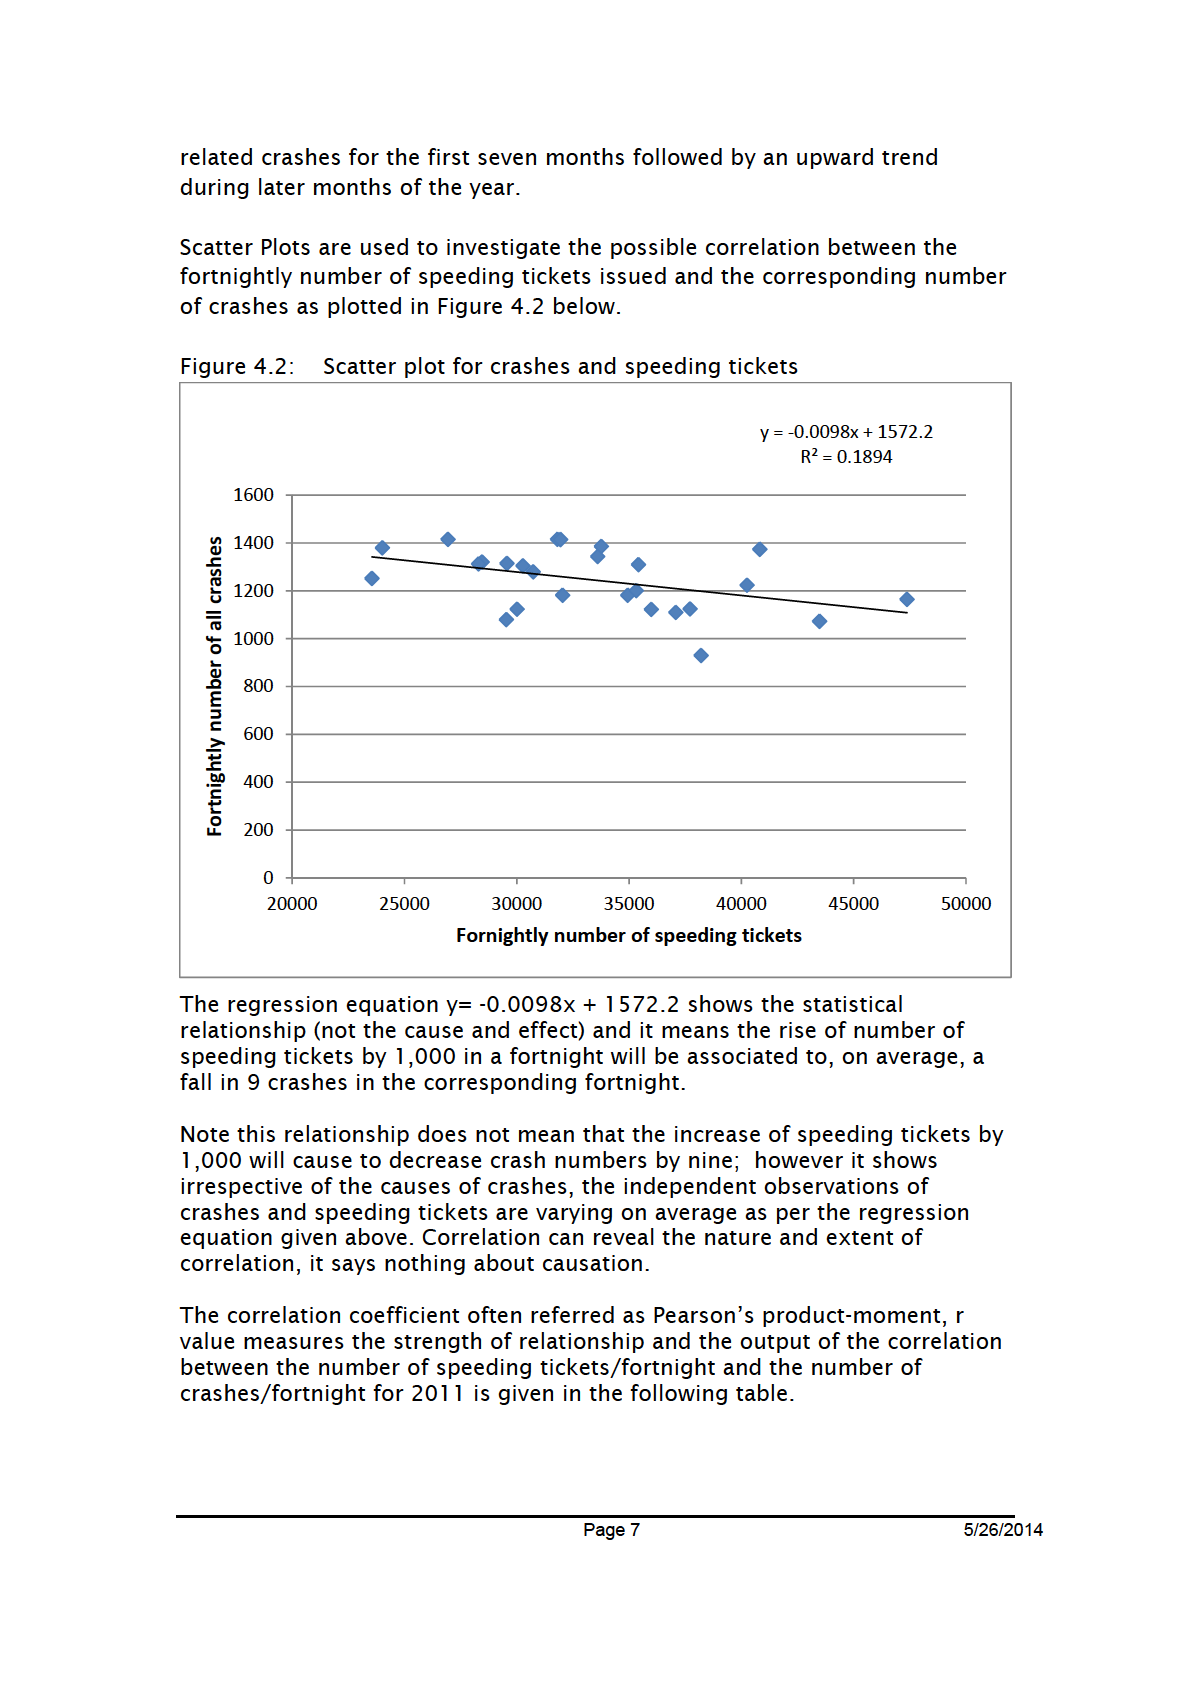
The coefficient of determination (R² = 0.1894), is a measure of how well the
regression line represents the data. It is nearly 20% that means 20 percent of
the data is the closest to the regression line (approximately 20 percent of the
total variation in number of crashes per fortnight can be explained by the
regression model, the equation of the regression line).
5 Likelihood of speed ticketed drivers being involved in
Information
injury crashes
There were altogether 874,673 speeding tickets issued by the NZ Police in
2011. The excel data file received from NZ Police containing this data was
exported to MS Access as a table. This speeding ticket data included 338
tickets issued by red light cameras and thus excluded from the analysis
additionally there were 2008 speeding tickets where Drive Licence field was
Official
null and these were also excluded. Out of 872,327 remaining records, those
with the same Driver Licence were grouped and finally we acquired 621,843
unique drivers, these were speed ticketed were used to match with crashed
the
drivers.
There were total 15,192 drivers involved in injury crashes in 2011 as per data
extracted from the CAS. These drivers’ data was exported to MS Access as a
table of crashed drivers. Next 1,570 records of drivers without a driver
under
licence were removed from the data set, giving the total number of drivers
available for analysis of 13,622. After eliminating repeated driver licenses,
there were 13,538 drivers involved in injury crashes.
Then 621,843 unique drivers from the speeding tickets table and 13,538
unique drivers from the crash table were linked by the driver licence number.
There were 3,200 linked records where the driver licence number was
matched. These records were further validated by matching the date of birth
field. Thus out of the 621,843 drivers who were speed ticketed in 2011,
Released
there were 3,200 drivers who were involved in injury crashes, thus the
probability of speed ticketed drivers being involved in an injury crash was 0.5
percent. That means out of 200 drivers who were speed ticketed, one driver
was involved in injury crash. An important point is that the speed ticketed
Page
8
5/26/2014
drivers were not at all necessarily the at-fault or part-fault driver.
Table 5.1 below shows the reported (observed) number of crashed/not
crashed drivers against the number of speeding tickets they received.
Table 5.1 Number of drivers by the number of speeding tickets they received
(O =observed Values)
Number of drivers
Number of tickets
Crashed(O)
Did not crash(O)
Total
% Crashed
1982
1
2,272
467,969 470,241
0.48%
2
624
103,639 104,263
0.60%
3
197
29,327
29,524
0.67%
Act
4
65
9,624
9,689
0.67%
5
25
3,618
3,643
0.69%
>=6
17
4,466
4,483
0.38%
Total
3,200
618,643 621,843
0.51%
From the above table we can see that percentage of crashed drivers was
different for drivers grouped by the number of speeding tickets they
received. To test whether the involvement of drivers in injury crashes was
significantly different with the number of speeding tickets they received.
Chi Square Test was performed.
Information
Null hypothesis (H0): There is no significant difference between the number
of speeding tickets a driver receives and involvement in injury crashes
Alternate hypothesis (H1): There is significant difference between the number
of speeding tickets a driver receives and involvement in injury crashes.
Official
Below is the distribution of expected number of drivers assuming that null
hypothesis is true and working for Chi Square test.
the
Table 5.2 Number of drivers by the number of speeding tickets they received
(E= expected Values)
2
Number of
Expected numbers
(O-E)
(O-E) /E
tickets
Crashed (E) Did not crash (E) Crashed Did not crash Crashed Did not crash
1
2,419.86 467,821.14 -147.86 147.86 9.03
0.05
under
2
536.54 103,726.46
87.46 -87.46
14.26 0.07
3
151.93 29,372.07 45.07 -45.07
13.37 0.07
4
49.86 9,639.14 15.14 -15.14
4.60 0.02
5
18.75 3,624.25 6.25 -6.25
2.09 0.01
>=6
23.07 4,459.93 -6.07 6.07
1.60 0.01
Total
3,200.00 618,643.00 0.00 0.00
44.94
0.23
Results:
Chi Square Value = 45.17
degrees of freedom= 5
Released
P value obtained was 1.34*10 -8
This is a highly significant result as for P Value is less than 0.01 at 1 percent
level of significance (99 percent confidence level). So we reject the null
Page
9
5/26/2014
1982
Act
Information
Official
the
under
Released
1982
Act
Information
Official
the
under
Released
1982
Act
Information
Official
the
under
Released
1982
Act
Information
Official
the
under
Released
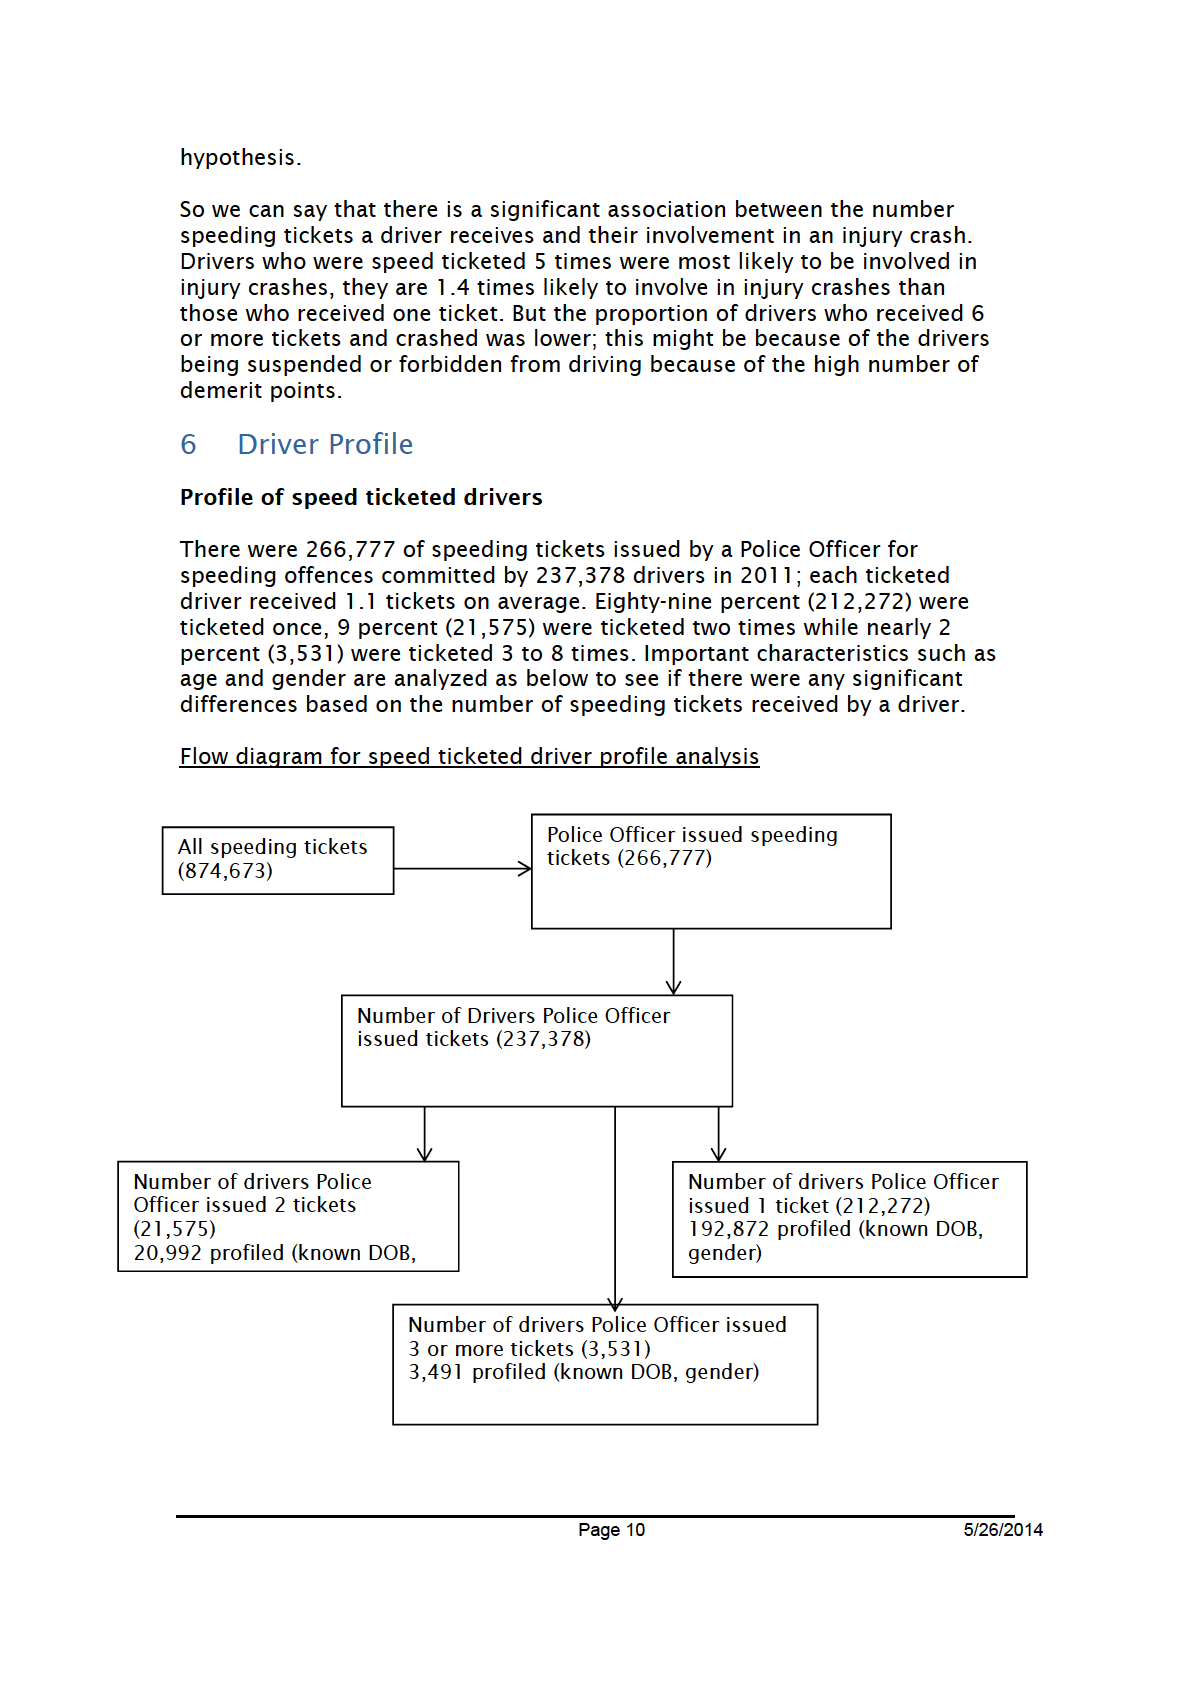
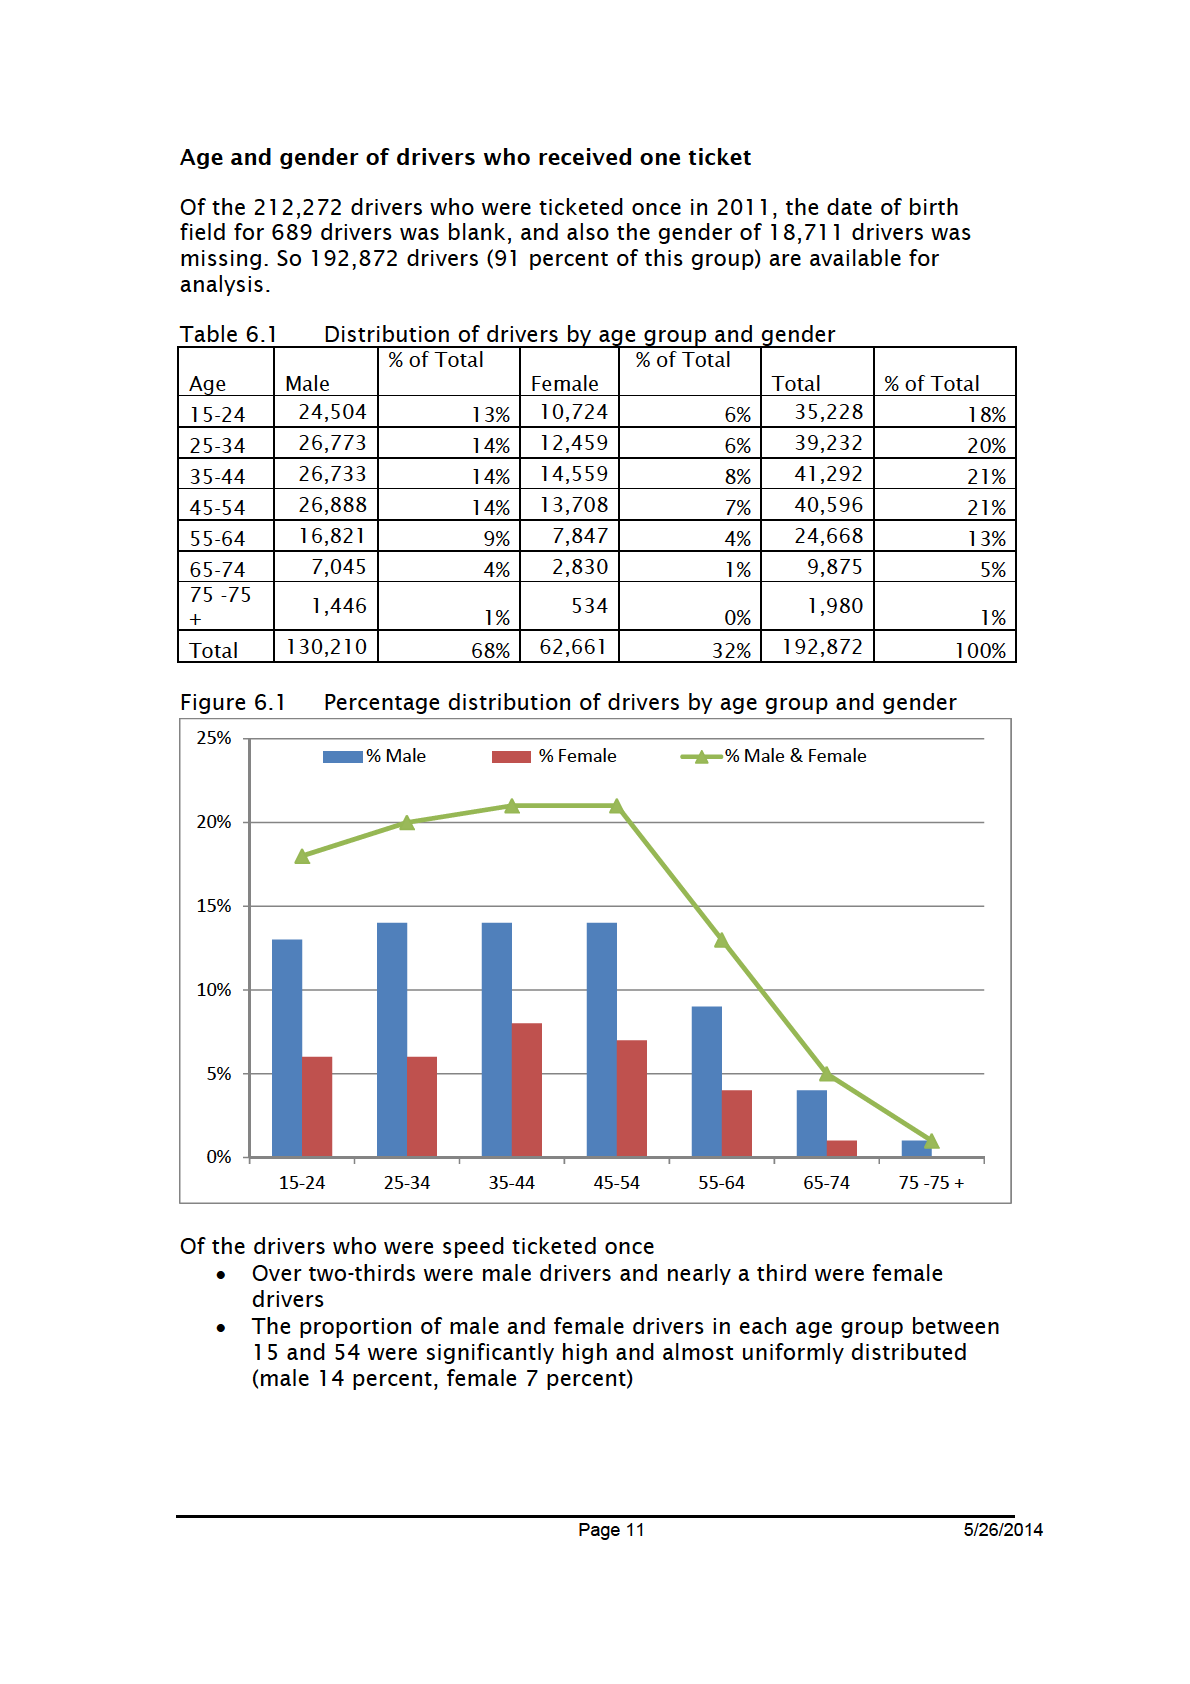
Among the single speed ticketed drivers, proportion of drivers
increased as the age increased to a 45-54 age group. Age groups 35-
44 and 45-54 were the largest group each accounting for 21 percent.
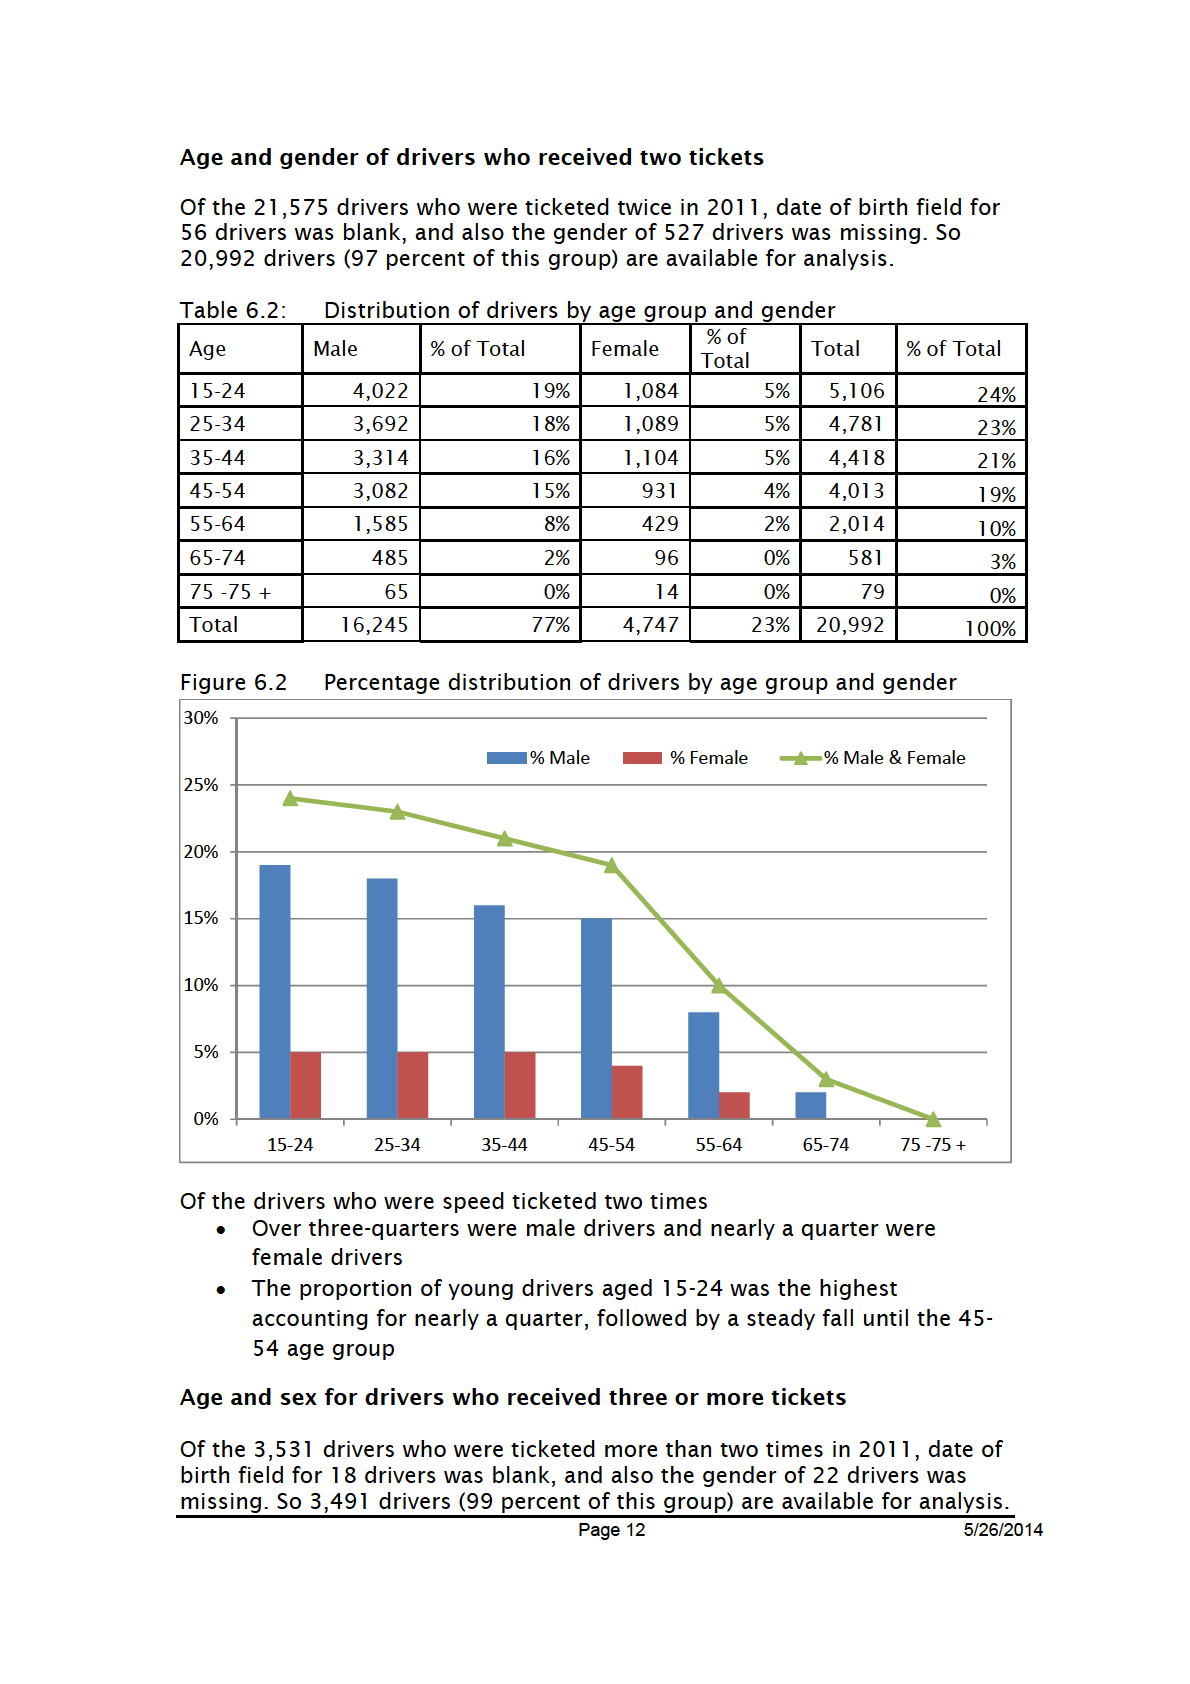
Proportions of young drivers aged 15-24 increased as the number of
speeding tickets they received increased, it was 18 percent among
single speeding ticketed group, 24 percent among two speeding
ticketed group and 29 percent among who received three or more
speeding tickets, it shows that younger drivers are more likely to be a
repeat speed offender detected by the enforcement.
1982
Profile of speed ticketed drivers involved in injury crashes who were at
fault or part fault
Act
There were unique 13,538 drivers involved in injury crashes in 2011; some of
them were involved more than once. Of these, there were 8,435 unique
drivers who were at fault or part fault (all at fault/part fault drivers frequency
count was 9,637).
Each of the 8,435unique at-fault or part-fault drivers involved in injury
crashes were matched against the 237,378 speed ticketed drivers. There
were 1,369 matching records, while uniquely matched records were 1131. Of
these drivers, the gender for nine drivers was missing. So 1,122 drivers are
available for analysis.
Information
driver data matching for at fault crashed driver who were speed ticketed
Number of drivers Police Officer issued
tickets (237,378) Box 1
Official
Number of at-fault/part-fault
Number of at-fault/part-fault
the
dr ivers in injury crashes
drivers with speed too fast factors
(8,435) Box 2
in injury crashes (1,516) Box 3
under
Combined data from
Combined data from
box 1 and box 2
box 1 and box 3
Driver Data matching (Licence No
Driver Data matching (Licence No
and DOB)
and DOB)
1,369 records obtained
262 records obtained
1,131 were unique Drivers (9 did
211 were unique Drivers profiled
Released
not have gender available)
Page
14
5/26/2014
1982
Act
Information
Official
the
under
Released
1982
Act
Information
Official
the
under
Released
As at 31 December 2011 the number of licence holders for motor cars and
light motor vehicles class 1 was 2741847 for full licence, 292915 restricted
licence and 231619 for learner licence. The rate of speed ticketed drivers
who were at fault or part fault in injury crashes per100 thousand of their
respective licence type, was 29 for full licence holders, 69 for restricted
licence holders and 28 for learner licence holders, thus the rate per licence
type for restricted licence holders was two and half times the full licence
holders.
Profile of speed ticketed drivers involved in injury crashes with speed
1982
too fast for conditions as a crash factor
There were 1,516 at fault or part fault drivers involved in injury crashes with
speed too fast for conditions as a factor. Of these drivers 1,327 were unique
Act
drivers. These individual drivers were matched against the 237,378 speed
ticketed unique drivers; the resulting data set contained 262 drivers. Out of
these 262 drivers, 211 were unique and have been analyzed as below.
Distribution of drivers at fault or part fault in injury crashes with speed too
fast for conditions as a factor and matched against the speed ticketed drivers
Table 6.7
Age Male
%
Female % Total %
15-24 101 48%
18
9%
119
56%
Information
25-34 36 17%
8
4%
44
21%
35-44 19 9%
6
3%
25
12%
45-54 12 6%
3
1%
15
7%
55-64 4 2% 1
0%
5
2%
65-74 1 0% 1
0%
2
1%
Official
75-
75+ 1
0% 0
0%
1
0%
Total 174 82% 37
18%
211
100%
the
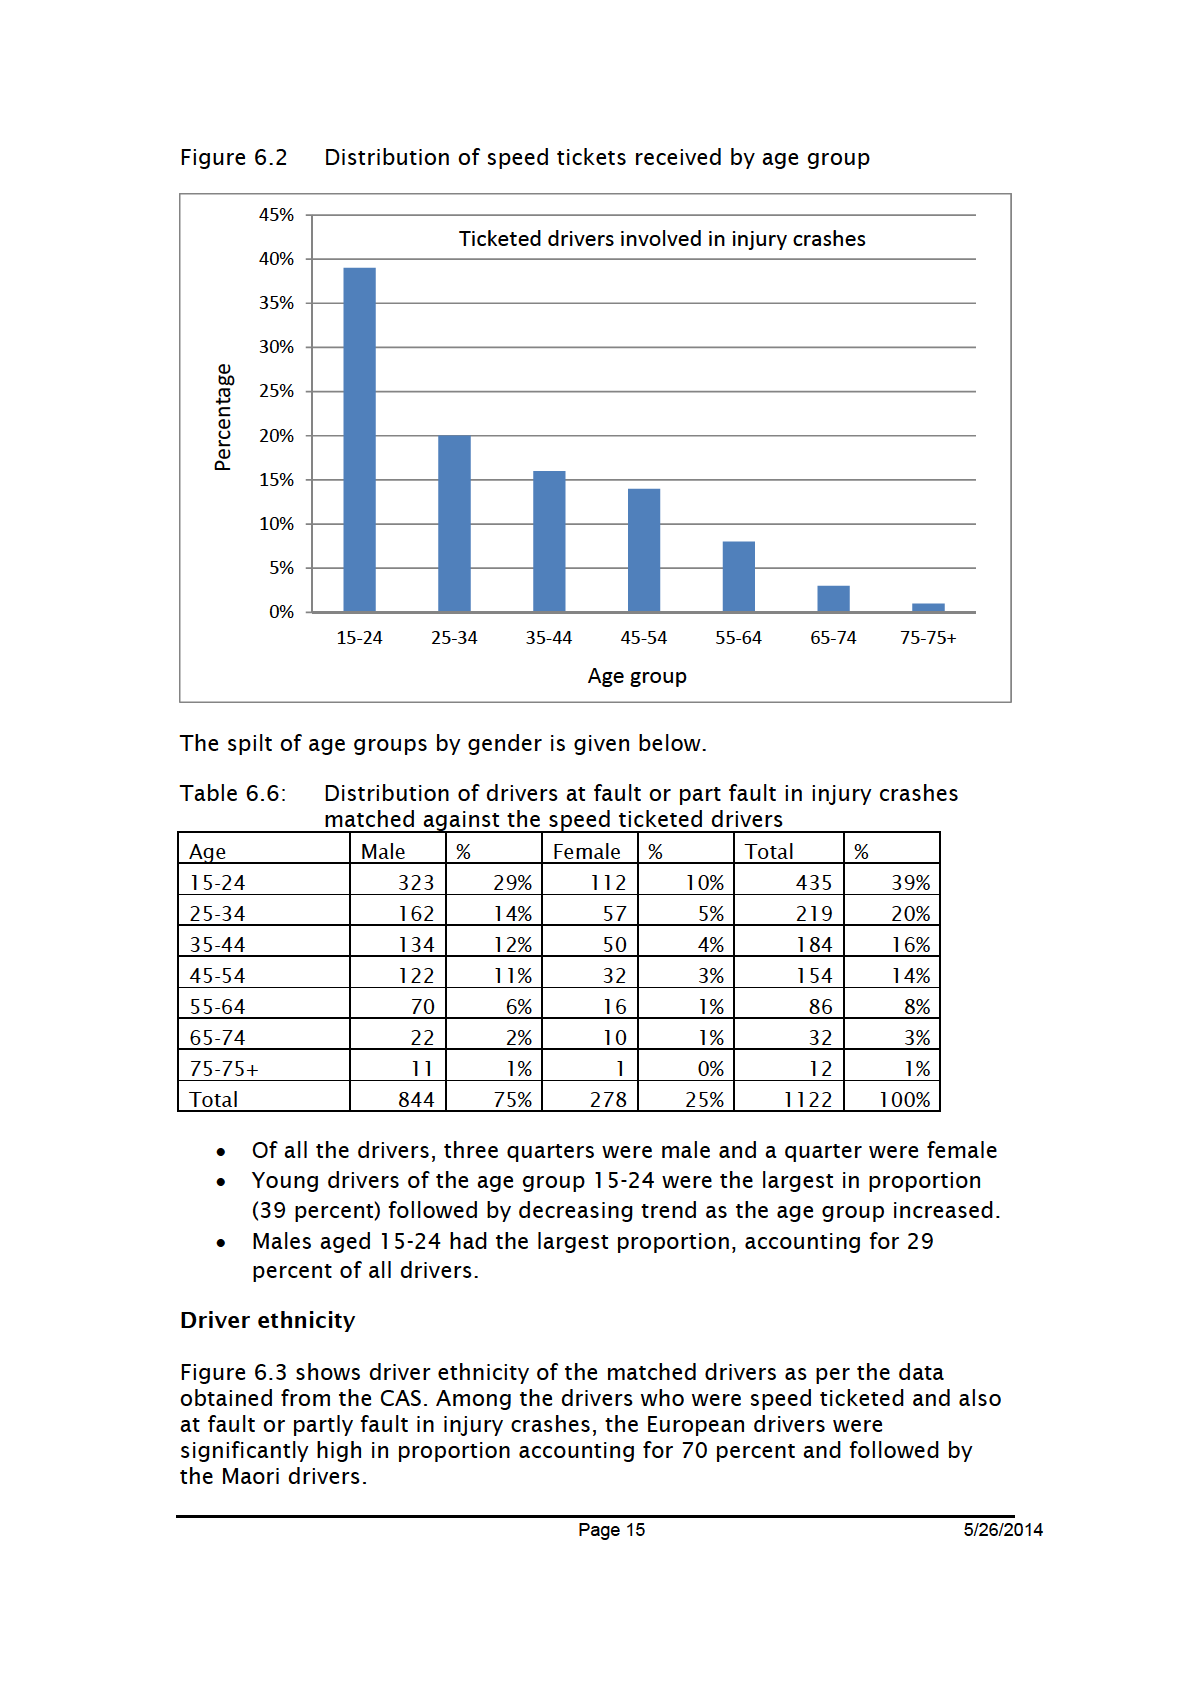
Over eighty percent of all drivers were males
Young drivers of the age group 15-24 were the largest in proportion
(56 percent) followed by decreasing trend as the age group increased.
Males aged 15-24 were nearly half of all drivers (48 percent)
under
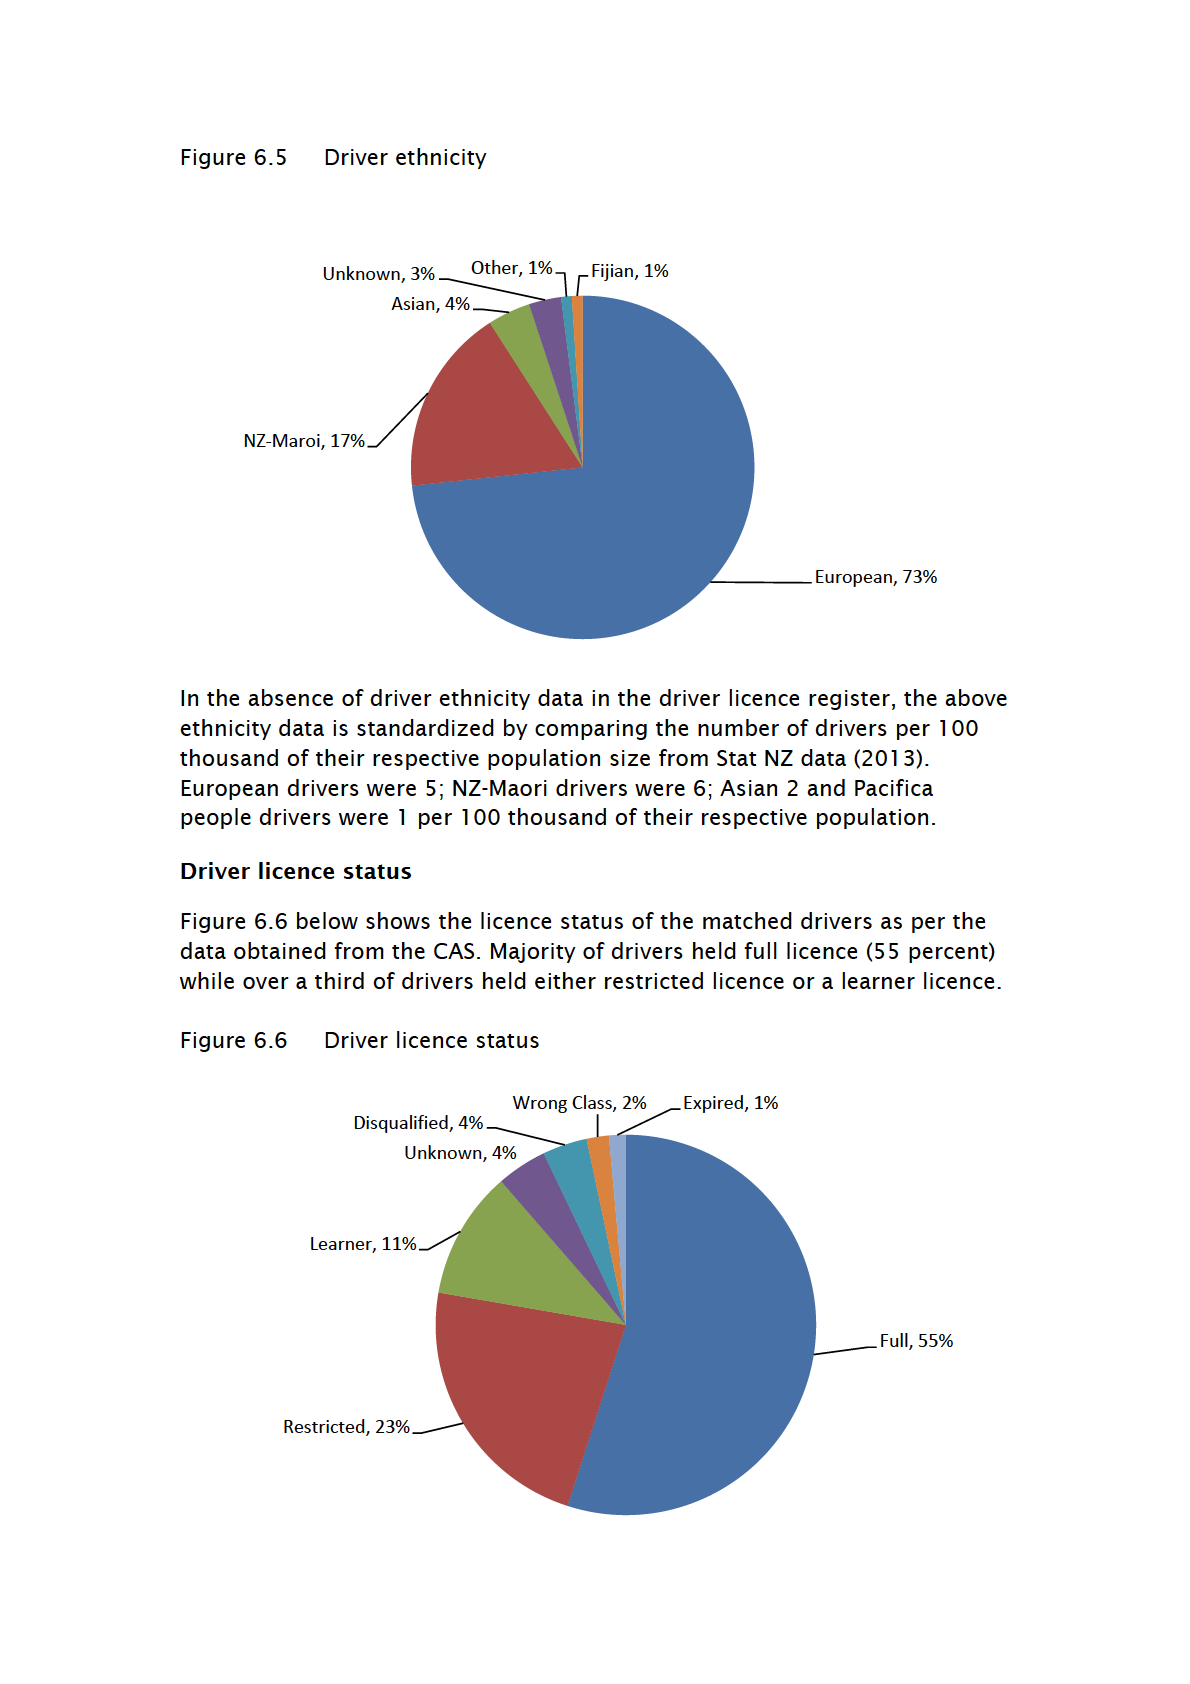
Driver ethnicity
Figure 6.5 below shows driver ethnicity of the matched drivers as per the
data obtained from the CAS. Among the drivers who were speed ticketed and
also at fault or partly fault in injury crashes having speed too fast for
conditions as a crash factor, the European drivers were significantly high in
proportion accounting for nearly three quarters followed by the Maori drivers
accounting nearly a fifth.
Released
Page
17
5/26/2014
1982
Act
Information
Official
the
under
Released
1982
Act
Information
Official
the
under
Released
1982
Act
Information
Official
the
under
Released
1982
Act
Information
Official
the
under
Released
1982
Act
Information
Official
the
under
Released
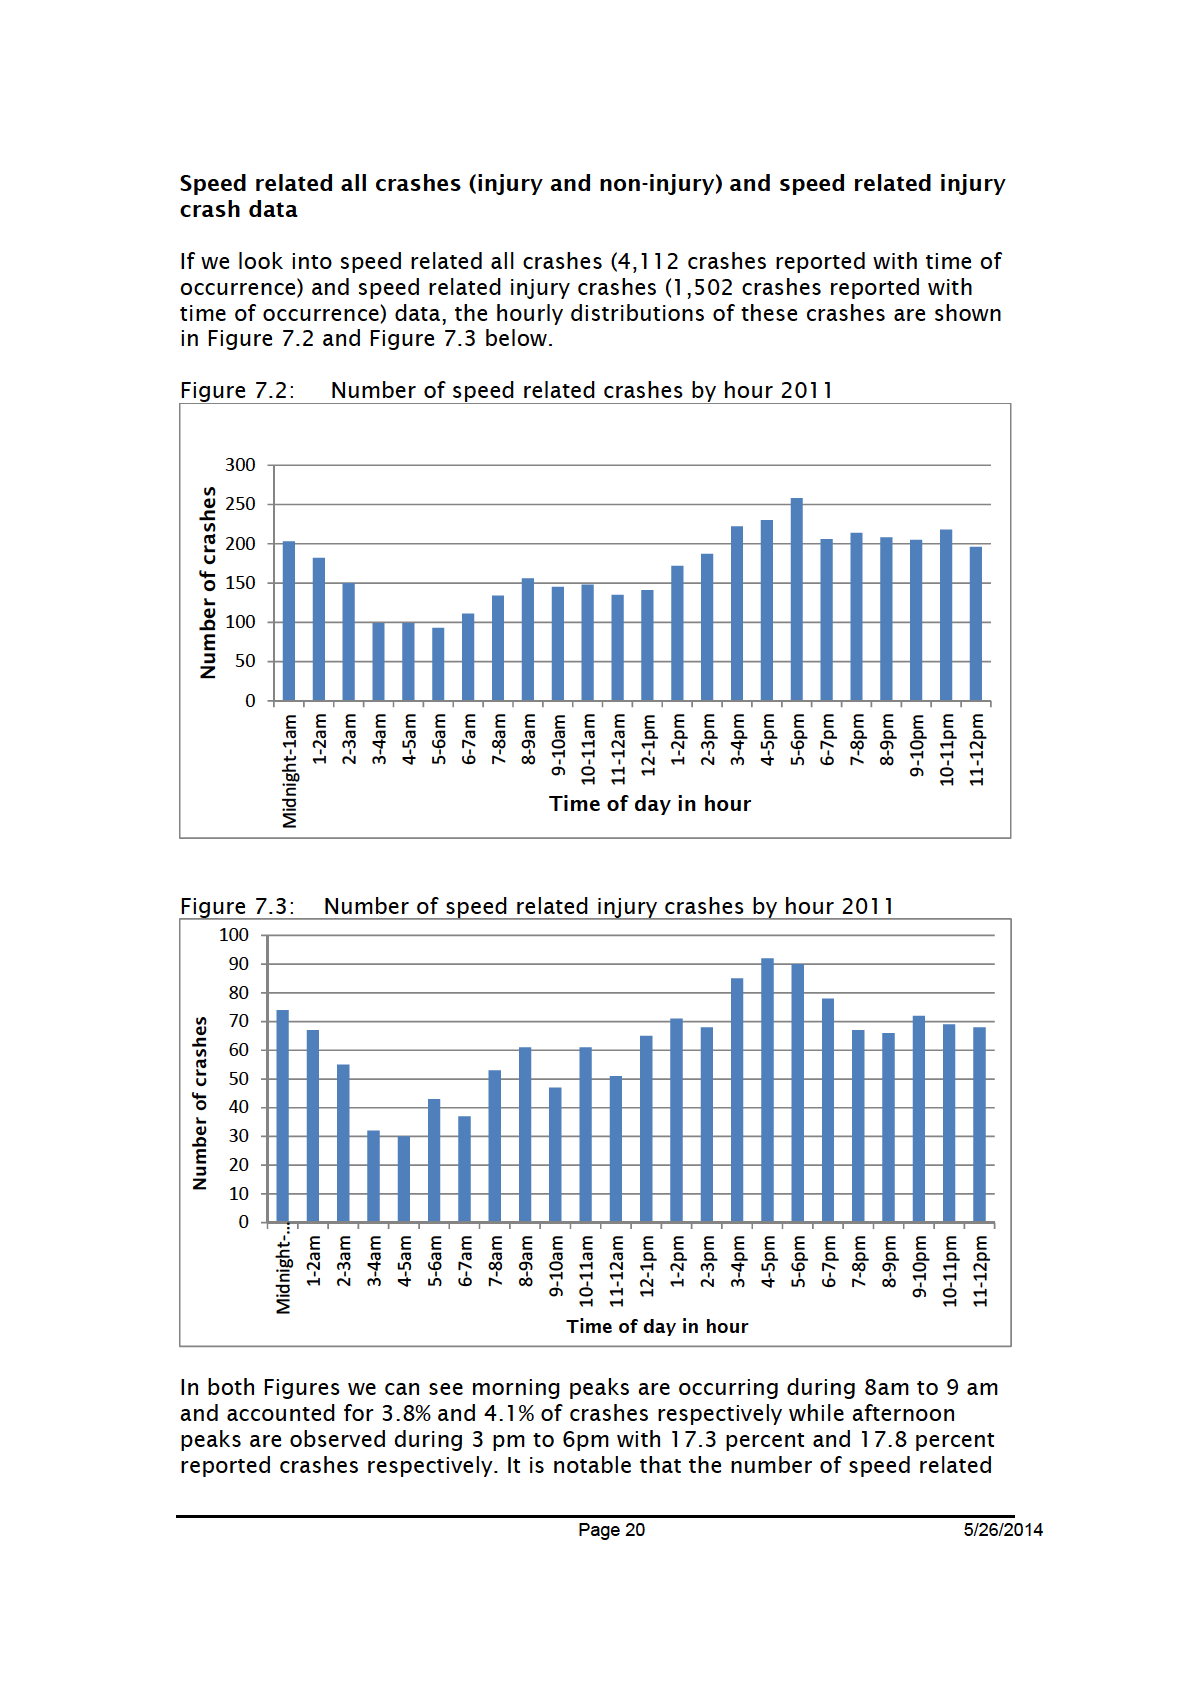
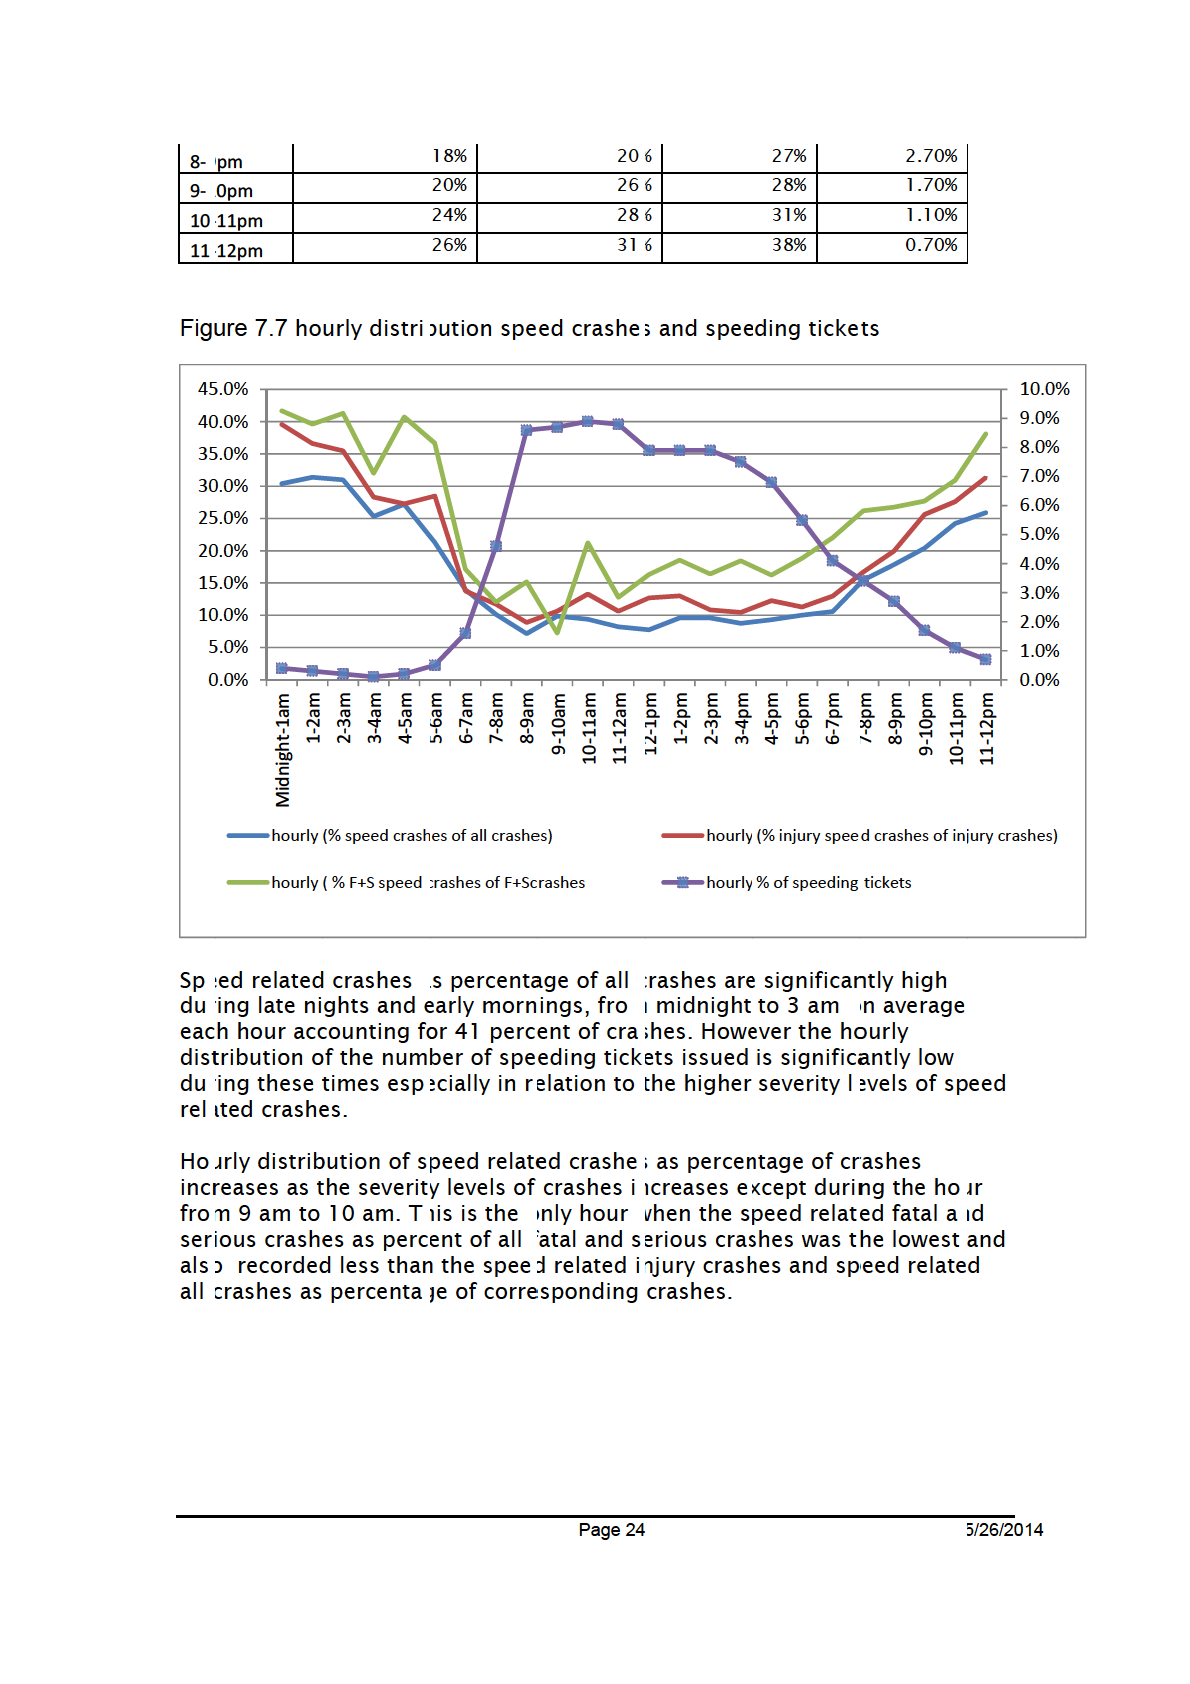
Analysis of the data shows that the number of speeding tickets issued
between 6 am and 6 pm was 85 percent. During the same time frame nearly
half of speed related crashes and two thirds of all crashes occurred. However
during 6am and 6 pm, the number of speeding tickets issued was15%
percent while speed related crashes nearly half of and a third of all crashes.
The time frame with the highest number of speed related fatal and serious
crashes reported was between 3pm to 6 pm (19 percent). Nearly 20 percent
of the speeding tickets were issued during the same time period.
1982
During midnight to 6 am, the lowest number of speeding tickets was issued
(nearly 2 percent) when the reported number of all types of speed related
crashes was nearly 20 percent. This indicates more enforcement activity
during this time period might lower the speed related crashes.
Act
Speed related crashes as proportion by severity of crashes
In 2011 of all the crashes reported 13 percent were speed related, of all the
injury crashes reported16 percent were speed related and of all the fatal and
serious crashes 22 percent were speed related. Percentage distribution of
these speed related crashes occurred during each hour of the day are given
in the table below and compared with the hourly percent distribution of
speeding tickets, summarized in table 7.2 and Figure 7.7 below.
Information
Table 7.2
Time
% of speed
% of injury speed
% of F+S speed hourly % of
crashes of all
crashes of all
crashes of all
speeding
crashes
injury rashes
F+Scrashes
tickets
Midnight‐
30% 40%
42%
0.40%
1am
Official
1‐2am
31% 37%
40%
0.30%
2‐3am
31% 35%
41%
0.20%
3‐4am
25% 28%
32%
0.10%
the
4‐5am
27% 27%
41%
0.20%
5‐6am
21% 28%
37%
0.50%
6‐7am
14% 14%
17%
1.60%
7‐8am
10% 12%
12%
4.60%
8‐9am
7% 9%
15%
8.60%
under
9‐10am
10% 11%
7%
8.70%
10‐11am
9% 13%
21%
8.90%
11‐12am
8% 11%
13%
8.80%
12‐1pm
8% 13%
16%
7.90%
1‐2pm
10% 13%
19%
7.90%
2‐3pm
10% 11%
16%
7.90%
3‐4pm
9% 10%
18%
7.50%
4‐5pm
9% 12%
16%
6.80%
Released
5‐6pm
10% 11%
19%
5.50%
6‐7pm
11% 13%
22%
4.10%
7‐8pm
15% 17%
26%
3.40%
Page
23
5/26/2014
1982
Act
Information
Official
the
under
Released
1982
Act
Information
Official
the
under
Released
1982
Act
Information
Official
the
under
Released
1982
Act
Information
Official
the
under
Released
Drivers involved in non-injury crashes were excluded when they were
matched against speed ticketed drivers as Crash data base does not record
the details about the drivers in case of non-injury crashes.
Missing data field was an issue. Out of total 15,192 drivers involved in injury
crashes in 2011, a tenth of drivers (1570) had a missing driver licence
number which was the primary key for the data linkage between crashed
drivers and speed ticketed drivers. Thus the calculated probability of speed
ticketed drivers being involved in an injury crash which was (0.5 percent) was
likely to be underestimated.
References
Driving Offences and Penalties, Disqualifications and Suspensions, November
2013, Available online
http://www.nzta.govt.nz/resources/factsheets/55/docs/55-driving-offences-and-penalties.pdf
MOT, 2013, The Social Cost of Road Crashes and Injuries, Available online
http://www.transport.govt.nz/assets/Uploads/Research/Documents/Social-Cost-of-Road-
Crashes-and-Injuries-June-2013-update.pdf
Road Policing Programme (RPP), 2011/12 Available online
http://www.nzta.govt.nz/resources/road-policing-programme/docs/rpp-2011-12.pdf
Taylor, R. 1990,
Interpretation of the Correlation coefficient: A Basic Review
http://www.uk.sagepub.com/salkind2study/articles/14Article02.pdf
under the Official Information Act 1982
Released
Page 28
5/26/2014