1982
Act
Information
Official
the
under
Released
IN CONFIDENCE
4. While the indicator tracks death rates across the year, it makes no direct estimates of excess
(or deficit) mortality. However, the indicator provides a clear way of seeing if death rates are
tracking atypically compared to pre-pandemic patterns. An analysis of this death rate is
currently being completed, and will be included in a future COVID-19 Modelling Update Aide-
Memoire.
5. For expediency, we have chosen the COVID-19 Data portal as the initial vessel for publication
with the following considerations:
a. This measure does not look at specific causes of death, it is deaths from all causes.
1982
b. It will be published as an experimental series – currently under review (“NOT official
statistics” wil be noted)5;
Act
c. The series revises frequently, particularly for the most recent weeks, as more deaths
are reported to DIA6;
d. It will be updated weekly.
6. Technical information about the measure, including the code used to construct the measure
wil be published via SNZ’s public GitHub7 for full transparency (the deaths data will not be
included here yet – but may be in the future subject to DIA approval). Because of the sensitivity
of the measure officials are ensuring that the methods are completely transparent. Publication
of technical notes as well as the code ensures this. The technical documentation and code
Information
will be updated as we improve the measure, and as reviews are completed.
7. While the initial solution for this measure is through the SNZ COVID-19 data portal (as an
experimental series), it will likely become a permanent output over time, as it is a useful
measure to track in general.
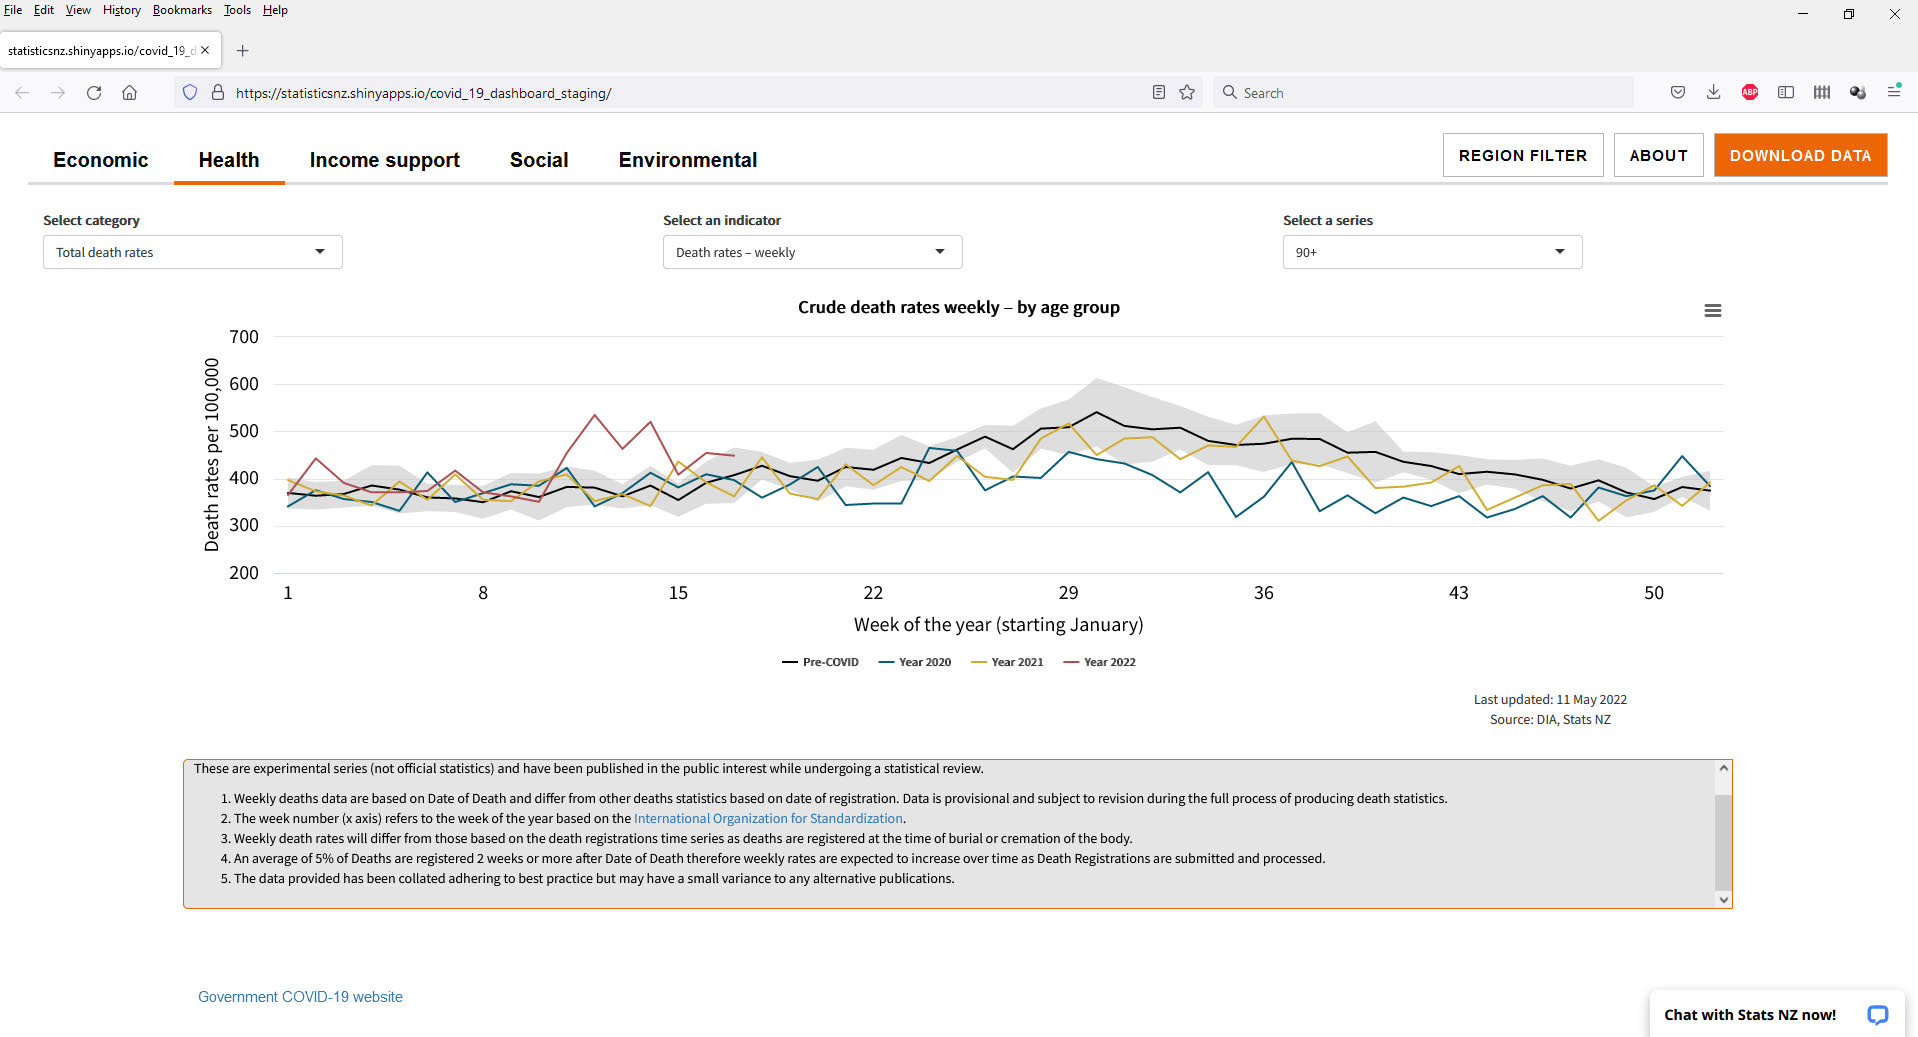
8. SNZ have produced a version of the chart in their user acceptance testing (or ‘staging’)
Official
environment. This is only accessible by SNZ staff, so a screengrab of the chart is included in
Appendix 1.
the
9. The measure will go live once you approve with it. Once live, the public will be able to interact
with the charts and download the computed rates (but not the raw death counts underlying
the computations). We expect there is likely to be some media attention, and will prepare
some reactive questions.
under
Released
5 As SNZ formalise a review internally the “currently under review” tag will be dropped.
6 According to DIA an average of 5% of Deaths are registered 2 weeks or more after Date of Death.
7 Github is an internet platform for hosting the source code for any software product (including an analytical product like the deaths
indicator), along with technical documentation and small datasets if desired in “repositories”. As well as hosting code, it provides
“version control”, meaning changes to the code can be tracked and reverted if necessary. For public repositories it allows anyone
to download and examine the code, and if desired run the code. SNZ’s code is chiefly written in R – an open source free
language. This means that any user can run this code if they so wish.
DPMC 4544266 Page 2 of 3
IN CONFIDENCE
 IN CONFIDENCE
Appendix 1. Screenshots of Excess Mortality Graph Presented on the
IN CONFIDENCE
Appendix 1. Screenshots of Excess Mortality Graph Presented on the
Statistics New Zealand COVID-19 Data Portal
1982
Act
Information
Official
the
under
Released
DPMC 4544266 Page 3 of 3
IN CONFIDENCE