
National Policy Statement on Urban
Development 2020 and 2021
amendments to the Resource
Management Act – Public Opinion
Survey
Research findings of a survey of Aucklanders about the
government's new housing rules and Auckland Council's
preliminary response
Organisation:
Auckland Council
Date:
June, 2022
Prepared by Kantar Public | 8-Jun-22
link to page 3 link to page 5 link to page 6 link to page 7 link to page 10 link to page 22 link to page 30 link to page 36 link to page 37 link to page 39 link to page 40 link to page 42 link to page 51
National Policy Statement on Urban Development 2020 and 2021 amendments to the Resource Management Act –
Public Opinion Survey
Contents
Summary .......................................................................................................................................................................... 1
The task at hand ............................................................................................................................................................... 3
Research methodology .................................................................................................................................................... 4
Awareness and knowledge of the new rules for higher density housing ......................................................................... 5
Intensification inside walkable catchments...................................................................................................................... 8
Intensification around town and local centres ............................................................................................................... 20
Qualifying matters .......................................................................................................................................................... 28
Sentiment towards new rules ........................................................................................................................................ 34
Importance of factors relating to housing development in Auckland ............................................................................ 35
Overall views of population growth ............................................................................................................................... 37
Appendix A: Sample profile ............................................................................................................................................ 38
Appendix B: Support by local board ............................................................................................................................... 40
Appendix C: Questionnaire ............................................................................................................................................ 49
Prepared by Kantar Public | 8-Jun-22
National Policy Statement on Urban Development 2020 and 2021 amendments to the Resource Management Act –
Public Opinion Survey
Summary
Auckland Council commissioned Kantar Public to carry out a representative survey of Aucklanders to measure levels
of support for key aspects of Auckland Council’s preliminary response to the government’s National Policy Statement
on Urban Development 2020 (NPS-UD) and the Resource Management (Enabling Housing Supply and Other Matters)
Amendment Act 2021 (the Act). The survey also measured public awareness, knowledge and sentiment relating to
the new rules, and explored the factors the public perceive are most important in housing development in Auckland.
An online survey of 2,041 Aucklanders aged 18 years and over was carried out from 29 April to 22 May, 2022.
Key findings are:
Awareness and knowledge of the new rules is currently limited (refer pages 5 to 7)
• 65% of Aucklanders have heard of the new rules.
• Just over half (53%) of Aucklanders know something about the new rules (9% ‘a lot’ and 44% ‘a little’), while
the remainder (47%) did not know any of the basic information about the new rules that we presented to
them (see page 6).
Overall sentiment about the new rules is more positive than negative (refer page 34)
• Aucklanders are more likely to feel positively (49%) than negatively (32%) about the new rules. The
remaining are either neutral (16%) or unsure (4%).
Intensification inside walkable catchment areas – half of Aucklanders support each proposal measured, with the
remainder being divided on whether the size should be bigger or smaller (refer pages 8 to 19)
• 50% of Aucklanders support the proposed 1200 metre walkable area from the city centre, 16% did not
support it because they feel it should be bigger and 21% did not support it because they feel it should be
smaller.
• 49% of Aucklanders support the proposed 800 metre walkable area from metropolitan centres, 25% did not
support it because they feel it should be bigger and 14% did not support it because they feel it should be
smaller.
• 52% of Aucklanders support the proposed 800 metre walkable area around train or bus stations, 21% did not
support it because they feel it should be bigger and 14% did not support it because they feel it should be
smaller.
Intensification around town and local centres – just under half of Aucklanders support each proposal measured, with
the remainder being divided on whether the size should be bigger or smaller (refer pages 20 to 27)1
• 49% of Aucklanders support the 400 metre terrace housing and apartment buildings zone around large town
centres, 26% did not support it because they feel it should be bigger and 12% did not support it because they
feel it should be smaller.
• 46% of Aucklanders support the 200 metre terrace housing and apartment buildings zone around small town
centres, 30% did not support it because they feel it should be bigger and 10% did not support it because they
feel it should be smaller.
1 Erratum: Please note, Auckland Council made an error in the survey questionnaire at questions 8 and 9: The number of
building storeys allowed in the Terrace Housing and Apartment Buildings Zone is five storeys not four storeys.
Consideration of the results arising from these questions should be tempered by this error.
Prepared by Kantar Public | 8-Jun-22
Page | 1
National Policy Statement on Urban Development 2020 and 2021 amendments to the Resource Management Act –
Public Opinion Survey
There is majority support for Auckland Council’s proposals for qualifying matters relating to special character areas
and infrastructure (refer pages 28 to 33)
• 66% of Aucklanders support the exemption for special character areas.
• 65% of Aucklanders support the exemption for areas with infrastructure that do not support population
growth.
Adequate infrastructure tops the list of what’s of greatest importance to Aucklanders in planning for more housing
(refer pages 35 to 36)
• The top factors that are perceived to be of greatest importance to Aucklanders in planning for more housing
in Auckland are:
o Infrastructure that can cope (62%)
o Decisions that result in less traffic congestion (34%)
o Enough housing for everyone (26%)
o Protecting special character areas (22%)
o Building housing that is close to current transport, shops, community services (20%).
Prepared by Kantar Public | 8-Jun-22
Page | 2
National Policy Statement on Urban Development 2020 and 2021 amendments to the Resource Management Act –
Public Opinion Survey
The task at hand
Auckland Council has consulted on its proposed approach to implementing the government’s National Policy
Statement on Urban Development (NPS-UD) and the Resource Management (Enabling Housing Supply and Other
Matters) Amendment Act 2021 (the Act).
Aucklanders were able to provide feedback on Auckland Council’s consultation document through several channels
(online, email, post, and virtual feedback events). In addition to this, Auckland Council needed an independent,
robust, and representative survey of Aucklanders to ascertain their level of support for Auckland Council’s proposals
for implementing the NPS-UD. This was needed to run in parallel with Auckland Council’s own public consultation.
To this end, Auckland Council commissioned Kantar Public to carry out an independent online survey of
approximately 2,000 Aucklanders across the region. Insights from the survey will support local government decision
making in relation to implementing the NPS-UD.
Research objectives
The research was designed to measure:
1. Levels of support for Council’s key proposals for implementing the NPS-UD.
2. Levels of awareness, knowledge and sentiment related to the intent and requirements of the NPS-UD.
3. What Aucklanders think is most important for Government and Auckland Council to consider when planning
for more housing in Auckland.
4. Overall views on population growth in Auckland.
This report presents the survey findings and methodology Kantar Public used to carry out the research.
Prepared by Kantar Public | 8-Jun-22
Page | 3
National Policy Statement on Urban Development 2020 and 2021 amendments to the Resource Management Act –
Public Opinion Survey
Research methodology
Kantar Public carried out an online survey of 2,041 Auckland residents aged 18 years and older from 29 April to 22
May, 2022.
Online survey fieldwork
The online survey was conducted using Kantar’s and Dynata’s online panels.
Quotas were set on age by gender, and ethnicity to ensure a demographically representative sample. The first half of
fieldwork focused on ensuring quotas on household income by household size were met, to ensure the sample was
representative of all socio-economic groups. This was especially important given the different potential impacts of
higher density housing on low and high income households. Local board quotas were also set, with the aim of
achieving a robust number of interviews in each local board – at least 100 interviews were conducted in each local
board except Waiheke and Great Barrier.
Maximum margin of error
The maximum margin of error on the total sample size of 2,041 is +/-2.2%2 (at the 95% confidence level and
assuming simple random sampling).
Weighting
Survey data were weighted to align with Statistics New Zealand 2018 Census population demographic characteristics:
age by gender, ethnicity, and local board area. Statistics New Zealand Household Economic Survey data was used to
weight the data to estimated population household income by household size characteristics.
Questionnaire development
The questionnaire was developed by a senior researcher at Kantar Public in collaboration with Auckland Council. The
draft questionnaire was cognitively tested with six Auckland residents, in a video call setting, to test respondent
comprehension and interpretation of the survey questions. The final questionnaires incorporated revisions made to
draft versions following the cognitive testing. Further information on the cognitive testing methodology can be found
in Appendix A.
The average interview length was nine minutes. The questionnaire is appended to this report in Appendix D.
2 The disproportionate sampling approach used in targeting local boards has been considered in calculating this estimated
sampling error.
Prepared by Kantar Public | 8-Jun-22
Page | 4
National Policy Statement on Urban Development 2020 and 2021 amendments to the Resource Management Act –
Public Opinion Survey
Awareness and knowledge of the new rules for higher density housing
This section examines Aucklanders’ awareness and knowledge of the new rules for higher density housing in
Auckland. A key purpose of these questions was to systematically take respondents through important contextual
information about the new housing rules before asking them about their support of the exemptions and walkable
areas proposed by Auckland Council. The survey questions did not specifically refer to the NPS-UD or Resource
Management Amendment Act as it was deemed this would create unnecessary technical complexity.
Awareness of the new housing rules
All respondents were initially provided with a short description of the new rules for higher density housing.
Specifically, the information they were shown is below:
The Government has made new rules on higher density housing that Councils have to follow. These new rules
are being put in place to allow more higher density and taller housing to boost the supply of housing in New
Zealand.
Respondents were then asked if they had heard of these new rules. Results are shown in the chart below.
Awareness of new housing rules
65%
aware
Base: All respondents (2,041)
Source: Q1
Two thirds (65%) of Aucklanders have heard of the new rules.
Awareness is higher among:
• Those on higher incomes (75% of those with household income over $150,000)
• Homeowners (73%)
• Older Aucklanders (75% of those aged 50+)
• NZ Europeans (71%)
• Those living in Albert-Eden (80%), Orākei (79%).
Awareness is lower among:
• Younger Aucklanders (55% of those aged under 40)
• Asian Aucklanders (56%), Māori (54%), and Pacific Aucklanders (48%)
Prepared by Kantar Public | 8-Jun-22
Page | 5
National Policy Statement on Urban Development 2020 and 2021 amendments to the Resource Management Act –
Public Opinion Survey
• Those on lower incomes (59% of those with household income $70,000 or less)
• Renters (50%)
• Those living in Otara-Papatoetoe (48%), Henderson-Massey (54%).
Knowledge of the new housing rules
Respondents were then given some information about how the new rules will work as shown below:
This is how the new rules will work:
•
The plan is for taller and higher density housing in areas close to public transport stops, centres with
shops, jobs, and community centres.
•
Housing of at least six storeys (high density housing) will be allowed around the Auckland city centre and
other large Auckland urban centres, and around train and bus stations.
•
Housing of up to four storeys around many of our suburban town centres
•
Housing of up to three storeys (medium density housing) will be allowed in most other residential areas
across Auckland.
•
The new rules also allow exemptions to the higher density rules if a property or area has certain special
features or characteristics (these are called ‘qualifying matters’).
Respondents were asked how much of this information they knew before doing the survey. Results are below.
Knowledge of new housing rules
I knew a lot about this
information
I had not heard of the
new rules before today
9%
25%
%
I had heard of the
I knew a little bit about
new rules, but
this information
did not know any
44%
of this
information
22%
Base: All respondents (2,041)
Source: Q2
Very few Aucklanders had prior in-depth knowledge about the new housing rules; just 9% knew a lot about this
information. Just over half (53%) knew at least some of this information (‘a lot’ or ‘a little’).
Prepared by Kantar Public | 8-Jun-22
Page | 6
National Policy Statement on Urban Development 2020 and 2021 amendments to the Resource Management Act –
Public Opinion Survey
Knowledge (either ‘a lot’ or ‘a little’) is higher among:
• Those on higher incomes (63% of those with household income over $150,000)
• Homeowners (61%)
• Aucklanders aged 40+ (62%)
• NZ Europeans (60%)
• Those living in Albert-Eden (67%), Devonport-Takapuna (68%), Orākei (70%).
Knowledge (either ‘a lot’ or ‘a little’) is lower among:
• Younger Aucklanders (42% of those aged under 40)
• Asian Aucklanders (43%) and Pacific Aucklanders (34%)
• Renters (40%).
Prepared by Kantar Public | 8-Jun-22
Page | 7
National Policy Statement on Urban Development 2020 and 2021 amendments to the Resource Management Act –
Public Opinion Survey
Intensification inside walkable catchments
This section examines levels of support for Auckland Council’s proposed walkable catchment areas. Before being
asked whether they support various walkable catchment areas respondents were shown the following information:
Auckland Council must follow the Government’s new rules, but Auckland Council needs to decide on some
factors that affect how the rules will be applied. The next few questions are about these decisions.
Please read the following information carefully before moving to the next screen.
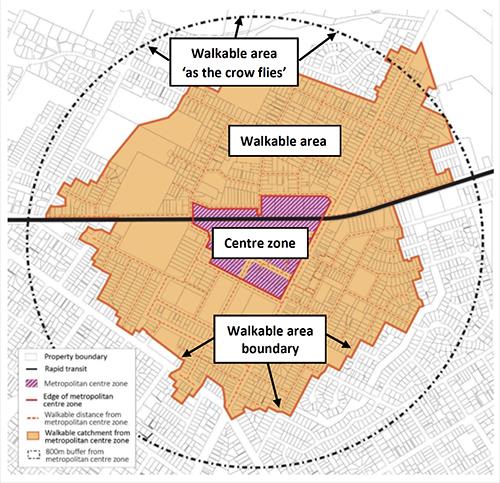
Auckland Council must make decisions about walkable areas. A walkable area is the area around a centre,
train station or busway stop from which an average person could walk to get to that place. See the orange
zone in the diagram.
The new housing rules mean that buildings of six storeys or more can be built in the walkable areas. This will
mean more people can live close to urban centres for things like shopping, entertainment, community
services, meeting friends, and public transport.
This will also help to reduce congestion and greenhouse gas emissions, with people driving shorter distances
to reach the places and services they need.
Prepared by Kantar Public | 8-Jun-22
Page | 8
National Policy Statement on Urban Development 2020 and 2021 amendments to the Resource Management Act –
Public Opinion Survey
Support for 1200 metre walkable catchment from city centre
Respondents were shown the following information before being asked their support for the 1200 metre walkable
area around the city centre.
The Government requires Auckland Council to decide on the size of the walkable area where housing with
six or more storeys can be built.
The Council is proposing a walkable area of 1200 metres (about a 15-minute walk) from the city centre, or
the ‘city fringe’ (e.g. Ponsonby, Eden Terrace, Parnell, Grafton).
Prepared by Kantar Public | 8-Jun-22
Page | 9
National Policy Statement on Urban Development 2020 and 2021 amendments to the Resource Management Act –
Public Opinion Survey
Half of Aucklanders support the 1200 metre walkable area around the city centre. Over a third (37%) do not support
the size, with these Aucklanders somewhat divided over whether it should be bigger (16%) or smaller (21%).
Support for 1200 metre city centre catchment area
11%
Don’t know/ don’t have enough
2%
information to say
Other
21%
Do not support - area should
be smaller
50% Support –
1200m is appropriate
16%
Do not support - area should be
bigger
Base: All respondents (2,041)
Source: Q5
Prepared by Kantar Public | 8-Jun-22
Page | 10
National Policy Statement on Urban Development 2020 and 2021 amendments to the Resource Management Act –
Public Opinion Survey
Level of support by region
The next two charts show support levels by Auckland sub-region and local board area respectively. Most local boards
show small majorities of support, while nine local boards have support below 50%. However, the lack of support in
these local boards is divided over whether the size should be bigger or smaller.
Support for 1200 metre city centre walkable area by area
✓ = Support
B = Area should be bigger
S = Area should be smaller
O = Other
DK = Don’t know
North
HIBISCUS AND BAYS
✓ = 52%
B = 16%
RODNEY
S = 22%
UPPER HARBOUR
O = 3%
DK = 7%
DEVONPORT -
KAIPATIKI
TAKAPUNA
Central
✓ = 51%
WAITEMATA
B = 16%
HENDERSON MASSEY
ALBERT/EDEN
ORAKEI
S = 23%
West
O = 2%
WHAU
MAUNGAKIEKIE
TAMAKI
WAITAKERE RANGES
PUKETAPAPA
HOWICK
✓ = 46%
DK = 9%
B = 18%
OTARA-
S = 17%
PAPATOETOE
MANGERE-
OTAHUHU
O = 2%
MANUREWA
DK = 16%
PAPAKURA
South
✓ = 48%
FRANKLIN
B = 15%
S = 20%
Base: varies by sub-region (316 – 630)
O = 3%
Source: Q5
DK = 14%
Support for 1200 metre city centre walkable area by local board
✓ = Support
Colour coding is based on support for
B = Area should be bigger
the proposed building zone
S = Area should be smaller
Less than 50%
O = Other
50% - 59%
DK = Don’t know
60% +
Rodney | ✓ = 53%, B = 13%, S = 25%, O = 4%, DK = 5%
Hibiscus and Bays | ✓ = 60%, B = 18%, S = 18%, O = 3%, DK = 1%
Devonport-Takapuna | ✓ = 45%, B = 11%, S = 32%, O = 3%, DK = 10%
Kaipātiki | ✓ = 56%, B = 15%, S = 18%, O = 3%, DK = 8%
Upper Harbour | ✓ = 40%, B = 22%, S = 21%, O = 3%, DK = 14%
Waitematā | ✓ = 43%, B = 18%, S = 28%, O = 2%, DK = 9%
Henderson-Massey | ✓ = 43%, B = 20%, S = 19%, O = 1%, DK = 17%
Ōrākei | ✓ = 50%, B = 15%, S = 28%, O = 2%, DK = 4%
Albert-Eden | ✓ = 55%, B = 16%, S = 16%, O = 2%, DK = 12%
Maungakiekie-Tāmaki | ✓ = 48%, B = 18%, S = 23%, O = 2%, DK = 8%
Whau | ✓ = 47%, B = 18%, S = 16%, O = 4%, DK = 15%
Howick | ✓ = 51%, B = 15%, S = 22%, O = 5%, DK = 7%
Waitākere Ranges | ✓ = 53%, B = 12%, S = 17%, O =2%, DK = 16%
Puketāpapa | ✓ = 60%, B = 10%, S = 21%, O = 1%, DK = 8%
Ōtara-Papatoetoe | ✓ = 49%, B = 16%, S = 19%, O = 2%, DK = 14%
Māngere- Ōtāhuhu | ✓ = 53%, B = 7%, S = 17%, O = -, DK = 23%
Manurewa | ✓ = 41%, B = 20%, S = 16%, O = 1%, DK = 21%
Papakura | ✓ = 44%, B = 14%, S = 23%, O = 2%, DK = 17%
Franklin | ✓ = 50%, B = 18%, S = 25%, O = 3%, DK = 4%
*Results in some local boards do not
Base: varies by local board (102 – 110)
exactly sum to 100% due to rounding
Prepared by Kantar Public | 8-Jun-22
Page | 11

National Policy Statement on Urban Development 2020 and 2021 amendments to the Resource Management Act –
Public Opinion Survey
Demographic variations
Support for the 1200 metre city centre catchment area is higher among:
• 30-39 year olds (58%)
• Those living in Hibiscus and Bays (60%)
Support for the 1200 metre city centre catchment area is lower among:
• Older Aucklanders (41% of those aged 60+)
• Those on very low incomes (38% of those with household income $30,000 or less).
Older Aucklanders are significantly more likely to agree the area should be smaller than 1200 metres (32% of those
aged 60+, compared to 21% overall), while younger Aucklanders are more likely to think the area should be bigger
(24% of those aged under 30, compared to 16% overall).
Support for 800 metre walkable area around metropolitan centres
Respondents were shown the following information before being asked if they support the 800 metre walkable area
around metropolitan centres.
The Council is proposing a walkable area of 800 metres (about a 10-minute walk) from the edge of the big
metropolitan centres.
The metropolitan centres are Albany, Takapuna, Westgate, Henderson, New Lynn, Newmarket, Sylvia Park,
Botany, Manukau, Papakura and Pukekohe.
Prepared by Kantar Public | 8-Jun-22
Page | 12
National Policy Statement on Urban Development 2020 and 2021 amendments to the Resource Management Act –
Public Opinion Survey
Nearly half of Aucklanders (49%) support the 800 metre walkable area from the edge of big metropolitan centres.
Thirty nine percent do not support this proposal, with a skew towards those thinking it should be bigger (25%) rather
than smaller (14%).
Support for 800 metre walkable area around metropolitan centres
10%
Don’t know/ don’t have enough
2%
information to say
Other
14%
Do not support - area should
be smaller
49% Support –
800m is appropriate
25%
Do not support - area should be
bigger
Base: All respondents (2,041)
Source: Q6
Prepared by Kantar Public | 8-Jun-22
Page | 13
National Policy Statement on Urban Development 2020 and 2021 amendments to the Resource Management Act –
Public Opinion Survey
Level of support by region
The next two charts show support levels by Auckland sub-region and local board area respectively. Most local boards
have less than majority support (lower than 50%). In these local boards, residents are split on whether the area
should be bigger or smaller. The remaining five local boards have majority support (50% or more) with support in one
exceeding 60%.
Support for 800 metre metropolitan centre walkable area by area
✓ = Support
B = Area should be bigger
S = Area should be smaller
O = Other
DK = Don’t know
North
HIBISCUS AND BAYS
✓ = 52%
B = 22%
RODNEY
S = 16%
UPPER HARBOUR
O = 3%
DK = 8%
DEVONPORT -
KAIPATIKI
TAKAPUNA
Central
✓ = 49%
WAITEMATA
B = 28%
HENDERSON MASSEY
ALBERT/EDEN
ORAKEI
S = 12%
West
O = 1%
WHAU
MAUNGAKIEKIE
TAMAKI
WAITAKERE RANGES
PUKETAPAPA
HOWICK
✓ = 46%
DK = 10%
B = 28%
OTARA-
S = 11%
PAPATOETOE
MANGERE-
OTAHUHU
O = 3%
MANUREWA
DK = 12%
PAPAKURA
South
✓ = 48%
FRANKLIN
B = 23%
S = 16%
Base: varies by sub-region (316-630)
O = 2%
Source: Q6
DK = 11%
Prepared by Kantar Public | 8-Jun-22
Page | 14
National Policy Statement on Urban Development 2020 and 2021 amendments to the Resource Management Act –
Public Opinion Survey
Support for 800 metre metropolitan centre walkable area by local board
✓ = Support
Colour coding is based on support for
B = Area should be bigger
the proposed building zone
S = Area should be smaller
Less than 50%
O = Other
50% - 59%
DK = Don’t know
60% +
Rodney | ✓ = 52%, B = 19%, S = 13%, O = 4%, DK = 12%
Hibiscus and Bays | ✓ =61%, B = 21%, S = 12%, O = 3%, DK = 2%
Devonport-Takapuna | ✓ = 49%, B = 17%, S = 22%, O = 3%, DK = 9%
Kaipātiki | ✓ = 47%, B = 26%, S = 15%, O = 3%, DK = 8%
Upper Harbour | ✓ = 45%, B = 24%, S = 19%, O = 1%, DK = 11%
Waitematā | ✓ = 38%, B = 34%, S = 16%, O = -, DK = 13%
Henderson-Massey | ✓ = 46%, B = 31%, S =8%, O =1%, DK = 14%
Ōrākei | ✓ = 59%, B = 29%, S = 5%, O = 2%, DK = 5%
Albert-Eden | ✓ = 48%, B = 24%, S = 11%, O = 1%, DK = 15%
Maungakiekie-Tāmaki | ✓ = 47%, B = 29%, S = 16%, O = 1%, DK = 8%
Whau | ✓ = 47%, B = 25%, S = 14%, O = 5%, DK = 9%
Howick | ✓ = 46%, B = 23%, S = 22%, O = 3%, DK = 6%
Waitākere Ranges | ✓ = 45%, B = 27%, S = 12%, O = 2%, DK = 14%
Puketāpapa | ✓ = 56%, B = 24%, S = 11%, O = 1%, DK = 8%
Ōtara-Papatoetoe | ✓ = 49%, B = 27%, S = 14%, O = -, DK = 10%
Māngere- Ōtāhuhu | ✓ = 58%, B = 10%, S = 9%, O = 2%, DK = 21%
Manurewa | ✓ = 45%, B = 26%, S = 12%, O = 2%, DK = 15%
Papakura | ✓ = 47%, B = 22%, S = 18%, O = 3%, DK = 10%
Franklin | ✓ =46%, B = 29%, S = 14%, O = 4%, DK = 7%
*Results in some local boards do not
Base: varies by local board (102-110)
exactly sum to 100% due to rounding
Demographic variations
Support for the 800 metre metropolitan walkable area is highest among those living in Hibiscus and Bays (61%), and
lowest among those living in Waitematā (38%).
Aucklanders aged under 30, renters and those in living in Waitematā are most likely to think the area should be
bigger than 800 metres (31%, 30% and 34% respectively, compared to 25% overall).
Prepared by Kantar Public | 8-Jun-22
Page | 15
National Policy Statement on Urban Development 2020 and 2021 amendments to the Resource Management Act –
Public Opinion Survey
Support for 800 metre walkable area around train or busway stations
Respondents were shown the following information before being asked if they support the 800 metre walkable area
around train or busway stations.
The Council is proposing a walkable area of 800 metres (about a 10-minute walk) around a train station or
a Northern Busway station.
Prepared by Kantar Public | 8-Jun-22
Page | 16
National Policy Statement on Urban Development 2020 and 2021 amendments to the Resource Management Act –
Public Opinion Survey
About half of Aucklanders support the 800 metre catchment area around train or busway stations, 21% think it
should be bigger and 14% think it should be smaller.
Support for 800 metre walkable area around train and busway stations
10%
Don’t know/ don’t have enough
2%
information to say
Other
14%
Do not support - area should
be smaller
52% Support –
800m is appropriate
21%
Do not support - area should be
bigger
Base: All respondents (2,041)
Source: Q7
Prepared by Kantar Public | 8-Jun-22
Page | 17
National Policy Statement on Urban Development 2020 and 2021 amendments to the Resource Management Act –
Public Opinion Survey
Level of support by region
The next two charts show support levels by Auckland sub-region and local board area respectively. Most local boards
have small majorities of support while two have support that exceeds 60%. Seven local boards have less than
majority support (lower than 50%), with residents in most of these local boards divided on whether the area should
be bigger or smaller.
Support for 800 metre walkable area around train and busway stations by area
✓ = Support
B = Area should be bigger
S = Area should be smaller
O = Other
DK = Don’t know
North
HIBISCUS AND BAYS
✓ = 54%
B = 19%
RODNEY
S = 17%
UPPER HARBOUR
O = 3%
DK = 8%
DEVONPORT -
KAIPATIKI
TAKAPUNA
Central
✓ = 52%
WAITEMATA
B = 24%
HENDERSON MASSEY
ALBERT/EDEN
ORAKEI
S = 14%
West
O = 2%
WHAU
MAUNGAKIEKIE
TAMAKI
WAITAKERE RANGES
PUKETAPAPA
HOWICK
✓ = 48%
DK = 9%
B = 26%
OTARA-
S = 12%
PAPATOETOE
MANGERE-
OTAHUHU
O = 2%
MANUREWA
DK = 12%
PAPAKURA
South
✓ = 52%
FRANKLIN
B = 20%
S = 14%
Base: varies by sub-region (316-630)
O = 3%
Source: Q7
DK = 12%
Support for 800 metre walkable area around train and busway stations local board
✓ = Support
Colour coding is based on support for
B = Area should be bigger
the proposed building zone
S = Area should be smaller
Less than 50%
O = Other
50% - 59%
DK = Don’t know
60% +
Rodney | ✓ = 49%, B = 18%, S = 17%, O = 5%, DK = 11%
Hibiscus and Bays | ✓ = 60%, B = 19%, S = 14%, O = 2%, DK = 4%
Devonport-Takapuna | ✓ = 54%, B = 16%, S = 18%, O = 3%, DK = 8%
Kaipātiki | ✓ = 55%, B = 18%, S = 16%, O = 2%, DK = 9%
Upper Harbour | ✓ = 48%, B = 21%, S = 21%, O = 1%, DK = 9%
Waitematā | ✓ = 44%, B = 30%, S = 12%, O = 1%, DK = 13%
Henderson-Massey | ✓ = 46%, B = 31%, S = 9%, O = 2%, DK = 12%
Ōrākei | ✓ = 57%, B = 25%, S = 10%, O = 3%, DK = 5%
Albert-Eden | ✓ = 52%, B = 18%, S = 19%, O = 1%, DK = 10%
Maungakiekie-Tāmaki | ✓ = 50%, B = 24%, S = 17%, O = 4%, DK = 6%
Whau | ✓ = 48%, B = 21%, S = 16%, O = 3%, DK = 12%
Howick | ✓ = 54%, B = 19%, S = 14%, O = 4%, DK = 10%
Waitākere Ranges | ✓ = 50%, B = 22%, S = 12%, O = 3%, DK = 14%
Puketāpapa | ✓ = 60%, B = 20%, S = 11%, O = -, DK = 9%
Ōtara-Papatoetoe | ✓ = 49%, B = 22%, S = 15%, O = 3%, DK = 11%
Māngere- Ōtāhuhu | ✓ = 55%, B = 11%, S = 12%, O = 2%, DK = 19%
Manurewa | ✓ = 46%, B = 25%, S = 13%, O = 2%, DK = 13%
Papakura | ✓ = 52%, B = 17%, S = 16%, O = 3%, DK = 12%
Franklin | ✓ = 53%, B = 24%, S = 12%, O = 2%, DK = 9%
*Results in some local boards do not
Base: varies by local board (102-110)
exactly sum to 100% due to rounding
Prepared by Kantar Public | 8-Jun-22
Page | 18
National Policy Statement on Urban Development 2020 and 2021 amendments to the Resource Management Act –
Public Opinion Survey
Demographic variations
There are no notable differences between groups for level of support for the 800 metre walkable around train or
busway stations. Younger Aucklanders are most likely to think the 800 metre area should be bigger (28% of those
under 30, compared to 17% of those aged 60+).
Prepared by Kantar Public | 8-Jun-22
Page | 19
National Policy Statement on Urban Development 2020 and 2021 amendments to the Resource Management Act –
Public Opinion Survey
Intensification around town and local centres3
This section examines whether Aucklanders support Auckland Council’s proposed terrace housing and apartment
building zones. First, respondents were shown the following information.
These next questions are about allowing higher-density housing to be built in and around suburban town
centres in Auckland.
The Government wants more people to live closer to these centres so that more people can walk to shops
and services.
The residential area around a centre that allows for higher-density housing of up to four storeys to be built
is called the Terrace Housing and Apartment Buildings zone.
By terrace housing, we mean rows of houses that share both side walls with neighbouring properties.
Support for 400 metre terrace housing and apartment buildings zone around large town
centres
Respondents were shown the following information and then asked their level of support for the 400 metre terrace
housing and apartment building zone around large town centres. Where appropriate, examples of large town centres
shown were tailored to the local board in which each respondent lived.
The Council is proposing to put the Terrace Housing and Apartment Buildings zone in an area around 400
metres (about a 5-minute walk) from large town centres.
Large town centres are larger suburban centres in Auckland, with a wide range of shops, services and
activities. They are not as large as the metropolitan centres. Examples are (TAILOR TO RESPONDENT’S
LOCAL BOARD).
3 Erratum: Please note, Auckland Council made an error in the survey questionnaire at questions 8 and 9: The number of
building storeys allowed in the Terrace Housing and Apartment Buildings Zone is five storeys not four storeys.
Consideration of the results arising from these questions should be tempered by this error. This relates to results shown on
pages 21 to 27.
Prepared by Kantar Public | 8-Jun-22
Page | 20

National Policy Statement on Urban Development 2020 and 2021 amendments to the Resource Management Act –
Public Opinion Survey
Half (49%) of Aucklanders support the proposed 400 metre terrace housing and apartment building zone around
large town centres, 26% think the area should be bigger and 12% think it should be smaller.
Support for 400 metre terrace housing and apartment buildings zone around large town centres
9%
Don’t know/ don’t have enough
4%
information to say
Other
12%
Do not support - area should
be smaller
49% Support –
400m is appropriate
26%
Do not support - area should be
bigger
Base: All respondents (2,041)
Source: Q8
Prepared by Kantar Public | 8-Jun-22
Page | 21
National Policy Statement on Urban Development 2020 and 2021 amendments to the Resource Management Act –
Public Opinion Survey
Level of support by region
The next two charts show support levels by Auckland sub-region and local board area respectively. Nine local boards
show small majorities of support, while in one local board support is less than 40%. In most local boards, those who
do not support the proposal are more likely to think the area should be bigger, rather than smaller.
Support for 400 metre terrace housing and apartment buildings zone around large town centres by area
✓ = Support
B = Area should be bigger
S = Area should be smaller
O = Other
DK = Don’t know
North
HIBISCUS AND BAYS
✓ = 49%
B = 23%
RODNEY
S = 14%
UPPER HARBOUR
O = 5%
DK = 9%
DEVONPORT -
KAIPATIKI
TAKAPUNA
Central
✓ = 50%
WAITEMATA
B = 27%
HENDERSON MASSEY
ALBERT/EDEN
ORAKEI
S = 12%
West
O = 3%
WHAU
MAUNGAKIEKIE
TAMAKI
WAITAKERE RANGES
PUKETAPAPA
HOWICK
✓ = 46%
DK = 8%
B = 28%
OTARA-
S = 10%
PAPATOETOE
MANGERE-
OTAHUHU
O = 4%
MANUREWA
DK = 12%
PAPAKURA
South
✓ = 50%
FRANKLIN
B = 26%
S = 11%
Base: varies by sub-region (316-630)
O = 4%
Source: Q8
DK = 10%
Support for 400 metre terrace housing and apartment buildings zone around large town centres by local board
✓ = Support
Colour coding is based on support for
B = Area should be bigger
the proposed building zone
S = Area should be smaller
Less than 40%
O = Other
40% - 49%
DK = Don’t know
50% +
Rodney | ✓ = 49%, B = 24%, S = 8%, O = 6%, DK = 12%
Hibiscus and Bays | ✓ = 44%, B = 24%, S = 21%, O = 6%, DK = 5%
Devonport-Takapuna | ✓ = 48%, B = 18%, S = 18%, O = 8%, DK = 8%
Kaipātiki | ✓ = 56%, B = 22%, S = 11%, O = 3%, DK = 8%
Upper Harbour | ✓ = 48%, B = 25%, S = 12%, O = 1%, DK = 14%
Waitematā | ✓ = 50%, B = 27%, S = 13%, O = 1%, DK = 9%
Henderson-Massey | ✓ = 38%, B = 33%, S = 11%, O = 4%, DK = 13%
Ōrākei | ✓ = 55%, B = 28%, S = 10%, O = 3%, DK = 4%
Albert-Eden | ✓ = 51%, B = 25%, S = 11%, O = 3%, DK = 9%
Maungakiekie-Tāmaki | ✓ = 47%, B = 29%, S = 15%, O = 2%, DK = 8%
Whau | ✓ = 54%, B = 22%, S = 11%, O = 4%, DK = 9%
Howick | ✓ = 49%, B = 24%, S = 15%, O = 6%, DK = 6%
Waitākere Ranges | ✓ = 52%, B = 28%, S = 7%, O = 3%, DK = 11%
Puketāpapa | ✓ = 41%, B = 30%, S = 15%, O = 4%, DK = 10%
Ōtara-Papatoetoe | ✓ = 58%, B = 28%, S = 7%, O = -, DK = 7%
Māngere- Ōtāhuhu | ✓ = 52%, B = 20%, S = 12%, O = 2%, DK = 14%
Manurewa | ✓ = 41%, B = 30%, S = 9%, O = 6%, DK = 13%
Papakura | ✓ = 53%, B = 20%, S = 8%, O = 4%, DK = 15%
Franklin | ✓ = 48%, B = 36%, S = 10%, O = 1%, DK = 5%
*Results in some local boards do not
Base: varies by local board (102-110)
exactly sum to 100% due to rounding
Prepared by Kantar Public | 8-Jun-22
Page | 22
National Policy Statement on Urban Development 2020 and 2021 amendments to the Resource Management Act –
Public Opinion Survey
Demographic variations
There are no notable group differences for support of the proposed 400 metre terrace housing and apartment
building zone around large town centres. However, the following groups are most likely to think the area should be
bigger:
• Renters (32%, compared to 24% of homeowners)
• Younger Aucklanders (32% of those aged under 30, compared to 20% of those aged 60+)
• Those living in Franklin (36%).
Prepared by Kantar Public | 8-Jun-22
Page | 23

National Policy Statement on Urban Development 2020 and 2021 amendments to the Resource Management Act –
Public Opinion Survey
Support for 200 metre terrace housing and apartment buildings zone around small
town centres
Respondents were shown the following information before being asked their level of support for the 200 metre
building zone around small town centres. Where appropriate, examples of small town centres shown were tailored to
the local board in which each respondent lived.
Auckland Council is proposing to put a Terrace Housing and Apartment Buildings zone in an area around
200 metres (about a 3-minute walk) from small town centres.
These are suburban centres in Auckland, with a smaller range of shops, services and activities. Examples are
(TAILOR TO RESPONDENT’S LOCAL BOARD).
Prepared by Kantar Public | 8-Jun-22
Page | 24
National Policy Statement on Urban Development 2020 and 2021 amendments to the Resource Management Act –
Public Opinion Survey
Just under half (46%) of Aucklanders support the 200 metre terrace housing and apartment buildings zone around
small town centres, 30% think it should be bigger than 200 metres and 10% think it should be smaller.
Support for 200 metre terrace housing and apartment buildings zone around small town centres
10%
Don’t know/ don’t have enough
3%
information to say
Other
10%
Do not support - area should
be smaller
46% Support –
200m is appropriate
30%
Do not support - area should be
bigger
Base: All respondents (2,041)
Source: Q9
Prepared by Kantar Public | 8-Jun-22
Page | 25
National Policy Statement on Urban Development 2020 and 2021 amendments to the Resource Management Act –
Public Opinion Survey
Level of support by region
The next two charts show support levels by Auckland sub-region and local board area respectively. Five local boards
show small majorities of support. The remaining local boards have less than majority support, with one showing
support lower than 40%. Those who do not support the proposal are more likely to think the area should be bigger,
rather than smaller.
Support for the 200 metre terrace housing and apartment buildings zone around small town centres by area
✓ = Support
B = Area should be bigger
S = Area should be smaller
O = Other
DK = Don’t know
North
HIBISCUS AND BAYS
✓ = 47%
B = 27%
RODNEY
S = 11%
UPPER HARBOUR
O = 4%
DK = 10%
DEVONPORT -
KAIPATIKI
TAKAPUNA
Central
✓ = 48%
WAITEMATA
B = 31%
HENDERSON MASSEY
ALBERT/EDEN
ORAKEI
S = 11%
West
O = 2%
WHAU
MAUNGAKIEKIE
TAMAKI
WAITAKERE RANGES
PUKETAPAPA
HOWICK
✓ = 40%
DK = 8%
B = 34%
OTARA-
S = 11%
PAPATOETOE
MANGERE-
OTAHUHU
O = 3%
MANUREWA
DK = 12%
PAPAKURA
South
✓ = 46%
FRANKLIN
B = 31%
S = 9%
Base: varies by sub-region (316-630)
O = 4%
Source: Q9
DK = 10%
Prepared by Kantar Public | 8-Jun-22
Page | 26
National Policy Statement on Urban Development 2020 and 2021 amendments to the Resource Management Act –
Public Opinion Survey
Support for the 200 metre terrace housing and apartment buildings zone around small town centres by local board
✓ = Support
Colour coding is based on support for
B = Area should be bigger
the proposed building zone
S = Area should be smaller
Less than 40%
O = Other
40% - 49%
DK = Don’t know
50% +
Rodney | ✓ = 43%, B = 30%, S = 9%, O = 8%, DK = 10%
Hibiscus and Bays | ✓ = 45%, B = 26%, S = 15%, O = 5%, DK = 9%
Devonport-Takapuna | ✓ = 49%, B = 23%, S = 13%, O = 7%, DK = 8%
Kaipātiki | ✓ = 57%, B = 27%, S = 5%, O = 2%, DK = 10%
Upper Harbour | ✓ = 40%, B = 31%, S = 13%, O = 1%, DK = 15%
Waitematā | ✓ = 48%, B = 30%, S = 11%, O = 1%, DK = 10%
Henderson-Massey | ✓ = 35%, B = 41%, S =12%, O = 2%, DK = 11%
Ōrākei | ✓ = 55%, B = 32%, S = 8%, O = 2%, DK = 4%
Albert-Eden | ✓ = 47%, B = 28%, S = 11%, O = 4%, DK = 10%
Maungakiekie-Tāmaki | ✓ = 47%, B = 33%, S = 13%, O = *, DK = 7%
Whau | ✓ = 41%, B = 28%, S = 12%, O = 4%, DK = 14%
Howick | ✓ = 43%, B = 31%, S = 12%, O = 7%, DK = 7%
Waitākere Ranges | ✓ = 50%, B = 29%, S = 7%, O = 3%, DK = 11%
Puketāpapa | ✓ = 44%, B = 31%, S = 13%, O = 1%, DK = 12%
Ōtara-Papatoetoe | ✓ = 53%, B = 29%, S = 5%, O = 1%, DK = 12%
Māngere- Ōtāhuhu | ✓ = 52%, B = 20%, S = 10%, O = 4%, DK = 15%
Manurewa | ✓ = 40%, B = 36%, S = 6%, O = 6%, DK = 12%
Papakura | ✓ = 46%, B = 30%, S = 8%, O = 3%, DK = 13%
Franklin | ✓ = 47%, B = 37%, S = 10%, O = 1%, DK = 6%
*Results in some local boards do not
Base: varies by local board (102-110)
exactly sum to 100% due to rounding
Demographic variations
Aucklanders living in Henderson-Massey have lower support (35%, compared to 46% overall) and are more likely to
think the area should be bigger than 200 metres (41%, compared to 30% overall).
The following groups are also more likely to think the area should be bigger than 200 metres:
• Renters (35%, compared to 28% of homeowners)
• Younger Aucklanders (35% of those under 30, compared to 26% of those 60+).
Prepared by Kantar Public | 8-Jun-22
Page | 27
National Policy Statement on Urban Development 2020 and 2021 amendments to the Resource Management Act –
Public Opinion Survey
Qualifying matters
This section examines Aucklanders’ support for qualifying matters being considered by Auckland Council. Note the
question wording did not specifically refer to ‘qualifying matters’ as the cognitive testing respondents better
understood the concept using the word ‘exemptions’. Specifically, respondents were shown the following
information:
What exemptions are about
The Government’s new rules on allowing taller building heights do not need to be followed if an area or
property has certain features or characteristics. The Government has already decided what some of the
exemptions should be, but Auckland Council can decide on others.
Types of exemptions being considered by Auckland Council
Special character areas
•
Auckland Council is proposing that ‘special character areas’ be an exemption.
•
These are well-established parts of Auckland that have lots of older housing types such as villas
or have a special architectural character. Often these areas are close to public transport, shops,
and services.
•
Only areas with enough suitable houses will be exempted. This means some of the current
‘special character areas’ will no longer be considered ‘special character’ under the new rules.
Areas with infrastructure that will NOT support population growth
•
These are areas that do not have adequate roads, walking and cycle paths, public transport,
water supply, or wastewater to support additional terraced housing or apartment building
zones.
•
These areas may also be prone to flooding.
Respondents were then asked about their level of support for the special character area qualifying matter, followed
by their level of support for infrastructure qualifying matter.
Prepared by Kantar Public | 8-Jun-22
Page | 28
National Policy Statement on Urban Development 2020 and 2021 amendments to the Resource Management Act –
Public Opinion Survey
Qualifying matter – special character areas
Most (66%) Aucklanders support Council’s proposal for special character areas to be exempt from the Governments
new housing rules.
Support for special character exemptions
15%
Don’t know/ don’t have
2%
enough information to say
Other
17%
Do not support
66%
Support
Base: All respondents (2,041)
Source: Q3
Prepared by Kantar Public | 8-Jun-22
Page | 29
National Policy Statement on Urban Development 2020 and 2021 amendments to the Resource Management Act –
Public Opinion Survey
Level of support by region
The next two charts show support levels by Auckland sub-region and local board area respectively. Majority support
for Auckland Council’s proposal is evident across all local boards (50% or greater). Support exceeds 70% in four local
boards.
Support for special character area exemption by area
✓ = Support
X = Do not support
O = Other
DK = Don’t know
North
HIBISCUS AND BAYS
✓ = 71%
X = 15%
RODNEY
O = 3%
UPPER HARBOUR
DK = 11%
DEVONPORT -
KAIPATIKI
TAKAPUNA
Central
✓ = 67%
WAITEMATA
X = 17%
HENDERSON MASSEY
ALBERT/EDEN
ORAKEI
O = 2%
West
DK = 14%
WHAU
MAUNGAKIEKIE
TAMAKI
WAITAKERE RANGES
PUKETAPAPA
HOWICK
✓ = 58%
X = 22%
OTARA-
O = 2%
PAPATOETOE
MANGERE-
OTAHUHU
DK = 18%
MANUREWA
PAPAKURA
South
✓ = 64%
FRANKLIN
X = 17%
O = 1%
Base: varies by sub-region (316-630)
DK = 17%
Source: Q3
Support for special character area exemption by local board
✓ = Support
Colour coding is based on support for
X = Do not support
the proposed exemption
O = Other
Less than 60%
DK = Don’t know
60% - 69%
70% +
Rodney | ✓ = 75%, X = 12%, O = 4%, DK = 9%
Hibiscus and Bays | ✓ = 77%, X = 11%, O = 4%, DK = 8%
Devonport-Takapuna | ✓ = 67%, D= 13%, O = 4%, DK = 16%
Kaipātiki | ✓ = 68%, X = 21%, O = 2%, DK = 10%
Upper Harbour | ✓ = 67%, X = 19%, O = -, DK = 14%
Waitematā | ✓ = 62%, X = 18%, O = 2%, DK = 18%
Henderson-Massey | ✓ = 55%, X = 24%, O = 3%, DK = 18%
Ōrākei | ✓ = 79%, X = 15%, O = 2%, DK = 5%
Albert-Eden | ✓ = 64%, X = 19%, O =2%, DK = 15%
Maungakiekie-Tāmaki | ✓ = 66%, X = 12%, O = 2%, DK = 19%
Whau | ✓ = 58%, X = 25%, O = 1%, DK = 16%
Waitākere Ranges | ✓ = 66%, X = 12%, O = 3%, DK = 19%
Howick | ✓ = 67%, X = 20%, O = 3%, DK = 10%
Puketāpapa | ✓ = 64%, X = 17%, O = 4%, DK = 14%
Ōtara-Papatoetoe | ✓ = 59%, X = 18%, O = -, DK = 23%
Māngere- Ōtāhuhu | ✓ = 62%, X = 14%, O = 2%, DK = 22%
Manurewa | ✓ = 61%, X = 18%, O = -, DK = 21%
Papakura | ✓ = 65%, X = 13%, O = 2%, DK = 21%
Franklin | ✓ = 72%, X = 14%, O = -, DK = 14%
*Results in some local boards do not
Base: varies by local board (102 – 110)
exactly sum to 100% due to rounding
Prepared by Kantar Public | 8-Jun-22
Page | 30
National Policy Statement on Urban Development 2020 and 2021 amendments to the Resource Management Act –
Public Opinion Survey
Demographic variations
Support for the special character area exemption is higher among:
• Older Aucklanders (74% among those aged 60+)
• NZ Europeans (71%)
• Homeowners (71%)
• Those living in Hibiscus and Bays (77%), Orākei (79%)
Support for the special character area exemption is lower among:
• Younger Aucklanders (59% among those aged under 30)
• Asian Aucklanders (59%), Māori (57%), and Pacific Aucklanders (55%)
• Living with family / boarding (56%)
• Those living in Henderson-Massey (55%)
Qualifying matter – infrastructure constraints
Two thirds (65%) of Aucklanders support Auckland Council’s proposal for the qualifying matter relating to
infrastructure constraints.
Support for exemptions in areas with infrastructure that does not support population growth
17%
Don’t know/ don’t have
1%
enough information to say
Other
16%
Do not support
65%
Support
Base: All respondents (2,041)
Source: Q4
Prepared by Kantar Public | 8-Jun-22
Page | 31
National Policy Statement on Urban Development 2020 and 2021 amendments to the Resource Management Act –
Public Opinion Survey
Level of support by region
The next two charts show support levels by Auckland sub-region and local board area respectively. All local boards
have majority support (over 50%), while in three local boards support exceeds 70%.
Support for exemptions in areas with infrastructure that does not support population growth by area
✓ = Support
X = Do not support
O = Other
DK = Don’t know
North
HIBISCUS AND BAYS
✓ = 68%
X = 16%
RODNEY
O = 1%
UPPER HARBOUR
DK = 15%
DEVONPORT -
KAIPATIKI
TAKAPUNA
Central
✓ = 66%
WAITEMATA
X = 15%
HENDERSON MASSEY
ALBERT/EDEN
ORAKEI
O = 2%
West
DK = 17%
WHAU
MAUNGAKIEKIE
TAMAKI
WAITAKERE RANGES
PUKETAPAPA
HOWICK
✓ = 61%
X = 20%
OTARA-
O = 1%
PAPATOETOE
MANGERE-
OTAHUHU
DK = 19%
MANUREWA
PAPAKURA
South
✓ = 64%
FRANKLIN
X = 16%
O = 2%
Base: varies by sub-region (316-630)
DK = 18%
Source: Q4
Support for exemptions in areas with infrastructure that does not support population growth by local board
✓ = Support
Colour coding is based on support for
X = Do not support
the proposed exemption
O = Other
Less than 60%
DK = Don’t know
60% - 69%
70% +
Rodney | ✓ = 65%, X = 18%, O = -, DK = 17%
Hibiscus and Bays | ✓ = 73%, X = 9%, O = 1%, DK = 17%
Devonport-Takapuna | ✓ = 69%, D= 15%, O = 5%, DK = 11%
Kaipātiki | ✓ = 74%, X = 14%, O = *, DK = 11%
Upper Harbour | ✓ = 55%, X = 27%, O = 1, DK = 17%
Waitematā | ✓ = 64%, X = 15%, O = 3%, DK = 18%
Henderson-Massey | ✓ = 58%, X = 22%, O = 1%, DK = 18%
Ōrākei | ✓ = 74%, X = 14%, O = 1%, DK = 11%
Albert-Eden | ✓ = 68%, X = 16%, O = -, DK = 16%
Maungakiekie-Tāmaki | ✓ = 65%, X = 13%, O = 2%, DK = 20%
Whau | ✓ = 61%, X = 19%, O = *%, DK = 20%
Waitākere Ranges | ✓ = 65%, X = 14%, O = 1%, DK = 20%
Howick | ✓ = 65%, X = 17%, O = 5%, DK = 12%
Puketāpapa | ✓ = 56%, X = 19%, O = 5%, DK = 20%
Ōtara-Papatoetoe | ✓ = 62%, X = 21%, O = -, DK = 16%
Māngere- Ōtāhuhu | ✓ = 62%, X = 12%, O = -, DK = 25%
Manurewa | ✓ = 63%, X = 13%, O = -, DK = 23%
Papakura | ✓ = 67%, X = 12%, O = 1%, DK = 20%
Franklin | ✓ = 67%, X = 15%, O = -, DK = 18%
*Results in some local boards do not
Base: varies by local board (102 – 110)
exactly sum to 100% due to rounding
Prepared by Kantar Public | 8-Jun-22
Page | 32
National Policy Statement on Urban Development 2020 and 2021 amendments to the Resource Management Act –
Public Opinion Survey
Demographic variations
Support for infrastructure exemptions is higher among:
• Older Aucklanders (70% of those aged 60+)
• Those on higher incomes (68% of those with household incomes of more than $70,000)
• Homeowners (68%)
Support for infrastructure exemptions is lower among:
• Those on lower incomes (60% of those with household income $70,000 or less)
• Renters (60%)
• Those living in Upper Harbour (55%).
Prepared by Kantar Public | 8-Jun-22
Page | 33
National Policy Statement on Urban Development 2020 and 2021 amendments to the Resource Management Act –
Public Opinion Survey
Sentiment towards new rules
This section examines how Aucklanders feel about the new rules and how Auckland Council propose to implement
them. Specifically, respondents were shown the below:
Earlier in this survey we explained that the Government is introducing new rules aimed at increasing the
supply of housing in New Zealand. This will mean taller and more dense housing across much of Auckland.
As you will also have learnt in the last few questions, Auckland Council is able to make some decisions that
will affect how the rules are applied.
So, overall, would you say the new rules and the proposals for how they will be applied are a positive or
negative thing for Auckland?
Aucklanders are more likely to feel positively (49%) than negatively (32%) about the new rules. The remaining 20%
are either neutral or unsure.
Sentiment towards new housing rules
49%
4%
Very or somewhat
13%
16%
positive
Very positive
Somewhat positive
Somewhat negative
13%
Very negative
36%
Neither positive nor negative
Don't know
19%
Base: All respondents (2,041)
Source: Q10
Demographic variations
Positivity (very or somewhat positive) is higher among:
• Men (55%)
• Those on higher incomes (56% of those with household income $150,000+)
• Those living in Orākei (61%)
Positivity is lower among:
• Women (42%)
• Those on lower incomes (43% of those with household income $70,000 or less)
• Those living in Manurewa (34%)
Prepared by Kantar Public | 8-Jun-22
Page | 34
National Policy Statement on Urban Development 2020 and 2021 amendments to the Resource Management Act –
Public Opinion Survey
Importance of factors relating to housing development in Auckland
This section examines what is most important to Aucklanders when it comes to planning for more housing in
Auckland. Respondents were asked to select two factors which were most important to them personally. The factors
shown are listed below.
• Enough housing for everyone
• Decisions that result in less traffic congestion
• Growing the building industry and supply chains
• Infrastructure that can cope (e.g. water, wastewater, roads, public transport)
• Building housing that is close to current transport, shops, community services
• Building housing that is close to the city centre
• Building housing that is on the edge of Auckland (growing the geographic size of Auckland)
• Protecting ‘special character’ areas (e.g. heritage buildings and villas)
• Something else
• Don’t know
Having infrastructure that can cope is the single most important factor for Aucklanders in relation to housing
development in Auckland (62%). This is followed by decisions that result in less traffic congestion (34%) and having
enough housing for everyone (26%).
Importance of factors relating to housing development in Auckland
Infrastructure that can cope
62%
Decisions that result in less traffic congestion
34%
Enough housing for everyone
26%
Protecting ‘special character’ areas
22%
Building housing that is close to current transport etc.
20%
Building housing that is on the edge of Auckland
11%
Building housing that is close to the city centre
6%
Growing the building industry and supply chains
5%
Something else
6%
Base: All respondents (2,041)
Don't know
4%
Source: Q11
Demographic variations
Having infrastructure that can cope is ranked higher than all other factors across all demographics. However, there
are differences in the factor which is ranked second. While ‘decisions that result in less traffic congestion’ is ranked
second overall, for some groups ‘enough housing for everyone’ is seen as more important.
‘Enough housing for everyone’ is ranked the second most important factor among:
Prepared by Kantar Public | 8-Jun-22
Page | 35
National Policy Statement on Urban Development 2020 and 2021 amendments to the Resource Management Act –
Public Opinion Survey
• Māori (34%) and Pacific Aucklanders (48%)
• Renters (40%)
• Those living with family or boarding (36%)
• Those living in Māngere Ōtāhuhu (34%), Maungakiekie Tāmaki (37%), Puketāpapa (32%), Whau (31%)
Aucklanders living in Waitematā place more importance on building housing that is close to current transport, shops
and community services (34%, compared to 20% overall). Rodney residents place greater emphasis on protecting
‘special character’ areas (33%, compared to 22% overall).
Prepared by Kantar Public | 8-Jun-22
Page | 36
National Policy Statement on Urban Development 2020 and 2021 amendments to the Resource Management Act –
Public Opinion Survey
Overall views of population growth
This final section examines Aucklanders’ overall view of population growth in Auckland. Respondents were asked to
indicate how they felt about population growth in Auckland on a sliding 5 point scale. Results shown below.
Overall view of population growth in Auckland
I think population growth
I think population growth
is very good for Auckland
is very bad for Auckland
8%
30%
27%
23%
8%
4%
5
4
3
2
1
Don't know
Base: All respondents (2,041)
Source: Q12
Aucklanders are divided in their views of the city’s population growth. Thirty-eight percent think population growth is
good for Auckland (4-5 out of 5) while 31% think it is bad (1-2 out of 5)
Demographic variations
The opinion that population growth is good for Auckland is higher among:
• Men (47%)
• Asian Aucklanders (50%)
• Those living in Orākei (48%)
The opinion that population growth is good for Auckland is lower among:
• Women (29%)
• NZ Europeans (32%) and Māori (24%)
• Those living in Franklin (25%), Manurewa (27%), Rodney (25%).
Prepared by Kantar Public | 8-Jun-22
Page | 37
National Policy Statement on Urban Development 2020 and 2021 amendments to the Resource Management Act –
Public Opinion Survey
Appendix A: Sample profile
Demographic profiles of the unweighted and weighted samples are provided below.
Demographic profile of sample
Unweighted
Weighted
n
%
n
%
Gender
Male
976
48%
997
49%
Female
1065
52%
1044
51%
Age
18 - 24 years
274
13%
277
14%
25 - 29 years
185
9%
228
11%
30 - 34 years
131
6%
161
8%
35 - 39 years
180
9%
237
12%
40 - 44 years
162
8%
172
8%
45 - 49 years
173
8%
186
9%
50 - 54 years
171
8%
163
8%
55 - 59 years
184
9%
166
8%
60 - 64 years
145
7%
129
6%
65 - 74 years
277
14%
205
10%
75 - 84 years
142
7%
104
5%
85 years or over
17
1%
14
1%
Ethnicity
NZ European / Pakeha
1301
64%
1183
58%
Māori
230
11%
194
10%
Chinese
198
10%
227
11%
Indian, Pakistani or Sri Lankan
185
9%
200
10%
Other Asian group
103
5%
109
5%
Samoan
57
3%
113
6%
Cook Island Māori
24
1%
42
2%
Tongan
19
1%
32
2%
Niuean
12
1%
22
1%
Other Pacific Island group
17
1%
37
2%
Other European group
76
4%
84
4%
Middle Eastern / Latin American / African
36
2%
41
2%
Another ethnic group
24
1%
23
1%
Household size
One
243
12%
215
11%
Two
622
30%
563
28%
Three
464
23%
466
23%
Four
408
20%
429
21%
Five
187
9%
211
10%
Six or more
117
6%
157
8%
Prepared by Kantar Public | 8-Jun-22
Page | 38
National Policy Statement on Urban Development 2020 and 2021 amendments to the Resource Management Act –
Public Opinion Survey
Unweighted
Weighted
n
%
n
%
Household income
$20,000 or less
55
3%
87
4%
Over $20,000 up to $30,000
133
7%
156
8%
Over $30,000 up to $50,000
199
10%
232
11%
Over $50,000 up to $70,000
291
14%
250
12%
Over $70,000 up to $100,000
396
19%
331
16%
Over $100,000 up to $150,000
547
27%
520
25%
Over $150,000
420
21%
464
23%
Sub-region
Central Auckland
540
26%
547
27%
Gulf Islands
6
*
14
1%
North Auckland
549
27%
501
25%
South Auckland
630
31%
659
32%
West Auckland
316
15%
320
16%
Local Board
Albert-Eden
110
5%
133
7%
Devonport-Takapuna
110
5%
77
4%
Franklin
102
5%
95
5%
Great Barrier
2
*
1
*
Henderson-Massey
104
5%
149
7%
Hibiscus and Bays
110
5%
137
7%
Howick
110
5%
183
9%
Kaipātiki
109
5%
118
6%
Māngere Ōtāhuhu
100
5%
91
4%
Manurewa
110
5%
114
6%
Maungakiekie Tāmaki
110
5%
100
5%
Ōrakei
108
5%
112
5%
Ōtara Papatoetoe
103
5%
104
5%
Papakura
105
5%
71
3%
Puketapapa
102
5%
77
4%
Rodney
110
5%
86
4%
Upper Harbour
110
5%
83
4%
Waiheke
4
*
13
1%
Waitākere Ranges
105
5%
66
3%
Waitematā
110
5%
125
6%
Whau
107
5%
105
5%
Base: All respondents (2,041)
Source: S1, S2, S4, S6, S7
* denotes a % between 0.0% and 0.5%
Prepared by Kantar Public | 8-Jun-22
Page | 39
National Policy Statement on Urban Development 2020 and 2021 amendments to the Resource Management Act –
Public Opinion Survey
Appendix B: Support by local board
A breakdown of responses to Q3 (
Do you support the Council’s proposal to include ‘special character areas’ as an
exemption?) by local board is given below.
Responses
Local Board
Don’t know/ don’t
Support
Do not support
Other
have enough
information to say
Albert-Eden
64%
19%
2%
15%
Devonport-Takapuna
67%
13%
4%
16%
Franklin
72%
14%
-
14%
Henderson-Massey
55%
24%
3%
18%
Hibiscus and Bays
77%
11%
4%
8%
Howick
67%
20%
3%
10%
Kaipātiki
68%
21%
2%
10%
Māngere- Ōtāhuhu
62%
14%
2%
22%
Manurewa
61%
18%
-
21%
Maungakiekie-Tāmaki
66%
12%
2%
19%
Ōrākei
79%
15%
2%
5%
Ōtara-Papatoetoe
59%
18%
-
23%
Papakura
65%
13%
2%
21%
Puketāpapa
64%
17%
4%
14%
Rodney
75%
12%
4%
9%
Upper Harbour
67%
19%
-
14%
Waitākere Ranges
66%
12%
3%
19%
Waitematā
62%
18%
2%
18%
Whau
58%
25%
1%
16%
* denotes a % between 0.0% and 0.5%
Prepared by Kantar Public | 8-Jun-22
Page | 40
National Policy Statement on Urban Development 2020 and 2021 amendments to the Resource Management Act –
Public Opinion Survey
A breakdown of responses to Q4 (
Do you support the Council’s proposal to include areas in urban Auckland with long-
term significant infrastructure issues as an exemption?) by local board is given below.
Responses
Local Board
Don’t know/ don’t
Support
Do not support
Other
have enough
information to say
Albert-Eden
68%
16%
-
16%
Devonport-Takapuna
69%
15%
5%
11%
Franklin
67%
15%
-
18%
Henderson-Massey
58%
22%
1%
18%
Hibiscus and Bays
73%
9%
1%
17%
Howick
65%
17%
5%
12%
Kaipātiki
74%
14%
*
11%
Māngere- Ōtāhuhu
62%
12%
-
25%
Manurewa
63%
13%
-
23%
Maungakiekie-Tāmaki
65%
13%
2%
20%
Ōrākei
74%
14%
1%
11%
Ōtara-Papatoetoe
62%
21%
-
16%
Papakura
67%
12%
1%
20%
Puketāpapa
56%
19%
5%
21%
Rodney
65%
18%
-
17%
Upper Harbour
55%
27%
1%
17%
Waitākere Ranges
65%
14%
1%
20%
Waitematā
64%
15%
3%
18%
Whau
61%
19%
*
20%
* denotes a % between 0.0% and 0.5%
Prepared by Kantar Public | 8-Jun-22
Page | 41
National Policy Statement on Urban Development 2020 and 2021 amendments to the Resource Management Act –
Public Opinion Survey
A breakdown of responses to Q5 (
What do you think of the proposed distance of 1200 metres for a walkable area
around the city centre that allows housing of at least six storeys to be built?) by local board is given below.
Responses
Local Board
Do not support –
Do not support
Other
Don’t know/ don’t
Support
area should be
– area should
have enough
bigger
be smaller
information to say
Albert-Eden
55%
16%
16%
2%
12%
Devonport-Takapuna
45%
11%
32%
3%
10%
Franklin
50%
18%
25%
3%
4%
Henderson-Massey
43%
20%
19%
1%
17%
Hibiscus and Bays
60%
18%
18%
3%
1%
Howick
51%
15%
22%
5%
7%
Kaipātiki
56%
15%
18%
3%
8%
Māngere- Ōtāhuhu
53%
7%
17%
-
23%
Manurewa
41%
20%
16%
1%
21%
Maungakiekie-Tāmaki
48%
18%
23%
2%
8%
Ōrākei
50%
15%
28%
2%
4%
Ōtara-Papatoetoe
49%
16%
19%
2%
14%
Papakura
44%
14%
23%
2%
17%
Puketāpapa
60%
10%
21%
1%
8%
Rodney
53%
13%
25%
4%
5%
Upper Harbour
40%
22%
21%
3%
14%
Waitākere Ranges
53%
12%
17%
2%
16%
Waitematā
43%
18%
28%
2%
9%
Whau
47%
18%
16%
4%
15%
* denotes a % between 0.0% and 0.5%
Prepared by Kantar Public | 8-Jun-22
Page | 42
National Policy Statement on Urban Development 2020 and 2021 amendments to the Resource Management Act –
Public Opinion Survey
A breakdown of responses to Q6 (
What do you think of the proposed distance of 800 metres for a walkable area
around the metropolitan centres that allows housing of at least six storeys to be built?) by local board is given below.
Responses
Local Board
Do not support –
Do not support
Other
Don’t know/ don’t
Support
area should be
– area should
have enough
bigger
be smaller
information to say
Albert-Eden
48%
24%
11%
1%
15%
Devonport-Takapuna
49%
17%
22%
3%
9%
Franklin
46%
29%
14%
4%
7%
Henderson-Massey
46%
31%
8%
1%
14%
Hibiscus and Bays
61%
21%
12%
3%
2%
Howick
46%
23%
22%
3%
6%
Kaipātiki
47%
26%
15%
3%
8%
Māngere- Ōtāhuhu
58%
10%
9%
2%
21%
Manurewa
45%
26%
12%
2%
15%
Maungakiekie-Tāmaki
47%
29%
16%
1%
8%
Ōrākei
59%
29%
5%
2%
5%
Ōtara-Papatoetoe
49%
27%
14%
-
10%
Papakura
47%
22%
18%
3%
10%
Puketāpapa
56%
24%
11%
1%
8%
Rodney
52%
19%
13%
4%
12%
Upper Harbour
45%
24%
19%
1%
11%
Waitākere Ranges
45%
27%
12%
2%
14%
Waitematā
38%
34%
16%
-
13%
Whau
47%
25%
14%
5%
9%
* denotes a % between 0.0% and 0.5%
Prepared by Kantar Public | 8-Jun-22
Page | 43
National Policy Statement on Urban Development 2020 and 2021 amendments to the Resource Management Act –
Public Opinion Survey
A breakdown of responses to Q7 (
What do you think of the proposed distance of 800 metres for a walkable area
around a train or busway station that allows housing of at least six storeys to be built?) by local board is given below.
Responses
Local Board
Do not support –
Do not support
Other
Don’t know/ don’t
Support
area should be
– area should
have enough
bigger
be smaller
information to say
Albert-Eden
52%
18%
19%
1%
10%
Devonport-Takapuna
54%
16%
18%
3%
8%
Franklin
53%
24%
12%
2%
9%
Henderson-Massey
46%
31%
9%
2%
12%
Hibiscus and Bays
60%
19%
14%
2%
4%
Howick
54%
19%
14%
4%
10%
Kaipātiki
55%
18%
16%
2%
9%
Māngere- Ōtāhuhu
55%
11%
12%
2%
19%
Manurewa
46%
25%
13%
2%
13%
Maungakiekie-Tāmaki
50%
24%
17%
4%
6%
Ōrākei
57%
25%
10%
3%
5%
Ōtara-Papatoetoe
49%
22%
15%
3%
11%
Papakura
52%
17%
16%
3%
12%
Puketāpapa
60%
20%
11%
-
9%
Rodney
49%
18%
17%
5%
11%
Upper Harbour
48%
21%
21%
1%
9%
Waitākere Ranges
50%
22%
12%
3%
14%
Waitematā
44%
30%
12%
1%
13%
Whau
48%
21%
16%
3%
12%
* denotes a % between 0.0% and 0.5%
Prepared by Kantar Public | 8-Jun-22
Page | 44
National Policy Statement on Urban Development 2020 and 2021 amendments to the Resource Management Act –
Public Opinion Survey
A breakdown of responses to Q8 (
What do you think of the proposed distance of 400 metres around large town
centres for this zone that allows higher density housing?) by local board is given below.4
Responses
Local Board
Do not support –
Do not support
Other
Don’t know/ don’t
Support
area should be
– area should
have enough
bigger
be smaller
information to say
Albert-Eden
51%
25%
11%
3%
9%
Devonport-Takapuna
48%
18%
18%
8%
8%
Franklin
48%
36%
10%
1%
5%
Henderson-Massey
38%
33%
11%
4%
13%
Hibiscus and Bays
44%
24%
21%
6%
5%
Howick
49%
24%
15%
6%
6%
Kaipātiki
56%
22%
11%
3%
8%
Māngere- Ōtāhuhu
52%
20%
12%
2%
14%
Manurewa
41%
30%
9%
6%
13%
Maungakiekie-Tāmaki
47%
29%
15%
2%
8%
Ōrākei
55%
28%
10%
3%
4%
Ōtara-Papatoetoe
58%
28%
7%
-
7%
Papakura
53%
20%
8%
4%
15%
Puketāpapa
41%
30%
15%
4%
10%
Rodney
49%
24%
8%
6%
12%
Upper Harbour
48%
25%
12%
1%
14%
Waitākere Ranges
52%
28%
7%
3%
11%
Waitematā
50%
27%
13%
1%
9%
Whau
54%
22%
11%
4%
9%
* denotes a % between 0.0% and 0.5%
4 Erratum: Please note, Auckland Council made an error in the survey questionnaire at questions 8 and 9: The number of
building storeys allowed in the Terrace Housing and Apartment Buildings Zone is five storeys not four storeys.
Consideration of the results arising from these questions should be tempered by this error.
Prepared by Kantar Public | 8-Jun-22
Page | 45
National Policy Statement on Urban Development 2020 and 2021 amendments to the Resource Management Act –
Public Opinion Survey
A breakdown of responses to Q9 (
What do you think of the proposed distance of 200 metres around small town
centres for this zone that allows higher density housing?) by local board is given below.5
Responses
Local Board
Do not support –
Do not support
Other
Don’t know/ don’t
Support
area should be
– area should
have enough
bigger
be smaller
information to say
Albert-Eden
47%
28%
11%
4%
10%
Devonport-Takapuna
49%
23%
13%
7%
8%
Franklin
47%
37%
10%
1%
6%
Henderson-Massey
35%
41%
12%
2%
11%
Hibiscus and Bays
45%
26%
15%
5%
9%
Howick
43%
31%
12%
7%
7%
Kaipātiki
57%
27%
5%
2%
10%
Māngere- Ōtāhuhu
52%
20%
10%
4%
15%
Manurewa
40%
36%
6%
6%
12%
Maungakiekie-Tāmaki
47%
33%
13%
*
7%
Ōrākei
55%
32%
8%
2%
4%
Ōtara-Papatoetoe
53%
29%
5%
1%
12%
Papakura
46%
30%
8%
3%
13%
Puketāpapa
44%
31%
13%
1%
12%
Rodney
43%
30%
9%
8%
10%
Upper Harbour
40%
31%
13%
1%
15%
Waitākere Ranges
50%
29%
7%
3%
11%
Waitematā
48%
30%
11%
1%
10%
Whau
41%
28%
12%
4%
14%
* denotes a % between 0.0% and 0.5%
5 Erratum: Please note, Auckland Council made an error in the survey questionnaire at questions 8 and 9: The number of
building storeys allowed in the Terrace Housing and Apartment Buildings Zone is five storeys not four storeys.
Consideration of the results arising from these questions should be tempered by this error.
Prepared by Kantar Public | 8-Jun-22
Page | 46
National Policy Statement on Urban Development 2020 and 2021 amendments to the Resource Management Act –
Public Opinion Survey
A breakdown of responses to Q10 (
So, overall, would you say the new rules and the proposals for how they will be
applied are a positive or negative thing for Auckland?) by local board is given below.
Responses
Local Board
Positive
Negative
Neither positive
(very or
(very or
Don’t know
nor negative
somewhat)
somewhat)
Albert-Eden
55%
10%
30%
4%
Devonport-Takapuna
40%
14%
43%
3%
Franklin
49%
15%
36%
*
Henderson-Massey
45%
16%
34%
5%
Hibiscus and Bays
51%
15%
31%
2%
Howick
39%
21%
39%
1%
Kaipātiki
54%
16%
27%
2%
Māngere- Ōtāhuhu
53%
13%
31%
2%
Manurewa
34%
17%
40%
9%
Maungakiekie-Tāmaki
54%
12%
30%
4%
Ōrākei
61%
15%
22%
2%
Ōtara-Papatoetoe
38%
16%
42%
4%
Papakura
40%
24%
34%
2%
Puketāpapa
51%
20%
26%
3%
Rodney
51%
9%
36%
5%
Upper Harbour
48%
15%
34%
2%
Waitākere Ranges
40%
18%
37%
6%
Waitematā
59%
13%
24%
4%
Whau
50%
19%
24%
7%
* denotes a % between 0.0% and 0.5%
Prepared by Kantar Public | 8-Jun-22
Page | 47
National Policy Statement on Urban Development 2020 and 2021 amendments to the Resource Management Act –
Public Opinion Survey
A breakdown of responses to Q12 (
What is your overall view on population growth in Auckland?) by local board is
given below.
Responses
Local Board
Population growth
Population growth is
Neutral
is bad for Auckland
good for Auckland
Don’t know
(3 out of 5)
(1 or 2 out of 5)
(4 or 5 out of 5)
Albert-Eden
21%
28%
43%
7%
Devonport-Takapuna
40%
24%
33%
2%
Franklin
43%
29%
25%
3%
Henderson-Massey
27%
32%
35%
7%
Hibiscus and Bays
33%
32%
33%
2%
Howick
32%
22%
44%
2%
Kaipātiki
28%
31%
36%
6%
Māngere- Ōtāhuhu
28%
28%
40%
4%
Manurewa
39%
27%
27%
7%
Maungakiekie-Tāmaki
32%
24%
42%
3%
Ōrākei
18%
33%
48%
2%
Ōtara-Papatoetoe
39%
16%
38%
7%
Papakura
35%
30%
32%
3%
Puketāpapa
22%
32%
43%
3%
Rodney
38%
34%
25%
4%
Upper Harbour
31%
24%
44%
1%
Waitākere Ranges
29%
35%
32%
4%
Waitematā
25%
27%
42%
5%
Whau
33%
19%
43%
5%
Prepared by Kantar Public | 8-Jun-22
Page | 48
National Policy Statement on Urban Development 2020 and 2021 amendments to the Resource Management Act –
Public Opinion Survey
Appendix C: Questionnaire
AUCKLAND COUNCIL 2022 NPS-UD SURVEY
First, we have some questions to ensure we survey a wide range of people.
S1.
What is your gender?
Male
1
Female
2
Another gender (please tell us)
3
S2.
What is your age?
SCREEN
Under 18 years
OUT
18 – 24 years
1
25 – 29 years
2
30 – 34 years
3
35 – 39 years
4
40 – 44 years
5
45 – 49 years
6
50 – 54 years
7
55 – 59 years
8
60 – 64 years
9
65 – 74 years
10
75 – 84 years
11
85 years or over
12
S3.
Are you a New Zealand citizen or permanent resident?
Yes
1
SCREEN
No
2
OUT
MR
S4.
Which of the following ethnic groups do you belong to?
Please select all that apply.
NZ European / Pakeha
1
Māori
2
Samoan
3
Cook Island Māori
4
Tongan
5
Niuean
6
Another Pacific Island group (please tell us)
7
Prepared by Kantar Public | 8-Jun-22
Page | 49
National Policy Statement on Urban Development 2020 and 2021 amendments to the Resource Management Act –
Public Opinion Survey
Chinese
8
Indian, Pakistani or Sri Lankan
9
Another Asian group (please tell us)
10
Middle Eastern / Latin American / African
11
Another European group (please tell us)
12
Another ethnic group (please tell us)
13
S5
Which
suburb do you
live in?
Please type in your suburb and select the option that best applies.
[PROGRAMMER NOTE – SHOW SUBURB LIST AS DROP DOWN BOX IN ALPHABETICAL ORDER. INCLUDE ‘I
don’t live in the Auckland region’ and ‘I’d prefer not to say’ as single response codes outside of the drop
down box]
<INSERT SUBURB LIST>
1
None - I don't live in the Auckland Region
2
SCREEN OUT
I’d prefer not to say
3
SCREEN OUT
PROGRAMMER NOTE – THE FOLLOWING LOCAL BOARD AREAS ARE THE QUOTAS WHICH ARE THEN
LINKED FROM SUBURB LIST
QUOTAS – MAX n=105 per area board below
Albert-Eden
1
Ōrākei
12
Aotea / Great Barrier
2
Ōtara-Papatoetoe
13
Devonport-Takapuna
3
Papakura
14
Franklin
4
Puketāpapa
15
Henderson-Massey
5
Rodney
16
Hibiscus and Bays
6
Upper Harbour
17
Howick
7
Waiheke
18
Kaipātiki
8
Waitākere Ranges
19
Māngere Ōtāhuhu
9
Waitematā
20
Manuwera
10
Whau
21
Maungakiekie-Tāmaki
11
PROGRAMMER NOTE – AUTO CODE LOCAL BOARD INTO THE FOLLOWING WIDER AUCKLAND AREAS
Central Auckland
1
East Auckland
2
Gulf Islands
3
North Auckland (Includes Rodney and North Shore)
4
South Auckland (Includes Manukau, Papakura and Franklin)
5
West Auckland
6
Prepared by Kantar Public | 8-Jun-22
Page | 50
National Policy Statement on Urban Development 2020 and 2021 amendments to the Resource Management Act –
Public Opinion Survey
S6.
This question just helps to ensure we survey a wide range of people. Which of the following best
describes your
annual household income, before tax?
Please consider all sources of income including any salary or wages, self-employed income, child
support payments, money from the Government, and investments, etc.
If you’re unsure, your best estimate is fine.
$20,000 or less
1
$20,001-$30,000
2
$30,001-$50,000
3
$50,001-$70,000
4
$70,001-$100,000
5
$100,001-$150,000
6
Over $150,000
7
S7.
Including yourself, how many people usually live in your household?
One
1
Two
2
Three
3
Four
4
Five
5
Six or more
6
Q1.
The Government has made new rules on higher density housing that Councils have to follow. These new
rules are being put in place to allow more higher density and taller housing to boost the supply of housing
in New Zealand.
Before today, had you heard of these
new rules for higher density housing?
Yes
1
No
2
Don’t know
3
Q2.
Please read the following information carefully before answering the question.
This is how the new rules will work:
Prepared by Kantar Public | 8-Jun-22
Page | 51
National Policy Statement on Urban Development 2020 and 2021 amendments to the Resource Management Act –
Public Opinion Survey
• The plan is for taller and higher density housing in areas close to public transport stops, centres with shops,
jobs, and community centres.
• Housing of at least six storeys (
high density housing) will be allowed around the Auckland city centre and
other large Auckland urban centres, and around train and bus stations.
• Housing of up to four storeys around many of our suburban town centres
• Housing of up to three storeys (
medium density housing) will be allowed in most other residential areas
across Auckland.
• The new rules also allow
exemptions to the higher density rules if a property or area has certain special
features or characteristics (these are called ‘qualifying matters’).
Before today, how much of the information on this screen were you aware of?
I had
not heard of the new rules before today
1
I had heard of the new rules, but didn’t know any of this
2
information
I knew a little bit about this information
3
I knew a lot about this information
4
DS: SET UP TIME STAMP. IF LESS THAN 20 SECONDS SHOW: You read the information we just showed you very
quickly. Please make sure you read all the information before continuing.
Prepared by Kantar Public | 8-Jun-22
Page | 52
National Policy Statement on Urban Development 2020 and 2021 amendments to the Resource Management Act –
Public Opinion Survey
What exemptions are about
The Government’s new rules on allowing taller building heights
do not need to be followed if an area or property
has certain features or characteristics. The Government has already decided what some of the exemptions should
be, but Auckland Council can decide on others.
Types of exemptions being considered by Auckland Council
Special character areas
• Auckland Council is proposing that ‘special character areas’
be an exemption.
• These are well-established parts of Auckland that have lots of older housing types such as villas or have a
special architectural character. Often these areas are close to public transport, shops, and services.
• Only areas with enough suitable houses will be exempted. This means some of the current ‘special
character areas’ will no longer be considered ‘special character’ under the new rules.
Areas with infrastructure that will NOT support population growth
• These are areas that do not have adequate roads, walking and cycle paths, public transport, water supply,
or wastewater to support additional terraced housing or apartment building zones.
• These areas may also be prone to flooding.
DS: SET UP TIME STAMP. IF LESS THAN 20 SECONDS SHOW: You read the information we just showed you very
quickly. Please make sure you read all of the information before continuing.
Q3 If ‘special character areas’ are made an exemption, Auckland Council can limit the height and density of housing
in these areas.
Do you support the Council’s proposal to include ‘special character areas’ as an exemption?
Yes, support
1
Do not support
2
Other (please tell us)
3
Don’t know / Don’t have enough information to say
4
Q4
If long-term infrastructure issues are made an exemption, Auckland Council can limit the height and density
of housing in affected areas.
Do you support the Council’s proposal to include areas in urban Auckland with long-term significant
infrastructure issues as an exemption?
Prepared by Kantar Public | 8-Jun-22
Page | 53

National Policy Statement on Urban Development 2020 and 2021 amendments to the Resource Management Act –
Public Opinion Survey
Yes, support
1
Do not support
2
Other (please tell us)
3
Don’t know / Don’t have enough information to say
4
NEW SCREEN
Auckland Council must follow the Government’s new rules, but Auckland Council needs to decide on some factors
that affect how the rules will be applied. The next few questions are about these decisions.
NEW SCREEN
Please read the following information carefully before moving to the next screen.
Auckland Council must make decisions about
walkable areas. A walkable area is the
area around a centre, train
station or busway stop from which an average person could walk to get to that place. See the orange zone in the
diagram.
Prepared by Kantar Public | 8-Jun-22
Page | 54

National Policy Statement on Urban Development 2020 and 2021 amendments to the Resource Management Act –
Public Opinion Survey
The new housing rules mean that buildings of
six storeys or more can be built in the
walkable areas. This will mean
more people can live close to urban centres for things like shopping, entertainment, community services, meeting
friends, and public transport.
This will also help to reduce congestion and greenhouse gas emissions, with people driving shorter distances to
reach the places and services they need.
DS: SET UP TIME STAMP. IF LESS THAN 15 SECONDS SHOW: You looked at the information we just showed you
very quickly. Please make sure you have read all the information before continuing.
Q5
The Government requires Auckland Council to decide on the size of the walkable area where housing with
six or more storeys can be built.
The Council is proposing a walkable area of
1200 metres (about a 15-minute walk) from the
city centre, or
the ‘city fringe’ (e.g. Ponsonby, Eden Terrace, Parnell, Grafton).
Prepared by Kantar Public | 8-Jun-22
Page | 55
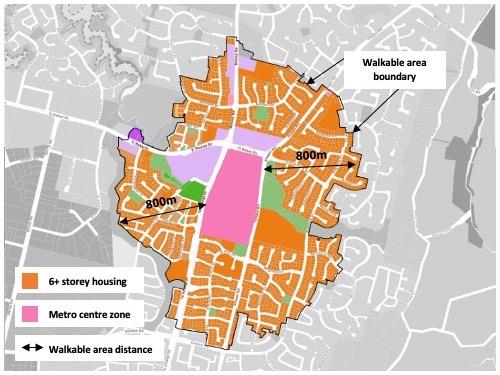
National Policy Statement on Urban Development 2020 and 2021 amendments to the Resource Management Act –
Public Opinion Survey
What do you think of the proposed distance of
1200 metres for a walkable area around the
city centre that
allows housing of at least six storeys to be built?
Support – 1200m is appropriate
1
Do not support – I think the walkable area should be bigger
2
Do not support – I think the walkable area should be smaller
3
Other (please tell us)
4
Don’t know / Don’t have enough information to say
5
Q6
The Council is proposing a walkable area of
800 metres (about a 10-minute walk) from the edge of the big
metropolitan centres.
The metropolitan centres are Albany, Takapuna, Westgate, Henderson, New Lynn, Newmarket, Sylvia Park,
Botany, Manukau, Papakura and Pukekohe.
Prepared by Kantar Public | 8-Jun-22
Page | 56

National Policy Statement on Urban Development 2020 and 2021 amendments to the Resource Management Act –
Public Opinion Survey
What do you think of the proposed distance of
800 metres for a walkable area around the
metropolitan
centres that allows housing of at least six storeys to be built?
Support – 800m is appropriate
1
Do not support – I think the walkable area should be bigger
2
Do not support – I think the walkable area should be smaller
3
Other (please tell us)
4
Don’t know / Don’t have enough information to say
5
Q7
The Council is proposing a walkable area of
800 metres (about a 10-minute walk) around
a train station or
a Northern Busway station.
What do you think of the proposed distance of
800 metres for a walkable area around
a train or busway
station that allows housing of at least six storeys to be built?
Support – 800m is appropriate
1
Do not support – I think the walkable area should be bigger
2
Do not support – I think the walkable area should be smaller
3
Other (please tell us)
4
Don’t know / Don’t have enough information to say
5
Prepared by Kantar Public | 8-Jun-22
Page | 57
National Policy Statement on Urban Development 2020 and 2021 amendments to the Resource Management Act –
Public Opinion Survey
NEW SCREEN
These next questions are about allowing higher-density housing to be built in and around suburban
town centres in
Auckland
.
The Government wants more people to live closer to these centres so that more people can walk to shops and
services.
The residential area around a centre that allows for higher-density housing of up to four storeys to be built is called
the Terrace Housing and Apartment Buildings zone.
By terrace housing, we mean rows of houses that share both side walls with neighbouring properties.
DS: SET UP TIME STAMP. IF LESS THAN 10 SECONDS SHOW: You looked at the information we just showed you
very quickly. Please ensure you have read all the information before continuing.
Prepared by Kantar Public | 8-Jun-22
Page | 58
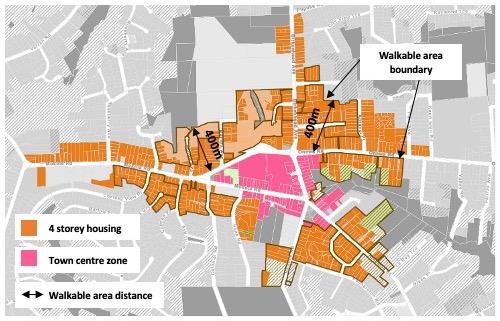
National Policy Statement on Urban Development 2020 and 2021 amendments to the Resource Management Act –
Public Opinion Survey
Q8
The Council is proposing to put the Terrace Housing and Apartment Buildings zone in an area around
400
metres (about a 5-minute walk) from
large town centres.
Large town centres are larger suburban centres in Auckland, with a wide range of shops, services and
activities. They are not as large as the metropolitan centres. Examples are (TAILOR TO RESPONDENT’S
LOCAL BOARD).
What do you think of the proposed distance of
400 metres around
large town centres for this zone that
allows higher density housing?
Support – 400m is appropriate
1
Do not support – I think the zone should be bigger
2
Do not support – I think the zone should be smaller
3
Other (please tell us)
4
Don’t know / Don’t have enough information to say
5
Prepared by Kantar Public | 8-Jun-22
Page | 59
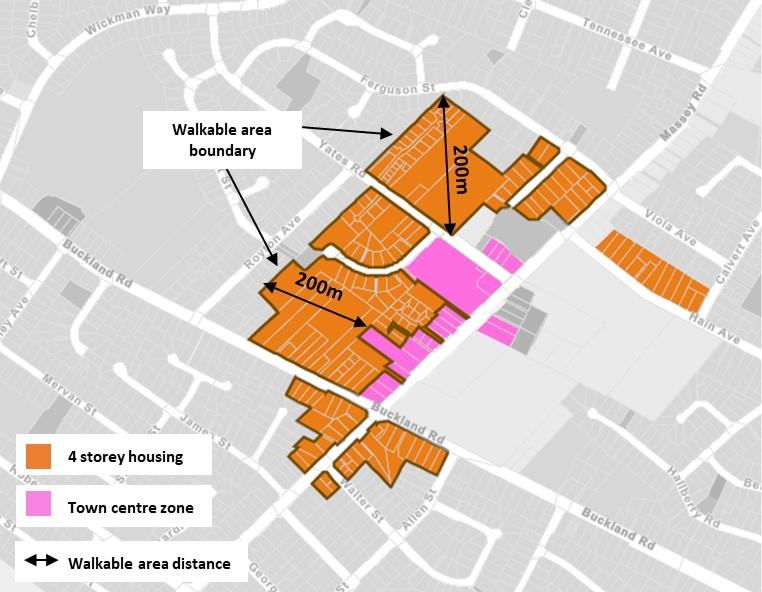
National Policy Statement on Urban Development 2020 and 2021 amendments to the Resource Management Act –
Public Opinion Survey
Q9
Auckland Council is proposing to put a Terrace Housing and Apartment Buildings zone in an area around
200 metres (about a 3-minute walk) from
small town centres.
These are suburban centres in Auckland, with a smaller range of shops, services and activities. Examples are
(TAILOR TO RESPONDENT’S LOCAL BOARD).
What do you think of the proposed distance of
200 metres around
small town centres for this zone that
allows higher density housing?
Support – 200m is appropriate
1
Do not support – I think the zone should be bigger
2
Do not support – I think the zone should be smaller
3
Other (please tell us)
4
Don’t know / Don’t have enough information to say
5
Prepared by Kantar Public | 8-Jun-22
Page | 60
National Policy Statement on Urban Development 2020 and 2021 amendments to the Resource Management Act –
Public Opinion Survey
Q10
Earlier in this survey we explained that the Government is introducing new rules aimed at increasing the
supply of housing in New Zealand. This will mean taller and more dense housing across much of Auckland.
As you will also have learnt in the last few questions, Auckland Council is able to make some decisions that
will affect how the rules are applied.
So, overall, would you say the new rules and the proposals for how they will be applied are a positive or
negative thing for Auckland?
REVERSE ORDER OF CODES 1 TO 5 FOR 50% OF SAMPLE.
Very positive
1
Somewhat positive
2
Neither positive nor negative
3
Somewhat negative
4
Very negative
5
Don’t know
6
Q11
Thinking generally about how the Government and Auckland Council should plan for more housing in
Auckland,
what’s most important to you personally?
Select the two most important.
DS: RANDOMISE ORDER OF LIST (EXCEPT OTHER AND DK)
Enough housing for everyone
Decisions that result in less traffic congestion
Growing the building industry and supply chains
Infrastructure that can cope (e.g water, wastewater, roads, public transport)
Building housing that is close to current transport, shops, community services
Building housing that is close to the city centre
Building housing that is on the edge of Auckland (growing the geographic size of
Auckland)
Protecting ‘special character’ areas (e.g. heritage buildings and villas)
Something else (please tell us)
Don’t know
Prepared by Kantar Public | 8-Jun-22
Page | 61
National Policy Statement on Urban Development 2020 and 2021 amendments to the Resource Management Act –
Public Opinion Survey
Q12
What is your overall view on population growth in Auckland?
Move the slider to show us what you think.
DS: SET UP AS SLIDING SCALE USING 5 POINTS. ALLOW DON’T KNOW BOX.
I think population growth
I think population growth is
is very bad for Auckland
very good for Auckland
Finally, we have a few questions so that we understand the different types of Aucklanders we’ve surveyed.
Q13.
Do you currently…?
Own the property you live in with a mortgage
1
Own the property you live in with
no mortgage
2
Rent the property you live in
3
Live with family / boarding
4
Other
5
Prefer not to say
6
Q14.
Which of these best describes the property you live in?
Standalone house
1
Semi-detached or terrace house
2
Single flat/apartment/unit in a
1-3 storey building (including granny 3
flats and house split into self-contained units)
Single flat/apartment/unit in a building with
more than 3 storeys
4
Other (please tell us)
5
Don’t know
6
Q15
What is your highest
completed education qualification?
No qualification
1
School Certificate or NCEA level 1
2
Sixth Form Certificate or NCEA Level 2
3
Bursary, Scholarship, University Entrance or NCEA level 3 or 4
4
A trade qualification
5
A certificate or diploma that does not require a degree
6
A polytech degree
7
A university degree
8
A postgraduate qualification (e.g. Honours, Masters, Doctorate,
9
Fellowship, Postgraduate Diploma)
Other (please tell us)
10
Unsure
11
Prepared by Kantar Public | 8-Jun-22
Page | 62
National Policy Statement on Urban Development 2020 and 2021 amendments to the Resource Management Act –
Public Opinion Survey
Local board (19 not 21)
Large town centres
Small town centres
Pt Chevalier
Balmoral
Mt Albert
Eden Valley
Albert-Eden
Green Lane
Ellerslie
St Lukes
Devonport
Belmont
Devonport-Takapuna
Milford
Hauraki Corner
Sunnynook
Franklin
Te Atatu
Te Atatu South
Henderson-Massey
Ranui
Browns Bay
Mairangi Bay
Whangaparaoa
Greville
Hibiscus and Bays
Orewa
Silverdale
Highland Park
Botany Junction
Howick
Pakuranga
Meadowlands
Glenfield
Kaipātiki
Northcote
Birkenhead
Mangere
Mangere East
Māngere Ōtāhuhu
Otahuhu
Manurewa
Manurewa
Glen Innes
Maungakiekie-Tamaki
Onehunga
Panmure
Parnell
Greenlane West
Ōrākei
Remuera
Kepa Road / Eastridge
Meadowbank
Otara
Dawsons Road
Ōtara-Papatoetoe
Papatoetoe
Hunters Corner
Papakura
Three Kings
Lynfield
Puketāpapa
Stoddard Rd
Royal Oak
Rodney
Helensville
Upper Harbour
Albany Village
Glen Eden
Swanson
Waitakere Ranges
Newton - Upper Symonds
Grey Lynn
Waitemata
Street
Prepared by Kantar Public | 8-Jun-22
Page | 63
National Policy Statement on Urban Development 2020 and 2021 amendments to the Resource Management Act –
Public Opinion Survey
Ponsonby
Whau
Avondale
Prepared by Kantar Public | 8-Jun-22
Page | 64