s 9(2)(a)
19 February 2021
s 9(2)(a)
Vicky Roberston
Secretary for the Environment
PO Box 10362
Wellington 6143
THE ACT
Concerns Re Reporting on Forest and Rural Fire Danger Levels
Introduction
The Ministry for Environment/Stats NZ ‘Our atmosphere and climate 2020’ report published in October
2020 includes a number of failings in the methods used to support the commentary on ‘The Risk of
Wildfires Changing’. These include;
1) The 17 year period used, from the 30 sites is from 2020 to 2017, is insufficient to support such
UNDER
findings. To use such a short period to assess changes in fire danger levels do not fully reflect the
history on changes if any in the fire danger levels throughout the New Zealand forest and rural
landscape. The statements made in the report relating to “the Risk of Wildfires Changing’ has
resulted in misleading the discussions on the impacts of changes in climate to fire danger levels. This
has also allowed flawed statements to be made by media on this topic.
2) In the Ministry for Environment/Stats NZ section of the report it refers to a 2017 NIWA Fire Risk
Assessment Report. From the thirty sites referenced in this NIWA report eighteen sites involved a
INFORMATION
fire risk assessment using the Grasslands Fire Danger Class outputs from the NZ Fire Danger Rating
1982
System (NZFDRS). The use of the Grassland Fire Danger Classes raises a number of concerns. The
Grassland Fire Danger Class involves the use of the Initial Spread Index (ISI) from the NZFDRS, and
the degree of grassland curing. This degree of curing is a manual assessment at a representative
grassland site near the Remote Automatic Weather Station (RAWS). It needs to involve a detailed
weekly inspection of changes in the dry matter levels along a 100 meter grasslands transect.
RELEASED
Media Reports
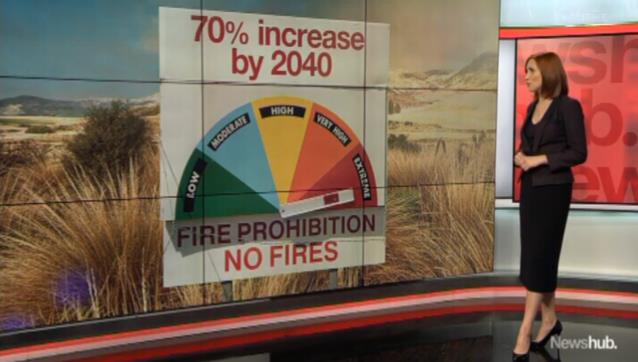
An example of what was reported as
alarmist and distorting statements by
the media on the Ministry for
Environment/Stats NZ Report was on
OFFICIAL
TV3 News on 15th October 2020. TV3
suggested there would be a 70%
increase in fire danger levels by 2040;
In addition Stuff also report on the 15 October 2020 that “By 2040, days with very high or extreme fire
danger periods are projected to increase by an average of 70 percent, due to hotter, drier and windier
conditions, the report says. The largest increases are projected for areas that are not accustomed to fire.
Wellington could experience a doubling to 30 days a year and coastal Otago a tripling to 20 days a year.”
Such statements cannot be supported by the facts.
Degree of Curing
The Degree of Curing component of the NZ Grassland Fire Danger Class required the assessment of
levels of grassland curing at a site near each RAWS. The most satisfactory means of estimating the
Degree of Curing is by direct observations for an area which represents the “typical situation” in which
THE ACT
most wildfires are expected to occur; ideally, the location should be within a few kilometers of a fire
weather station. Obviously this will require considerable judgement on the part of local fire managers. A
permanent transect 100 metres in length should be established for the Degree of Curing assessment
rather than relying on a roadside check or observations from a distance. Ideally, the transect should be
marked with a steel post at each end as this permanent installation will allow comparisons to be made
not only during the current fire season, but also from one fire season to another.
The sampling should be done by the same person. Observations are not required to be made on a daily
basis but should be done at least every week or 10 days. Ten evenly spaced out samples (@ 10 m, @ 20
m, etc.) should be evaluated along the transect line Care and judgement must be exercised in making
UNDER
the visual estimates of Degree of Curing. The best method is to locate a 1.0 metre by 1.0 metre sized
frame (made out of small diameter wooden dowelling, light-weight aluminum or similar material)
immediately in front of the toe where the sampler has paced the required distance. Mentally estimate,
by volume not cover, the cured (i.e., dormant) or dead material in each quadrat to the nearest 5
percent. Often the grass must be pried apart to determine the amount of dead material underneath the
current season’s growth, but still undecomposed. Following this, determine an average for the entire
transect.
INFORMATION
1982
Estimates of cured or dead material less than 50 percent should be considered very carefully. These
situations occur only when no litter (excluding decomposed material) or standing dead stems remain
from the previous season’s growth. Initially, when the observer is “calibrating” his/her visual
assessment, and then periodically, as a check, all the material within the frame should be clipped, the
dead and live material separated and the volume of each determined by ocular means or by drying in a
RELEASED
forced-air drying oven and weighed on a electronic balance if such equipment is readily available. If a
camera is available, a photo be taken at the time of each visit to the site from the starting post looking
down the transect and perhaps of a “representative quadrat” or two. A permanent record of the degree
of curing assessments along with this photographic record should be kept giving the name of the
assessor, date of the assessment, the estimated percentages and the mean value. Before the use of the
Grassland Fire Danger Class, in any formal assessment/study, confirmation is required to ensure the
correct process is use to assess the degree of curing at any of the sites used in the study.
OFFICIAL
The impact of recent climate on fire danger levels in New Zealand
Further research to determine the impacts of recent climate on fire danger levels in New Zealand has
recently been completed (Dudfield, Pearce, Cameron - February 2021). Using a number of outputs from
the Fire Danger Rating System the research question was "Is the fuel available to burn over the past 20

years any greater than for the period prior to the year 2000". The research involved the analyses of fire
weather data for up to 60 years from 15 sites throughout NZ. This study looked to analyse three key
components of Drought Code (DC), Build Up Index (BUI) and Initial Spread Index (ISI) from the daily
outputs from the NZ Fire Danger Rating System. These historical data sets ranged in length from 24 to 59
years. The results from this largely qualitative analysis shows a trend that fuel availability for combustion
has seen an overall reduction over the past 20 years when compared with the period prior to 2000.
This study uses daily climatology records from 15 weather stations located within different regions
throughout New Zealand. Data was obtained from the Fire Weather System managed for Fire and
Emergency New Zealand by the National Institute of Water and Atmospheric Research (NIWA), and
records for discontinued Meteorological Service of NZ stations updated to June 2020 with synoptic data
THE ACT
provided by MetService.
The study looked at two groups of fire danger indicators. These included:
1) The monthly maximum BUI, DC and ISI values from historical data sets for the 15 weather
stations ranging in length from 24 to 59 years. For stations with data available for more than 20
years prior to 2000, this was trended against the 20-year period following 2000. For those
stations with historical indicators covering a 24-year period only, this data was split to compare
two 12-year periods
2) The number of days with DC greater than 300, BUI greater than 60 and ISI greater than 10 were
identified, and a five-year rolling average was then applied to each station.
UNDER
The high level-results of this assessment are outlined in Table 1. For the 90 fire danger indicators across
the 15 weather stations, 68 (77%) of the indicators showed a no change to a nominal or notable
decrease, versus 22 (23%) of the indicators showing a nominal to notable increase.
INFORMATION
1982
RELEASED
OFFICIAL
Table 1: Summary of changes in fire danger for 15 weather station locations across New Zealand
In fact, more stations showed decreases in fire dangers for the period since 2000 compared to the
period prior to 2000, whether nominal or notable. Gisborne, Nelson, Blenheim and Christchurch mainly
showed decreases, including many notable decreases, plus Invercargill and Paraparaumu also showing
THE ACT
UNDER
INFORMATION
1982
RELEASED
OFFICIAL