


 THE EFFICACY OF BRUSH-ON REMEDIAL
TREATMENTS ON RADIATA PINE FRAMING
42-MONTH REPORT – September 2012
Dave Page, Ian Simpson, Jackie van der Waals and Tripti Singh
THE EFFICACY OF BRUSH-ON REMEDIAL
TREATMENTS ON RADIATA PINE FRAMING
42-MONTH REPORT – September 2012
Dave Page, Ian Simpson, Jackie van der Waals and Tripti Singh
 THE EFFICACY OF BRUSH-ON REMEDIAL TREATMENTS
ON RADIATA PINE FRAMING
42-MONTH REPORT – September 2012
THE EFFICACY OF BRUSH-ON REMEDIAL TREATMENTS
ON RADIATA PINE FRAMING
42-MONTH REPORT – September 2012
Dave Page, Ian Simpson, Jackie van der Waals and Tripti Singh
Report prepared for:
Building and Housing,
Ministry of Business Innovation and Employment
PO Box 10729
Wellington
Correspondence to:
Approved for Release
Project Leader
Bioactives and Wood Preservation Project
Leader
Private Bag 3020
ROTORUA
Date: November 2012
Phone: (07)
343-5777
Fax: (07)
343-5507
The opinions provided in the Report have been provided in good faith and on the basis that
every endeavour has been made to be accurate and not misleading and to exercise reasonable
care, skill and judgement in providing such opinions. Neither Scion nor any of its employees,
contractors, agents or other persons acting on its behalf or under its control accept any
responsibility or liability in respect of any opinion provided in this Report By Scion
NEW ZEALAND FOREST RESEARCH INSTITUTE LIMITED
All rights reserved. Unless permitted by contract or law, no part of this work may be reproduced, stored or copied
in any form or by any means without the express permission of the NEW ZEALAND FOREST RESEARCH
INSTITUTE LIMITED
`THE EFFICACY OF BRUSH-ON REMEDIAL TREATMENTS
ON RADIATA PINE FRAMING
42-MONTH REPORT – September 2012
Dave Page, Ian Simpson, Jackie van der Waals and Tripti Singh
SUMMARY
Untreated radiata pine framing timber was exposed to brown rot decay fungi and then treated
with brush-on remedial preservatives. It was rewet and exposed in humid conditions over a
three year period. Framing samples were assessed for decay and tested for deflection at
regular intervals during the exposure period.
Treatment on three or four sides with a boron/glycol mixture gave effective protection against
brown rot decay. Brush application on one or two edges was insufficient to stop further decay
in pre-infected samples though there was very little change in deflection in samples treated on
two edges.
Treatment with a copper naphthenate and kerosene mixture at the concentrations used slowed
decay development but did not prevent it, regardless of the number of surfaces coated.
In samples treated with boron, some preservative was lost during wetting after treatment but
the remaining preservative distributed through the sample cross section, including in samples
where the moisture content was below 30%.
In copper naphthenate treated samples, preservative penetration was generally limited to a 5-
10 mm envelope around the outside. Preservative retention and distribution did not change
during the exposure period.
INTRODUCTION
Problems with the decay of untreated, kiln-dried radiata pine house framing when water
penetrated the external covering (leaky buildings) became prominent in the late 1990’s.
While building regulations requiring the preservative treatment of radiata pine framing were
re-introduced in 2003, a large number of deteriorating buildings constructed in the previous
decade continued to require extensive repairs. This generally included re-cladding and
replacement of unsound framing. Where framing appeared to be still sound, it was allowed to
dry out and some type of brush-on remedial treatment was applied before new cladding was
installed. The efficacy of these brush-on treatments in this type of situation had not been
widely tested and there were many situations within buildings where the in-situ application of
preservative could only reach one or two surfaces of the components. There was also some
uncertainty about the identification of “incipient decay” and whether apparently sound timber
adjacent to decaying timber could be successfully protected by brush-on remedial treatments.
The possibility that minor decay in timber could be stopped by brush-on treatments was also
questioned.
At that time there were two types of remedial treatment preservatives readily available to
builders. These included a copper naphthenate concentrate that was diluted with a light
Page1
organic solvent such as kerosene or white spirits and the other was a boron/glycol solution.
Zinc naphthenate concentrate was also available and being used for non-commercial
applications but was regarded as a less effective fungicide than copper naphthenate.
This trial was established to determine:
Whether copper naphthenate or boron brush-on treatments would be effective in
controlling decay on framing that already contained incipient or lightly established decay
The number of surfaces of a partially degraded component that needed to be coated to
control decay
The extent of decay that could be present in a component before it was significantly
weakened
MATERIALS AND METHODS
Radiata pine sapwood framing, kiln dried and planer gauged to 90 mm x 45 mm, was cut into
one metre long samples. A set of samples that had been commercially treated with boron to
the H1.2 specification were also included. There were two exposure groups, high moisture
content (HMC) samples, greater than 30% moisture content and low moisture content (LMC)
samples, 25-30% moisture content. Samples were allocated randomly to the groups shown in
Table 1.
TABLE 1 – SAMPLE TREATMENT AND EXPOSURE GROUPS
Group Code
Copper
Number of
Pre-decay
Number
Number
naphthenate Boron
Exposure
samples
period
of edges
of faces
treated
treated
Type
/group
(weeks)
treated
treated
C61H B61H HMC 20
8
1
-
C62H B62H HMC 20
8
2
-
C63H B63H HMC 20
8
2
1
C64H B64H HMC 20
8
2
2
C31H B31H HMC 20
4
1
-
C32H B32H HMC 20
4
2
-
C33H B33H HMC 20
4
2
1
C34H B34H HMC 20
4
2
2
C62L B62L LMC 10
12
2
-
C64L B64L LMC
10 12 2 2
C32L B32L LMC
10 7 2 -
C34L B34L LMC
10 7 2 2
B3H
HMC
20
4 H1.2
treated
B3L
LMC
10
7 H1.2
treated
U3H (untreated)
HMC
20
4
-
-
U3L (untreated)
LMC
10
7
-
-
UMH (untreated)
HMC
20
nil
-
-
UML (untreated)
LMC
10
nil
-
-
The samples were all weighed and their moisture content was determined by oven drying
biscuits cut from between the samples. An oven-dry weight was calculated for each sample
Page2
using this moisture content data. All samples were end sealed with epoxy paint and later
soaked in water until their moisture content was above 30%.
Small 35 mm square blocks of radiata pine sapwood that had been pre-infected with selected
brown rot decay fungi, either
Oligoporus placenta for samples to be exposed in wetter HMC
conditions or
Gloeophyllum sepiarium for samples that were to be exposed in drier LMC
conditions, were attached near the centre of each sample on one edge. The samples were
stacked in sealed plastic tanks with 20 mm thick plastic fillets separating the layers. In each
tank there was a small amount of water in the bottom and a wet foam plastic blanket in the
top to maintain high humidity. The tanks were kept in a laboratory where the ambient
temperature was 15-20o C. The intention was to pre-decay samples for two periods, the first
just sufficient to produce “incipient decay” in the samples, the second to produce more
established decay. Half of the HMC samples were left in the pre-decay tanks for four weeks,
the remainder for eight weeks. The
G. sepiarium decay blocks were slower to develop on the
LMC samples and half of these samples were in the tanks for seven weeks, the remainder for
twelve weeks. The commercially treated samples were kept in the tanks for four weeks,
(HMC exposure samples) or seven weeks (LMC exposure samples).
At the end of the decay exposure period, samples were removed from the tanks, reweighed,
assessed for mould, mycelium spread and decay using the rating systems in Appendix I.
Decay feeder blocks were removed and external decay mycelium was cleaned off. Samples
were then tested for deflection as a plank in a mechanical strength testing machine before
being placed in filleted stacks in the laboratory. Large fans were used to blow air through the
stacks until the sample moisture content was below 20%.
Remedial treatment products were applied, either 50/50 copper naphthenate and kerosene
(1.2% Cu w/v) or a boric acid/borax mixture in monoethylene glycol (20% Boric Acid
Equivalent). The surfaces coated were:
One surface
the edge that did not have a feeder block on it (HMC exposure only)
Two surfaces both edges (HMC and LMC exposure)
Three surfaces both edges and the numbered face (HMC exposure only)
All four sides (HMC and LMC exposure)
Samples were weighed, coated, reweighed, allowed to dry for 30 minutes, reweighed,
recoated and reweighed before being returned to filleted stack, where they were left
overnight.
The samples were then re-soaked in water until the moisture content was above 30% for the
HMC exposure samples or 25-30% moisture content for the LMC exposure samples. They
were then re-weighed, tested for deflection and placed in filleted stacks, either in sealed tanks
(HMC exposure samples) or in a controlled conditions room where the humidity was 95%
and the temperature 25oC (LMC exposure samples). Conditions in the HMC tanks were
similar to those for the pre-treatment decay period except that the tanks were stored outside to
provide similar temperatures that would be encountered in normal leaky building framing.
Every 2-3 weeks during the exposure period the lids and foam plastic blanket were removed
from the tanks and the samples were sprayed with water to ensure that the moisture content of
the samples in the tanks remained above 30%. The LMC exposure stack was protected from
direct wetting by humidity sprays with plastic covers. This ensured that most of the LMC
samples stayed at a moisture content of 25-30%, (the equilibrium moisture content (EMC) for
radiata pine at 25oC and 95% humidity is about 26%). A few samples on the outside of the
Page3
stack and in the lower layers became slightly wetter due to condensation splashes on the floor
and drips under the stack covers.
The trial was assessed for decay, mould and deflection at eight-week intervals from the start
of the post-treatment exposure period in September 2009 to September 2010 and then at six-
monthly intervals until September 2012. Full sample, preservative treatment, installation and
progress details are in earlier reports. This report outlines installation of the trial, the
condition of the samples at the end of the trial and major changes that occurred during the
exposure period.
ASSESSMENT METHODS
For all assessments during the trial, samples were removed from the high moisture content
exposure tanks (HMC) and low moisture content stack (LMC), weighed and measured.
Visual assessments of decay mycelium development and mould infection were completed
using the ratings systems shown in Appendix I. Moisture content calculations were based on
changes in sample weight. The surfaces of each sample were tested with a blunt probe to
determine whether the decay fungi were damaging the framing. Deflection as a plank under a
constant load was measured. Modulus of Elasticity (MOE) for each sample was calculated
using sample cross-section and deflection measurements.
After assessment the samples were returned to their original exposure positions. The HMC
samples were sprayed with water as they were re-installed but the LMC samples were
protected from wetting.
After the 159-week, final assessment, five samples for each preservative type, that had been
treated on all four sides, were removed from each of the HMC and the LMC exposure groups.
Biscuits were removed from each sample for chemical analysis and for reagent testing to
determine the penetration of the preservative and the extent of decay. The analyses biscuits
were taken 150 mm from each end of the sample, reagent testing biscuits were taken at the
same points and from the centre of the sample adjacent to the original decay feeder block
position.
RESULTS
Preservative uptake data indicated that the preservative retention in all of the copper
naphthenate treated samples was well below the minimum of 0.10% (w/w Cu) required by
the H3.1 specification in NZS 3640:2003 (Chemical Preservation of Round and Sawn
Timber). Preservative retentions in samples treated with boron on three or four sides were
generally above the minimum 0.4% BAE requirement of the H1.2 specification (Table 2).
Application rates of copper naphthenate on samples treated on one or two edges were lower
than for other treatment groups. This was caused by most of the samples being flat-sawn
hence the edges were less absorbent than the faces of the samples. As a result, less of the low
viscosity, solvent based copper naphthenate preservative was retained on the edges during
brush application, whereas the relatively sticky boron/glycol mixture stayed on the edges and
was gradually absorbed during the period immediately after application.
Page4
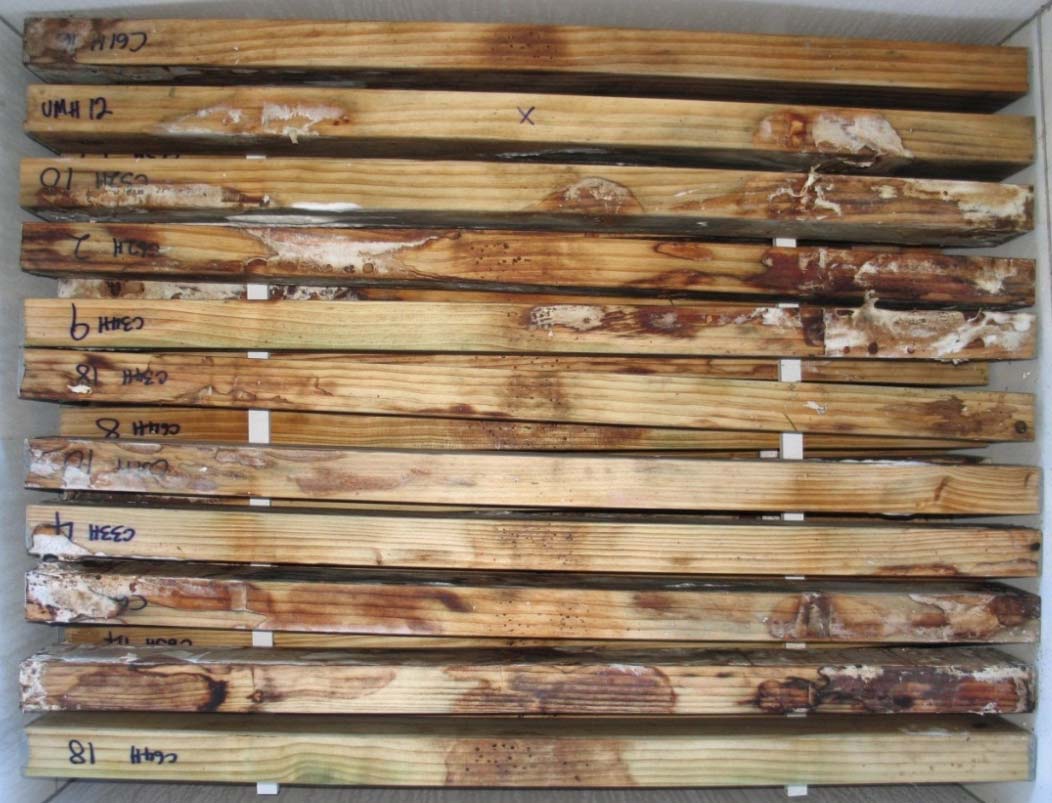 TABLE 2
PRESERVATIVE APPLICATION RATES AND RETENTION
Copper Naphthenate
Boron
Application
Retention
Application
Retention
Treatment
Rate (g/m2)
(g/100g Cu)
Rate (g/m2)
(g/100g BAE)
HMC Samples
One edge
149
0.006
182
0.107
Two edges
140
0.011
184
0.220
One face, two edges
188
0.028
182
0.426
Four sides
220
0.042
211
0.650
LMC Samples
Two edges
168
0.013
179
0.215
Four sides
241
0.048
214
0.693
Decay mycelium was becoming established on the untreated surfaces of samples within six
months of installation in the exposure stacks, generally spreading from the area originally
infected by the decay feeder blocks. This progressed steadily, particularly on the untreated
samples and those treated on only one edge. After 12 months mycelium spreading onto
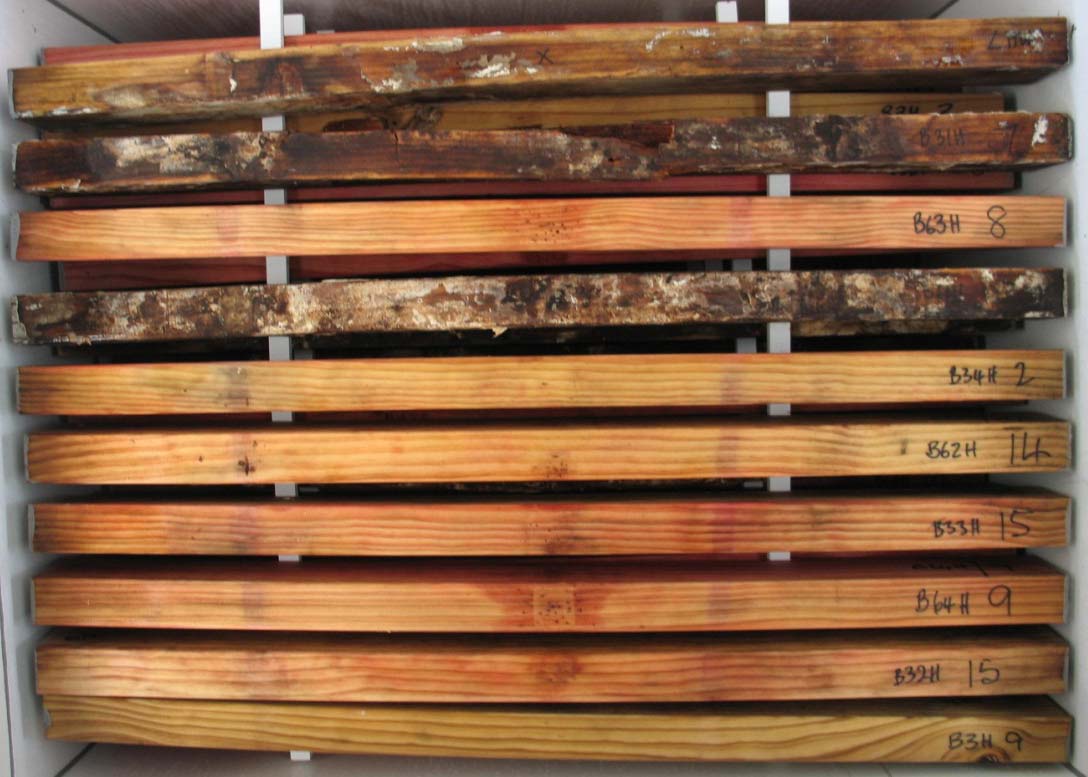
surfaces treated with copper naphthenate in the HMC tanks was recorded. Mycelium
development on copper naphthenate treated surfaces in the HMC tanks continued throughout
the trial although decay of the underlying wood was usually slow to develop (Figure 1).
Figure 1 – Decay on copper naphthenate treated samples after 159 weeks exposure, HMC
tank 1, layer 5, (2nd from top). Extensive decay mycelium on the samples including
on treated surfaces, still active and progressive.
Page5
By comparison there was no decay mycelium on boron treated surfaces and where decay
mycelium developed on untreated surfaces in the boron exposure tanks it began to degenerate
after two years exposure and was largely inactive by the end of the trial (Figure 2).
Figure 2 – Decay on boron treated samples, HMC tank 6, layer 6 (top layer). Extensive
decay mycelium on the untreated sample (top) and two samples treated on the
lower edge only, either side of sample B63H/8. No decay visible on the other
treated samples and existing mycelium on untreated surfaces shows little sign of
recent activity.
Moisture content and mould ratings at annual intervals are summarised in Table 3. Similar
decay ratings and deflection data are summarised in Table 4.
The moisture content of the LMC samples remained relatively constant through the exposure
period, generally close to 25% but slightly lower in the latter six months of the trial. Samples
in the bottom three layers of the LMC stack were slightly wetter than average, mainly above
30% moisture content, due to splashing and condensation from the wet floor area.
Mould infection was relatively severe on untreated surfaces and ratings changes were
relatively minor through the latter part of the exposure period.
The average moisture content of the HMC samples generally stayed above 30% throughout
the exposure period although there was considerable variation between samples. Those in the
upper two layers of each tank were wetter than average and boron treated samples tended to
stay slightly wetter than the copper naphthenate treated samples.
Page6
TABLE 3
ANNUAL MOISTURE CONTENT AND MOULD RATINGS
Treatment
Group
Moisture Content %
Mould Ratings
Code
56 weeks 108 weeks
159 weeks
56 weeks
108 weeks
159 weeks
High Moisture Content Groups
C61H
38
431
431
4.6
4.5
4.3
C62H
37
321
331
4.6
4.4
4.4
C63H
42
41
49
3.9
4.1
3.8
C64H
41
39
50
3.0
3.2
2.9
B61H
34
311
441
4.9
4.9
4.5
B62H
38
35
53
5.0
4.7
4.4
B63H
45
37
52
4.1
4.2
3.6
B64H
58
49
58
3.1
3.2
3.0
C31H
41
441
431
4.4
4.3
4.3
C32H
37
341
311
4.1
4.2
4.1
C33H
37
42
511
3.5
3.6
3.8
C34H
39
37
441
2.8
2.9
2.9
B31H
34
291
431
4.8
4.8
4.4
B32H
36
36
52
4.8
4.6
4.4
B33H
43
38
49
3.8
4.2
3.6
B34H
50
42
57
3.0
3.3
2.8
B3H
53
52
81
2.4
2.3
2.6
U3H
33
311
311
4.2
4.4
4.4
UMH
36
37
50
4.4
4.6
4.6
Low Moisture Content Groups (157 weeks)
C62L
23
21
211
4.1
4.6
4.4
C64L
25
23
191
3.5
4.3
4.1
B62L
24
25
24
3.8
4.4
4.0
B64L
29
31
30
2.3
2.3
2.2
C32L
26
22
191
4.1
4.7
4.4
C34L
27
25
23
3.6
4.0
3.7
B32L
27
27
27
3.9
4.1
3.9
B34L
28
32
28
2.2
2.2
2.3
B3L
30
34
34
2.2
2.2
2.1
U3L
25
22
191
4.1
4.6
4.3
UML
27
25
241
4.0
4.3
4.3
1 Extensive decay in some samples from this group reduced their weight, therefore moisture content
calculations based on weight are likely to be inaccurate.
Page7
TABLE 4
ANNUAL MYCELIUM SPREAD, INDEX OF CONDITION AND DEFLECTION
Group
Mycelium Spread Rating
Index of Condition1
Deflection (mm)
Code
56-wk 108-wk 159-wk
56-wk
108-wk
159-wk
56-wk
108-wk 159-wk
High Moisture Content Groups (159 weeks)
C61H
3.4
4.2
5.3
7.6
6.5(1)3
4.5(3)
2.36
3.04
3.92
C62H
3.6
4.2
5.4
7.8
6.5(1)
4.3(3)
2.46
2.94
4.26
C63H
3.1
3.2
4.3
8.0
7.6
6.1(2)
2.16
2.31
3.07
C64H
1.1
1.9
2.4
8.0
7.8
7.6
2.16
2.22
2.30
B61H
3.6
4.1
4.7
7.3
6.5
5.6
2.31
2.92
3.25
B62H
1.5
1.5
1.7
8.0
8.0
8.3
2.38
2.40
2.44
B63H
1.2
1.1
1.1
8.3
8.2
8.6
2.13
2.16
2.20
B64H
1.0
1.0
1.0
8.2
8.1
8.5
2.19
2.24
2.25
C31H
3.3
4.3
5.1
7.6
6.9
4.7(4)
2.46
2.93
4.31
C32H
3.2
4.2
5.5
7.9(1)
6.3(1)
3.5(8)
2.50
3.06
5.20
C33H
2.1
3.2
4.6
8.7
7.8
6.5
2.47
2.64
3.11
C34H
1.3
2.7
3.8
8.8
8.3
6.7(2)
2.29
2.46
3.15
B31H
4.1
4.5
5.0
6.9
6.0
4.6(2)
2.69
3.62
4.26
B32H
1.7
1.6
1.8
9.0
8.5
8.9
2.30
2.32
2.37
B33H
1.0
1.0
1.0
9.5
9.2
9.8
2.33
2.32
2.36
B34H
1.0
1.0
1.3
9.3
8.9
9.4
2.18
2.19
2.24
B3H2
1.0
1.0
1.0
10.0
10.0
10.0
3.88
3.88
3.93
U3H
3.9
4.5
5.2
7.2
5.1(4)
2.9(10)
2.66
4.11
5.76
UMH
2.7
2.4
2.9
9.4
8.5
7.7(2)
2.28
2.39
3.01
Low Moisture Content Groups (157 weeks)
C62L
3.1
3.8
3.4
6.4(1)
5.4(2)
4.7(3)
3.19
3.75
4.21
C64L
1.3
1.6
1.8
7.9
7.3
7.7
2.35
2.52
2.58
B62L
2.4
2.8
3.2
7.7
7.5
7.3
2.55
2.61
2.71
B64L
1.0
1.0
1.0
8.0
8.0
8.2
2.29
2.39
2.36
C32L
2.2
2.9
3.3
8.1
7.3
6.1(1)
2.22
3.15
3.29
C34L
1.0
1.1
1.0
8.2
8.0
8.1
2.08
2.21
2.18
B32L
1.1
1.6
1.7
8.3
8.1
8.3
2.09
2.18
2.18
B34L
1.0
1.0
1.0
8.2
8.4
8.4
2.30
2.39
2.36
B3L2
1.1
1.0
1.0
10.0
10.0
10.0
3.73
3.84
3.83
U3L
2.5
3.4
3.9
6.3(1)
5.0(3)
4.4(3)
3.37
4.21
4.18
UML
1.7
1.9
2.2
9.6
8.1(1)
7.5(1)
2.25
2.99
3.02
1 Index of Condition is the average decay rating for all of the samples in a group.
2 This group was framing grade timber, all other groups were clears grade sapwood.
3 The number of samples in the group that had failed (in parenthesis).
If the type of preservative used and exposure conditions are ignored, there were only minor
changes in average decay ratings and MOE for samples treated on four surfaces, throughout
the trial period (Figures 3 and 4). For samples treated on two edges and one face average
ratings were similar to the samples treated on four sides until the last assessment when decay
ratings declined more rapidly. From the outset, MOE for these samples was generally lower
than for samples treated on four sides but changes over the first 137 weeks mirrored those for
the samples treated on all four sides. Over the last six months exposure MOE declined more
rapidly in the samples treated on three sides.
Page8
Decay Rates ‐ Treatment groups
10.0
9.0
8.0
7.0
6.0
1 edge
Condition
5.0
2 edges
of
4.0
3.0
3 sides
Index
2.0
4 sides
1.0
control
0.0
0
40
80
120
160
Weeks
Figure 3 - Changes in the “Index of Condition”, regardless of the preservative used or the
exposure conditions, as the trial progressed.
There was a steady decline in decay ratings for samples treated on one edge or on two edges
from the 16-week assessment until the end of the trial. By the 159-week assessment the
samples treated on one edge had an Index of Condition below 5.0. This point had been
reached by untreated control samples after 108 weeks. The decline in average MOE for the
“one edge” and “two edge” treated groups did not begin to show up until the 40-week
assessment. Since then it has continued steadily with the “one edge” treatment groups losing
strength more rapidly than the “two edge” treatment groups.
MOE Changes ‐ Treatment Groups
10.00
9.00
8.00
1 edge
7.00
(GPa)
2 edges
6.00
MOE
3 sides
5.00
4 sides
4.00
control
3.00
0
40
80
120
160
Weeks
Figure 4 - The modulus of elasticity (MOE) regardless of the preservative used or the
exposure conditions, as the trial progressed.
Page9
When the MOE figures for the treatment groups are separated by preservatives, the copper
naphthenate samples treated on one or two edges show steady and similar stiffness loss
(Figure 5). The average MOE of the “three sides” copper naphthenate treated groups was
always lower than the MOE of the “four sides” treated group but declined at a similar rate
until the 137-week assessment. Between the 137-week and the 159-week assessments the
MOE of the “three sides” treatment groups declined more rapidly.
MOE ‐ Copper Naphthenate Treatments
10.00
9.00
8.00
C 1 Edge
7.00
(GPa)
C 2 Edges
6.00
MOE
C 3 Sides
5.00
C 4 Sides
4.00
control
3.00
0
40
80
120
160
Weeks
Figure 5 - The modulus of elasticity (MOE) for copper naphthenate treated samples,
combined HMC and LMC data.
The boron treated groups were quite different (Figure 6). The MOE for all except the “one
edge” treatment groups changed very little throughout the trial. The MOE for the “one edge”
treatment groups declined steadily from the 40-week assessment until the end of the trial.
MOE ‐ Boron Treatments
10.00
9.00
8.00
B 1 Edge
7.00
(GPa)
B 2 Edges
6.00
MOE
B 3 Sides
5.00
B 4 Sides
4.00
control
3.00
0
40
80
120
160
Weeks
Figure 6 - The modulus of elasticity (MOE) for boron treated samples, combined HMC and
LMC data.
Page10
Figures 7 and 8 compare the MOE of LMC exposure stack treatment groups with the
equivalent groups from the HMC exposure tanks. These show that the samples treated on two
edges with copper naphthenate rapidly lost stiffness whereas the boron treated samples and
those treated with copper naphthenate on four sides only changed very slowly.
MOE ‐ LMC Exposure
10.00
9.00
8.00
7.00
C 2 Edges
(Gpa)
6.00
C 4 Sides
5.00
MOE
B 2 Edges
4.00
B 4 Sides
3.00
Control
2.00
0
40
80
120
160
Weeks
Figure 7 - The modulus of elasticity (MOE) in the low moisture content stack.
MOE ‐ HMC Exposure
10.00
9.00
8.00
7.00
C 2 Edges
(Gpa)
6.00
C 4 Sides
5.00
MOE
B 2 Edges
4.00
B 4 Sides
3.00
2.00
Control
0
40
80
120
160
Weeks
Figure 8 - The modulus of elasticity (MOE) in the high moisture content tanks, samples
treated on two edges or four sides only.
In the HMC tanks the samples treated with copper naphthenate on four sides began to lose
strength more rapidly than boron treated samples over the final year’s exposure. In the LMC
stack the loss of MOE in the untreated controls and the group treated with copper
naphthenate on two edges slowed over the final year’s exposure. This was associated with
Page11
severe decay developing in only those samples with higher moisture content, most of which
failed in the first two years exposure.
TABLE 5
SAMPLES WITH MODERATE-SEVERE, SEVERE DECAY OR FAILED
Copper
Naphthenate
Boron
Treatment
56-wk
108-wk
159-wk
56-wk
108-wk
159-wk
High Moisture Content Exposure (40 samples/group)
One
edge
5 12 32 7 23 36
Two edges
2
13
35
1
1
1
One face two edges
0
0
19
0
0
0
Four
sides
0 3 9 0 0 0
Control (20 samples)
5
13
17
Low Moisture Content exposure (20 samples/group)
Two
edges
3 4 6 1 1 2
Four
sides
0 0 0 0 0 0
Control (10 samples)
2
4
6
Noticeable deflection increases and changes in MOE have generally been restricted to those
samples which contained moderate-severe decay (ratings 6 or lower). The number of samples
with moderate-severe decay, severe decay and those that have failed are in Table 5. This
indicates that the percentage of samples with moderate-severe decay or worse is similar to the
control groups for copper naphthenate treated on one or two edges groups and the boron
treated on one edge group. There was a rapid increase in the number of samples with severe
decay in the copper naphthenate treated on three sides group between the 108-week and 159-
week assessments. This mirrors the more rapid loss of MOE in that group in Figure 5.
The analytical results in Table 6 show that there was no significant loss of copper
naphthenate over the exposure period whereas preservative retention in the HMC boron
treated samples has been reduced by between 24% and 55%. The sample in the upper layer of
the exposure tank (B64H/4) had the highest loss and samples lower in the tank lost
progressively less. This is partly explained by the samples in the top layer remaining very wet
through the whole of the trial period due to condensation drips from the lid and the foam
plastic blanket on top of the stack. There may also have been some preservative wash-off
when the samples were sprayed after assessment and during exposure. This is likely to have
contributed to the gradual degradation of mycelium on the surface of samples in the boron
exposure tanks. Samples in the LMC stack were not sprayed with water and condensation
drippage affected only a few in specific areas of the stack. Boron loss in the analysed samples
varied from 27% to 47%. The only time that all of the LMC samples were wet was at the start
of the exposure period when the dry, treated samples were soaked in water to raise the
moisture content above 25%. This suggests that most of the boron loss in both LMC and
HMC samples occurred during pre-exposure wetting rather than during the exposure period.
Even with this boron loss the retention in the samples remained close to or above 0.4% BAE.
Page12
TABLE 6
PRESERVATIVE RETENTION AND DECAY IN ANALYSED SAMPLES
AFTER 159 WEEKS EXPOSURE
Sample
Preservative Retention (% wt/wt)
Number
Initial1 Final Layer2
Condition3
Copper Naphthenate Samples, HMC (%Cu)
C34H/6 0.04
0.04
4
5/8
C64H/5 0.05
0.04
6
1/8
C64H/11 0.08
0.08
5
1/8
C64H/12 0.04
0.04
2
3/8
C64H/15 0.05
0.05
3
4/8
Copper Naphthenate Samples, LMC (%Cu)
C34L/2 0.03 0.02
5
1/8
C64L/1 0.06 0.06
1
3/8
C64L/3 0.04 0.04
10
3/8
C64L/8 0.06 0.06
2
1/7
C64L/9 0.04 0.05
8
1/8
Boron Samples, HMC (%BAE)4
B34H/11 0.54
0.32
4
1/9
B34H/12 0.59
0.40
3
1/9
B64H/3 0.79
0.44
5
1/9
B64H/4 0.66
0.30
6
1/9
B64H/8 0.84
0.64
2
1/8
Boron Samples, LMC (%BAE)
B34L/3 0.85 0.55
2
1/10
B34L/10 0.64
0.34
3
1/8
B64L/2 0.72 0.44
5
1/8
B64L/6 0.60 0.36
10
1/8
B64L/9 0.63 0.46
8
1/8
1 The initial retention was calculated using the weight of preservative applied and the oven dry weight
of the sample.
2 There were six layers in the HMC tanks and ten layers in the LMC stack. Layer 1 was the bottom
layer.
3 Condition is the rating for mycelium spread/decay rating for each sample. A mycelium rating of “1”
indicates that any decay present was caused by decay feeder blocks, before the samples were
treated.
4 Boric Acid Equivalent.
Table 7 compares decay ratings and MOE loss from the start of the exposure period in
samples that were spot tested in Figures 9-18. These show that there were well established
pockets of decay present in the centre of the samples before significant MOE loss occurred.
In samples where decay developed at either or both ends but not in the centre, such as in the
second to bottom sample in Figure 9, there was very little loss of MOE.
In Figures 9-18 the distribution of copper in the copper naphthenate treated samples is
relatively close to the surface and shows very little evidence of redistribution following
treatment. The boron treated samples all show that the preservative has spread through the
whole sample cross-section, even in samples that were below 30% moisture content. Given
the limited copper penetration in the copper naphthenate treated samples it is likely that
Page13
copper retention in the penetrated section would have been much closer to the H3.1
specification requirement of 0.10% Cu than the cross-sectional retention shown in Table 2.
Considering that mycelium spread onto copper naphthenate treated surfaces during the latter
part of the exposure period in the HMC tanks and a number of samples that were treated on
four sides either failed or contained severe decay (Table 5), it is unlikely that a cross-
sectional retention of 0.10% Cu would have given complete protection against brown rot
decay.
TABLE 7
DECAY RATINGS AND MOE CHANGE AFTER 159 WEEKS EXPOSURE
Sample
Decay
MOEp
MOE
Sample
Decay
MOEp
MOE
Number
Rating
(GPa)
% loss
Number
Rating
(GPa)
% loss
HMC exposure
Copper naphthenate treated 4 sides
Boron treated 4 sides
C34H/6 8 6.9 9
B34H/11 9
10.2
1
C64H/5 8 7.2 2
B34H/12 9 8.4 -1
C64H/11 8 6.4 -1
B64H/3
8 7.4 3
C64H/12 8 8.7 0
B64H/4 9 9.6 6
C64H/15 8 6.8 6
B64H/8 8 7.4 -3
Copper naphthenate treated 3 sides
Boron treated 3 sides
C33H/11 9 7.3 3
B33H/9 10 10.1 2
C33H/12 7 7.4 6
B63H/15 8 7.3 1
C63H/1 7 9.5 9
B63H/16 9 7.6 -2
C63H/3 7 7.3
11
B63H/17 8 7.8 5
C63H/9 6 8.5
16
B63H/19 9 9.9 6
Copper naphthenate treated 2 edges
Boron treated 2 edges
C32H/7 6 4.2 41
B32H/3 10 9.9 6
C32H/11 7 9.0 3
B32H/14 7 8.9 3
C62H/3 4 6.2
41
B62H/5 7 6.4 1
C62H/11 7 7.1 15
B62H/6
8 8.5 5
C62H/19 6 8.0 20
B62H/17 8 9.4 2
LMC exposure (157 weeks)
Copper naphthenate treated 4 sides
Boron treated 4 sides
C34L/2 8
11.0
-9
B34L/3 10
7.9 3
C64L/1 8 5.8
22
B34L/10 8 9.0 6
C64L/3 8 9.7
-4
B64L/2 8 7.8 1
C64L/8 7 6.0
12
B64L/6 8 9.8 7
C64L/9 8
10.3
-4
B64L/9 8
10.9
-3
Copper naphthenate treated 2 edges
Boron treated 2 edges
C32L/8 4 7.9 25
B32L/2
7 10.1 8
C62L/2 7 7.3
-9
B32L/10 7
10.6
3
C62L/8 6 9.1 9
B62L/2 8
11.3
4
C62L/9 8 7.8
-11
B62L/5 8
10.8
3
C62L/10 8 6.9 -12
B62L7
8 6.7 -6
MOE increased in a number of samples over the exposure period, particularly in the LMC
stack. This was associated with the gradual moisture content reduction in samples where
Page14
there was no decay development beyond the pre-treatment infection. The moisture content of
LMC samples was generally between 25% and 30%. This is close to or fractionally below the
fibre saturation point of radiata pine. Deflection is unlikely to be influenced by moisture
content when the wood is above fibre saturation point but will be reduced as moisture content
decreases below that. Hence MOE would have increased slightly as the moisture content of
the drier, relatively sound LMC samples declined.
Samples treated with boron on two or more sides had less decay and showed fewer MOE
changes than the equivalent copper naphthenate treated samples. Even where there was major
decay through the length of the sample, e.g., the top sample in Figure 14, there was no serious
loss of MOE. Decay in these samples was generally restricted to a strip through the centre
away from the boron treated edges and the wood either side of this remained intact. The
samples were tested for deflection as a plank, hence the decay would have had little effect on
deflection.
CONCLUSIONS
Boron glycol mixture applied to three or four sides of 50 mm thick radiata pine framing at a
rate that achieves 0.4% BAE retention will protect against decay development.
Wetting of brush-on boron treated timber will remove some of the boron but the remaining
preservative is likely to redistribute through the sapwood cross section when the moisture
content is above 25%.
Copper naphthenate in kerosene at the applied retention slowed brown rot decay development
but did not prevent it. The application of higher strength preservative solution may have
reduced decay spread on the surface but limited penetration is unlikely to prevent internal
decay development.
After effective remedial treatment, framing with small amounts of decay on it is unlikely to
fail in normal building situations. Small amounts of decay, if not remedially treated, are
likely to continue to develop if timber is rewet.
Page15
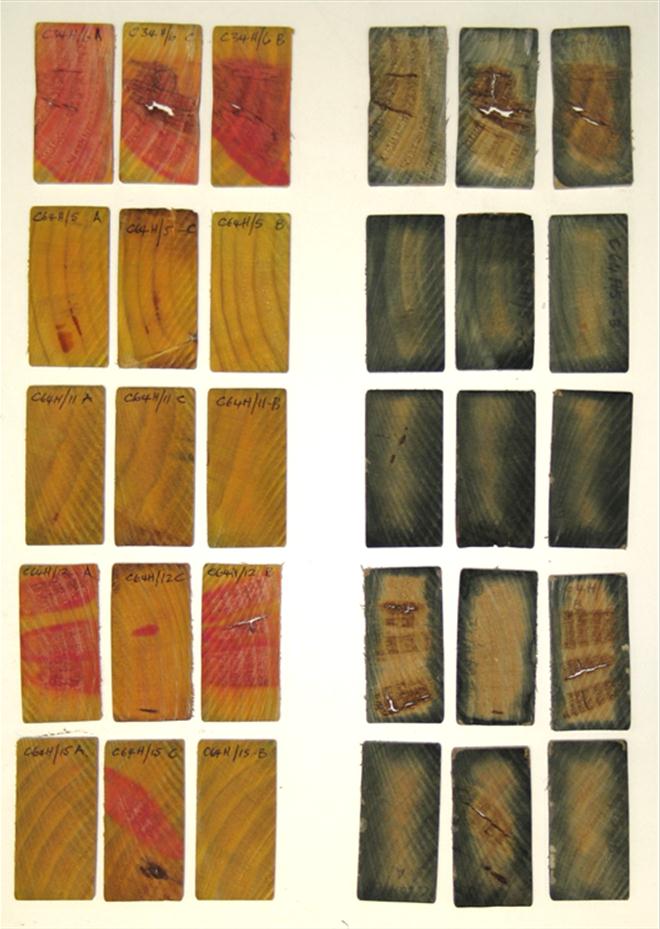 Figure 9
 – Decay and preservative penetration in copper naphthenate treated samples (HMC
samples treated on four sides in Table 6). The samples on the left have been sprayed
with methyl orange reagent which turns a pink-red colour where there is active
decay. The samples on the right are matched with the decay test samples and have
been sprayed with rubeanic acid reagent which turns blue-black in the presence of
copper. The three biscuits in each set are from the same sample, the central “C”
sample from the original decay feeder block position, the “A” and “B” samples 150
mm from each end. There is limited, variable copper penetration and active decay in
three of the samples.
Page16
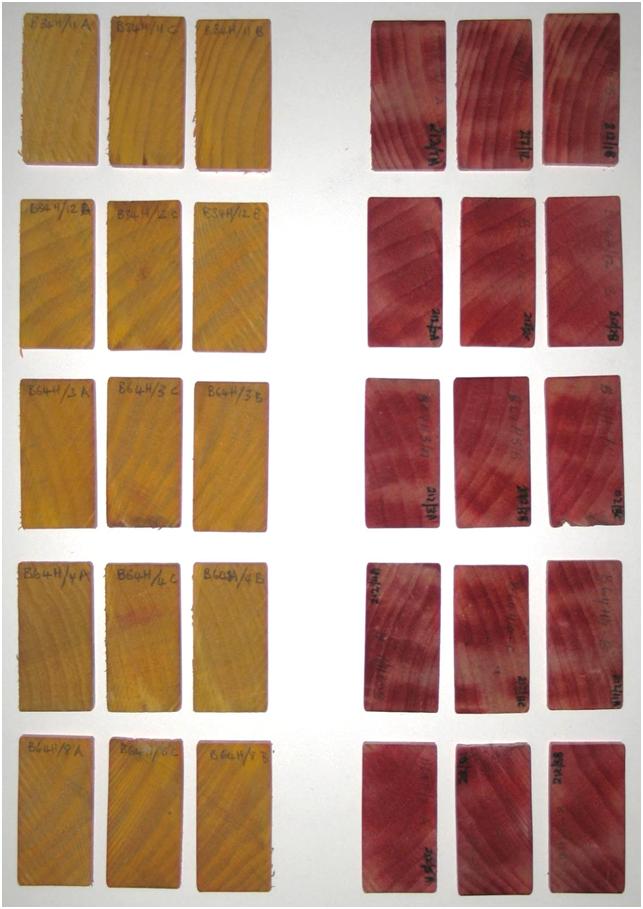 Figure 10
 – Decay and preservative penetration in boron treated samples (HMC samples
treated on four sides in Table 6). The samples on the left have been sprayed with
methyl orange reagent which turns a pink-red colour where there is active decay.
The samples on the right are matched with the decay test samples and have been
sprayed with a tumeric reagent which turns red in the presence of boron. The three
biscuits in each set are from the same sample, the central “C” sample from the
original decay feeder block position, the “A” and “B” samples 150 mm from each
end. The boron appears to have diffused through the sample and there is no active
decay.
Page17
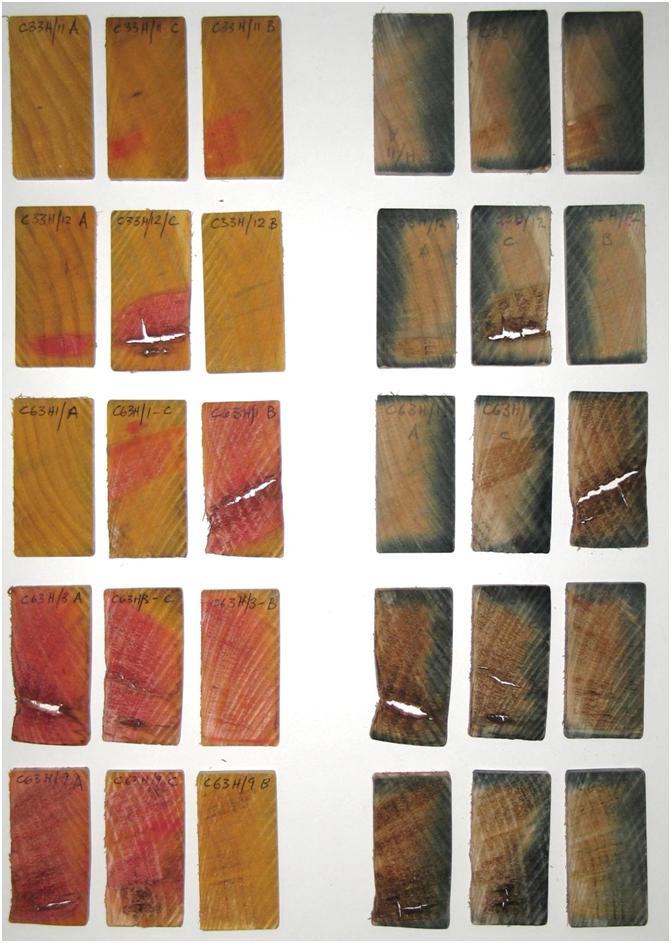 Figure 11
 – Decay and preservative penetration in copper naphthenate treated samples (HMC
tanks treated on one face and two edges). Preservative penetration is limited and all
samples contain some decay extending into the treated areas.
Page18
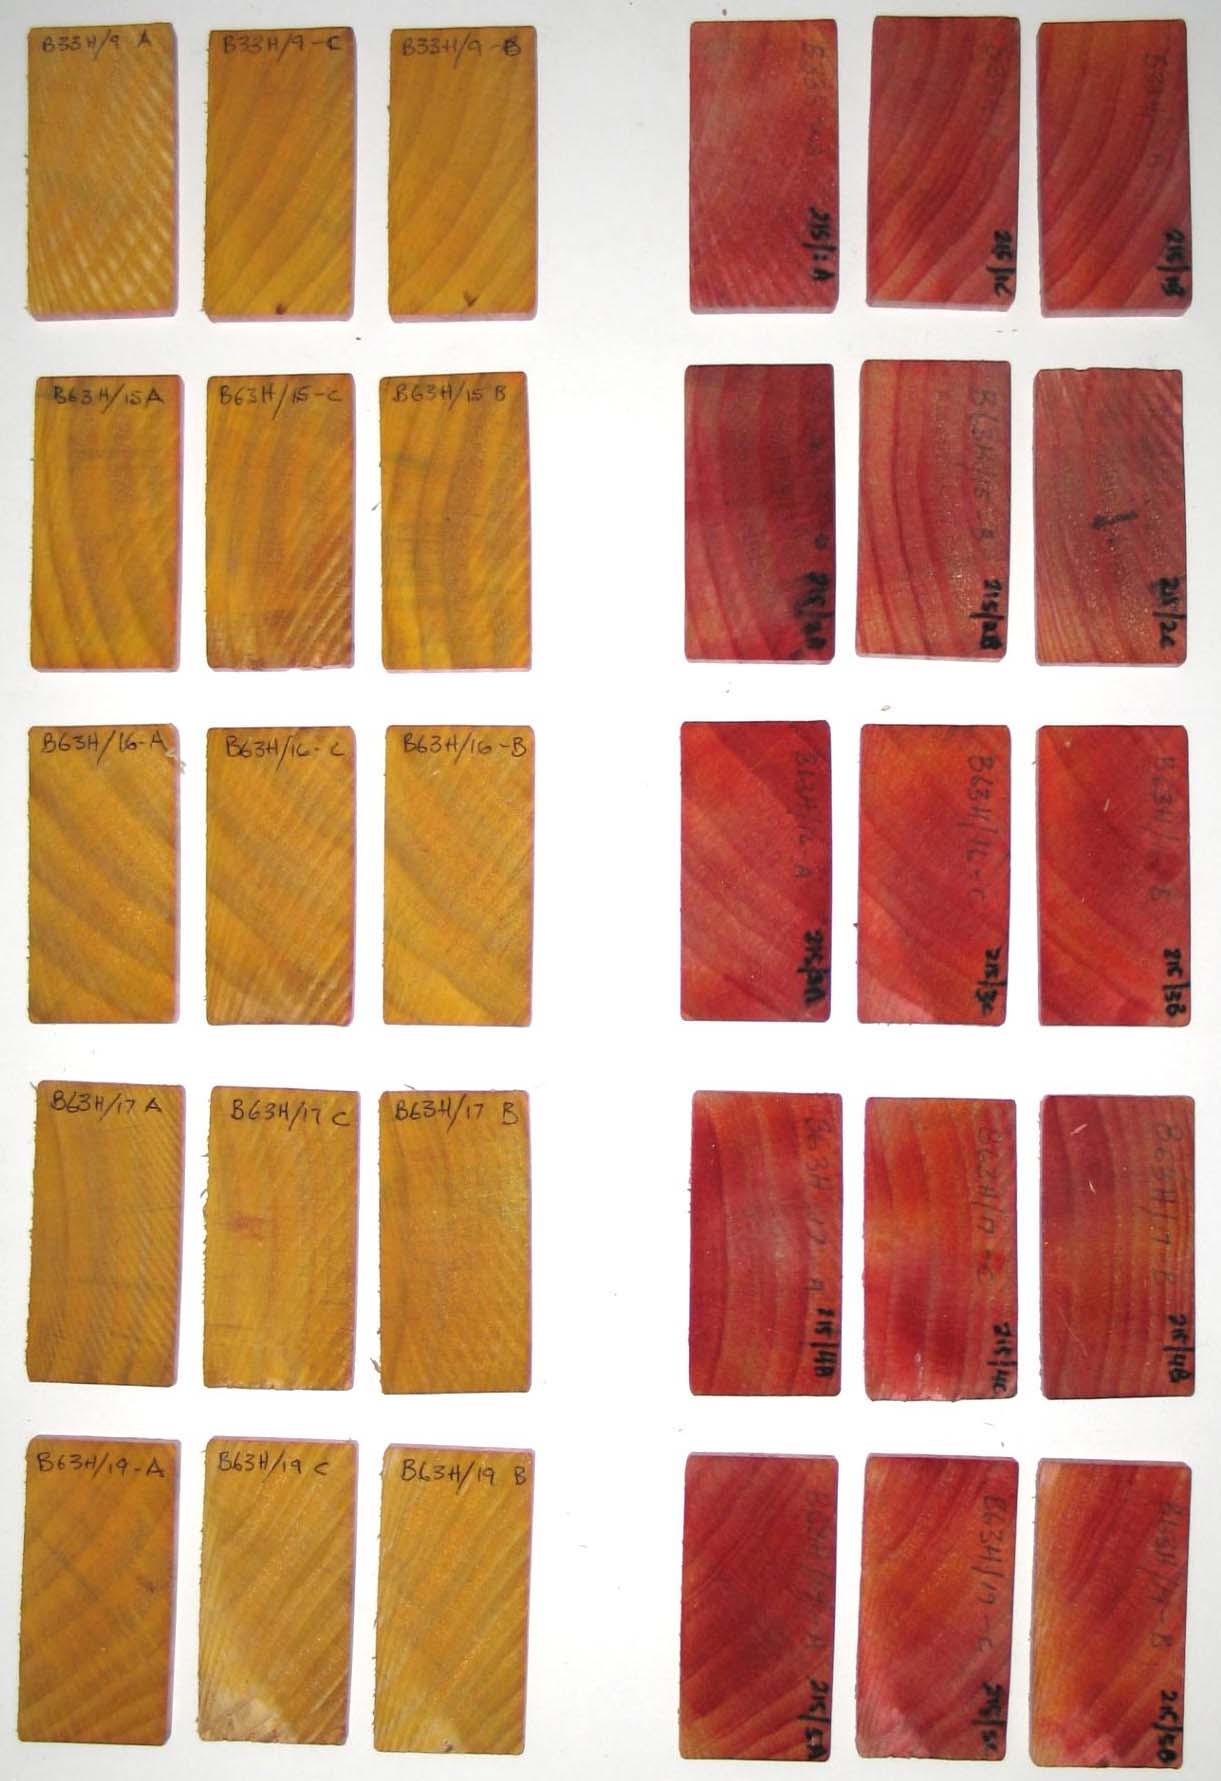 Figure 12
 – Decay and preservative penetration in boron treated samples (HMC tanks treated
on one face and two edges). Boron appears to have diffused right through the
samples and there appears to be no decay except minor areas of inactive brown rot
on the edges of the central biscuit where the decay feeder block was originally
attached.
Page19
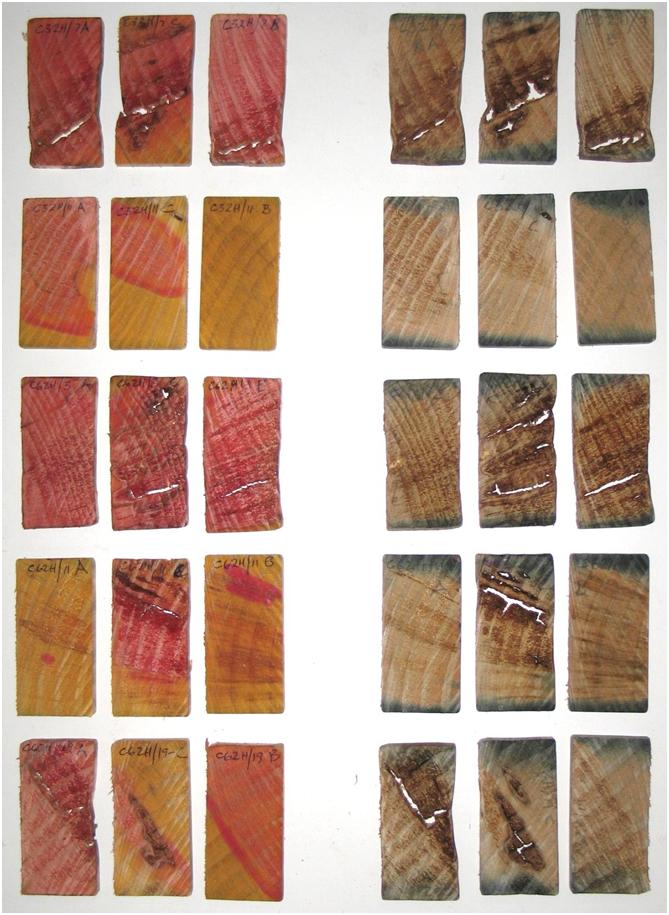 Figure 13
 – Decay and preservative penetration in copper naphthenate treated samples (HMC
tank treated on two edges). All samples contain extensive decay although in the
second from top sample it was mainly at one end. There was limited preservative
penetration and decay was active up to and through the treated area.
Page20
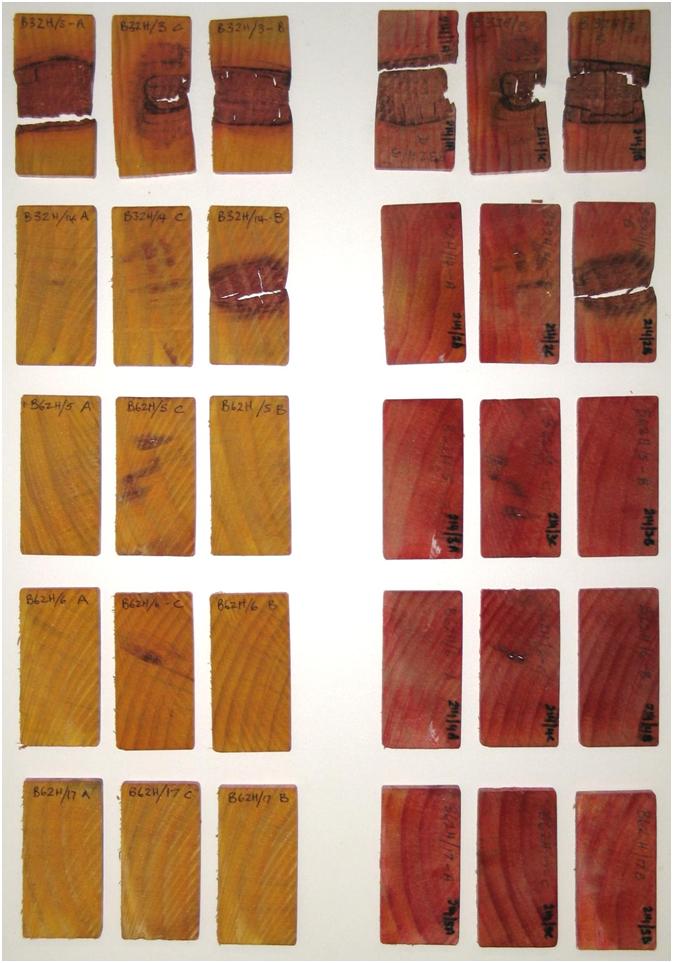 Figure 14
 – Decay and preservative penetration in boron treated samples (HMC tank treated
on two edges). All samples contain some decay although in the three lower
samples it appeared to be from the original feeder block and was inactive. The
reagent test colour suggests that the boron had spread through the sample from the
two edges that it had originally been applied to.
Page21
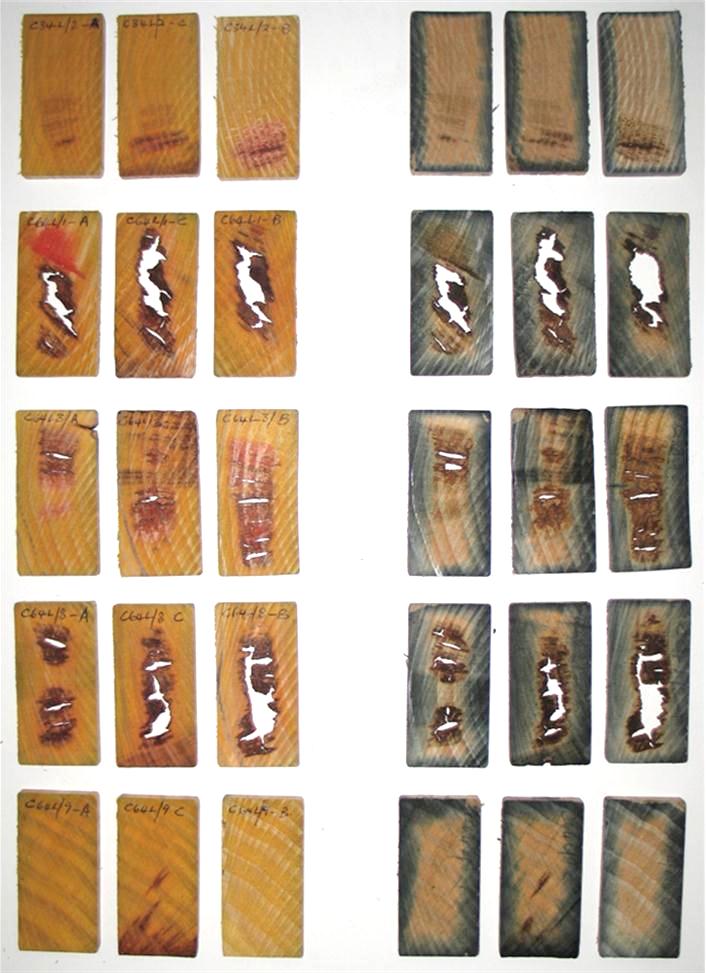 Figure 15
 – Decay and preservative penetration in copper naphthenate treated samples (LMC
samples treated on four sides in Table 4). There is limited copper penetration and
there was active decay through the centre of the top four samples. Decay in the
bottom sample was limited to the central section on one edge and had spread slightly
from the area where the original decay feeder block had been attached.
Page22
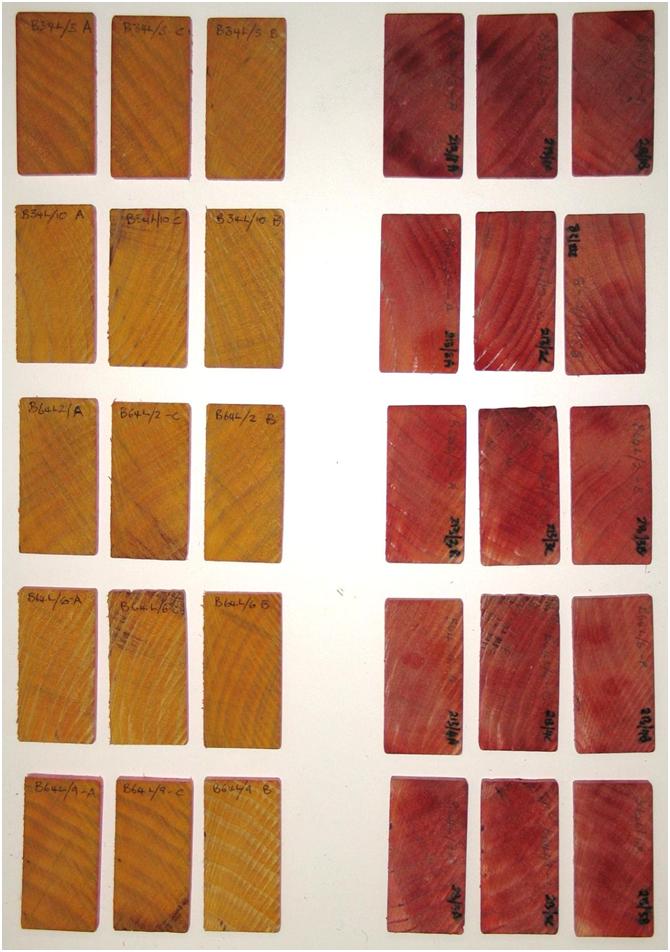 Figure 16
 – Decay and preservative penetration in boron treated samples (LMC samples
treated on four sides in Table 4). The boron appears to have diffused through the
samples and the only decay is inactive, on the edge of the central biscuits where the
original decay feeder block was attached.
Page23
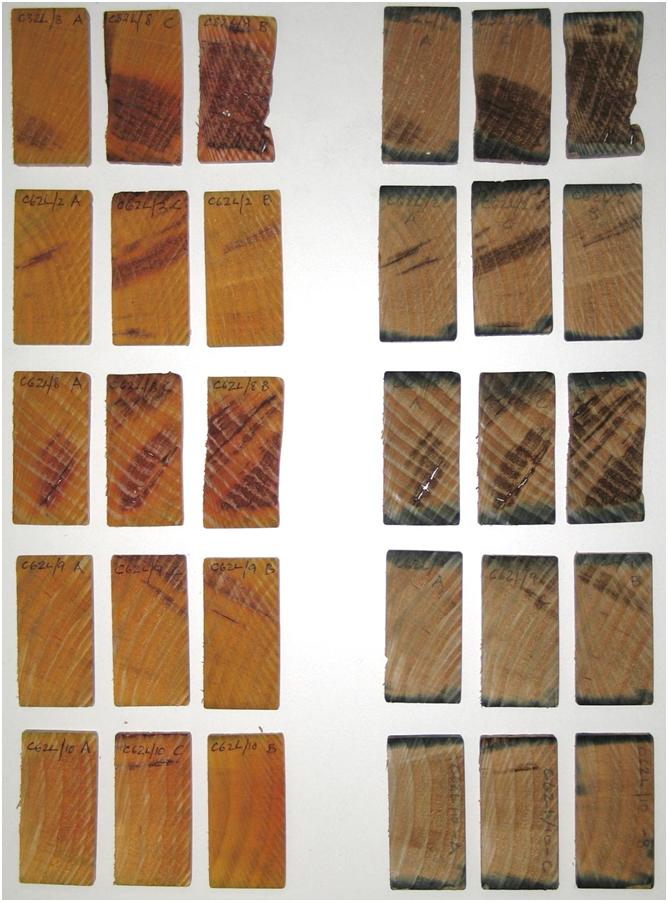 Figure 17
 – Decay and preservative penetration in copper naphthenate treated samples (LMC
stack treated on two edges). All samples contain some decay although the decay in
the bottom two samples was from the original feeder block and appeared inactive.
There was limited preservative penetration and decay was active up to the treated
area.
Page24
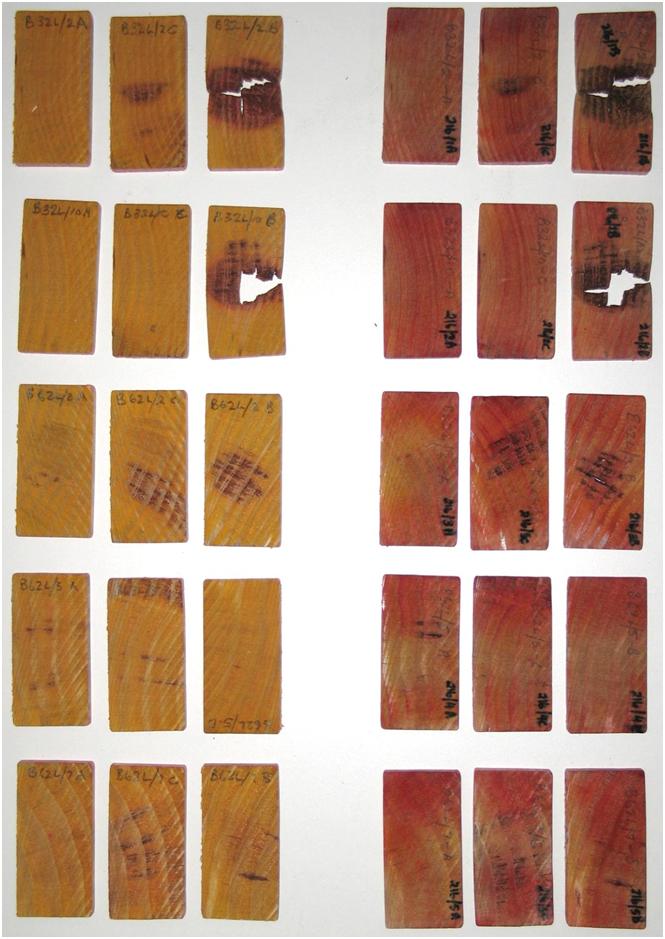 Figure 18
 – Decay and preservative penetration in boron treated samples (LMC stack treated
on two edges). All samples contain some decay although the decay in the upper
edge of the central biscuit of the second to bottom sample was from the original
feeder block and appeared inactive. The reagent test colour suggests that there was
very little boron present although it had spread through the sample from the two
edges that it had originally been applied to.
Page25
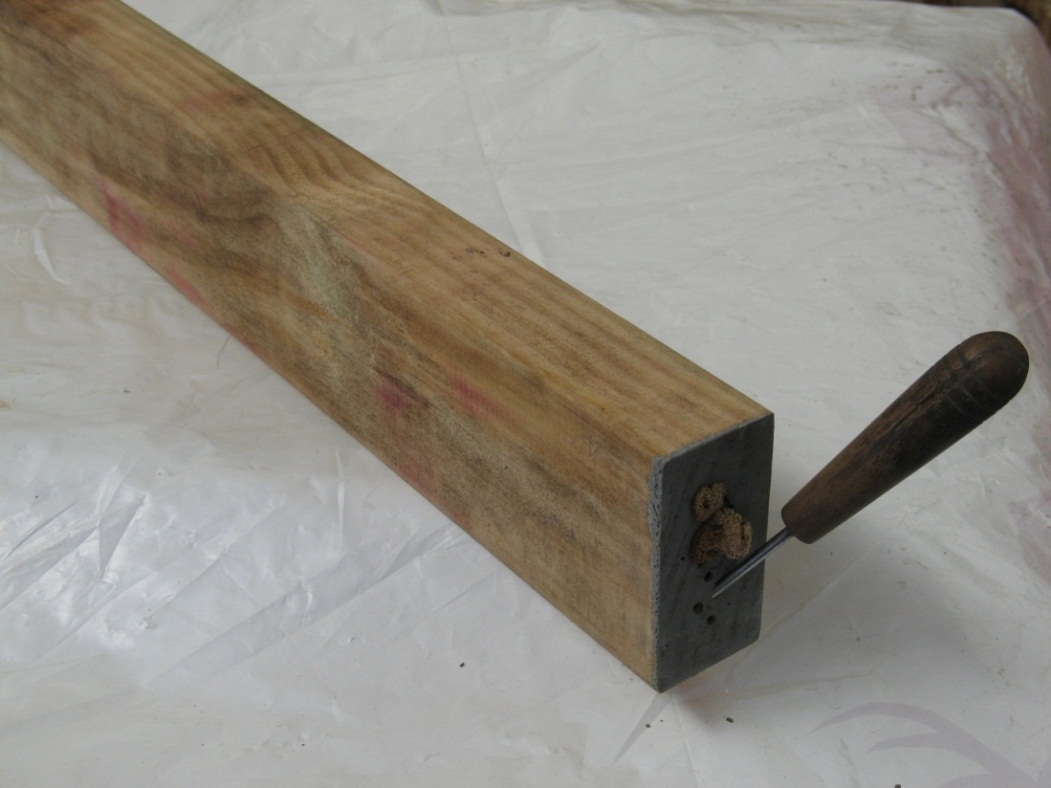
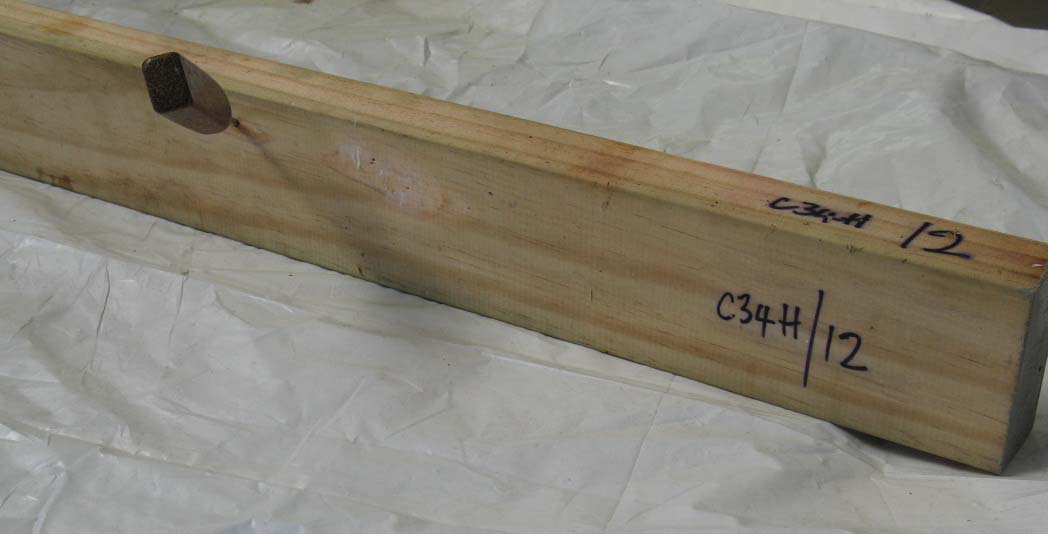
Figure 19 – LMC sample C64L/5 treated with copper naphthenate on four sides after 157
weeks exposure. This was in layer 5 near one side of the stack and would have not
been wet by condensation drips hence its moisture content would have been
between 25% and 30% for the duration of the trial. There were decay fruiting
bodies at one end and decay extending full length of the sample through the centre.
There was no decay on the exterior of the sample except what appeared to be an
inactive area at the point where the original decay feeder block had been attached
before treatment.
Figure 20 – HMC sample C34H/12 treated with copper naphthenate on four sides after 159
weeks exposure. Decay, probably originating from the pre-treatment decay feeder
block has broken through the preservative treated envelope and is beginning to
spread along the sample surface.
Page26
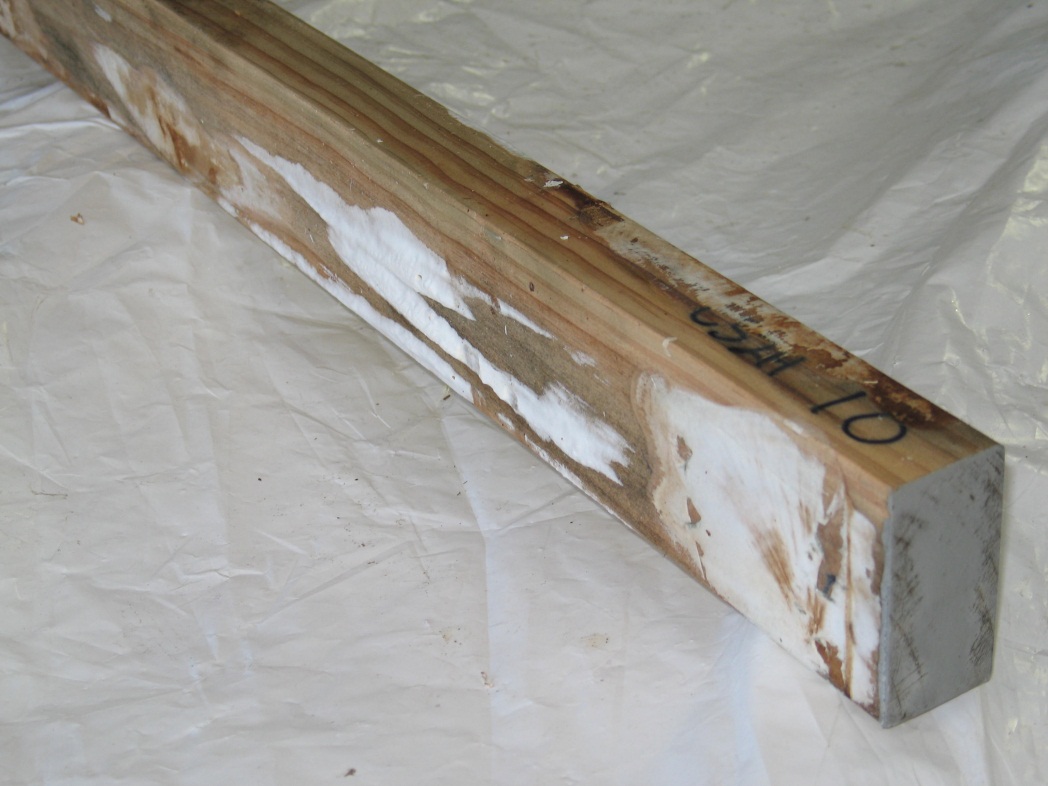
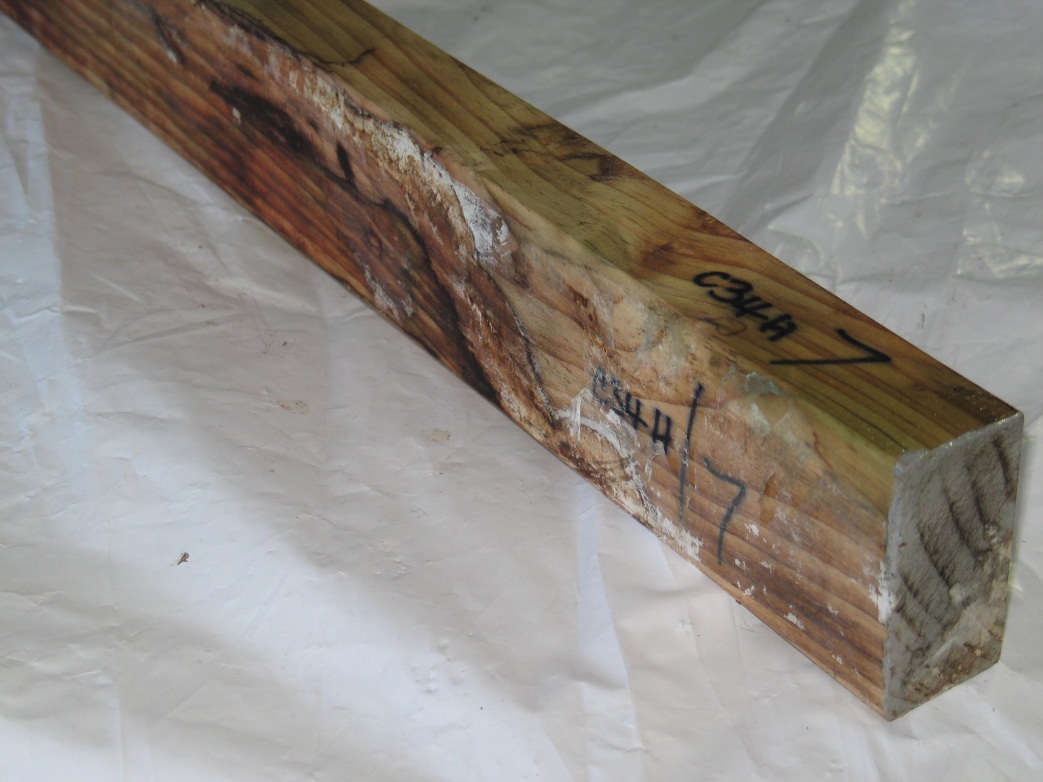 Figure 21
 – HMC sample C32H/10 treated with copper naphthenate on two edges after 159
weeks exposure. Decay has spread along the length of the sample including over
the treated edges. It was severe in patches and the sample rating was 6 (30-50%
of the cross section decayed). MOE had declined by 11% during the exposure
period.
Figure 22 – HMC sample C34H/7 treated with copper naphthenate on four sides after 159
weeks exposure. Decay had spread along the length of the sample and it failed
during deflection testing at the 159-week assessment.
Page27
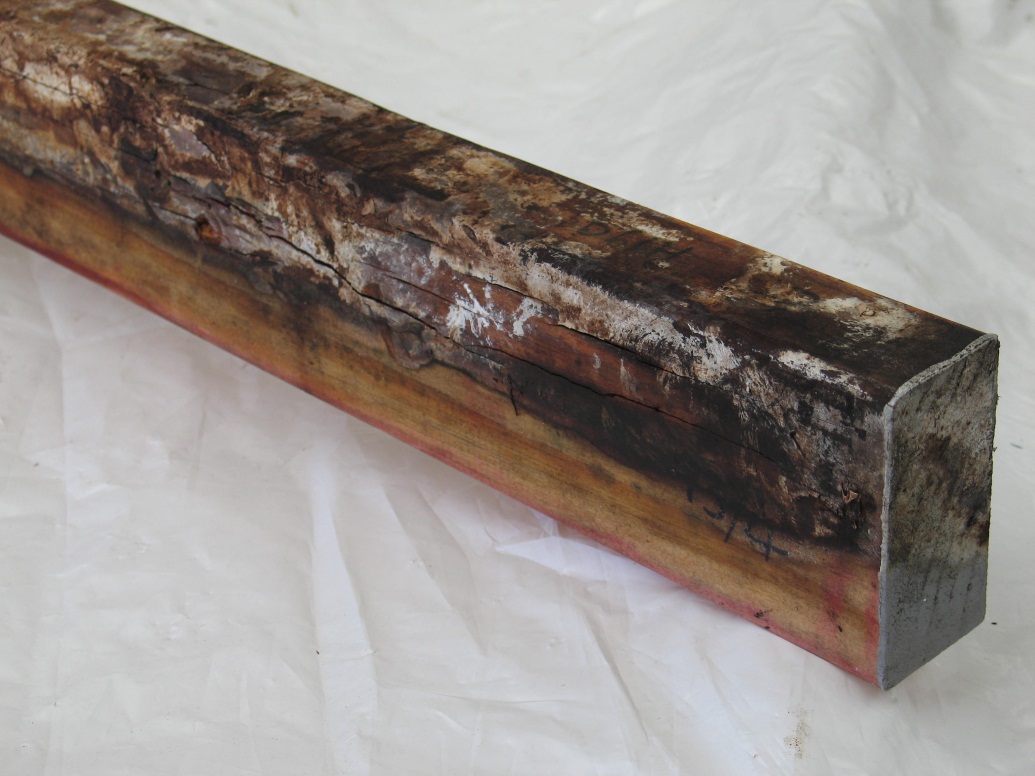
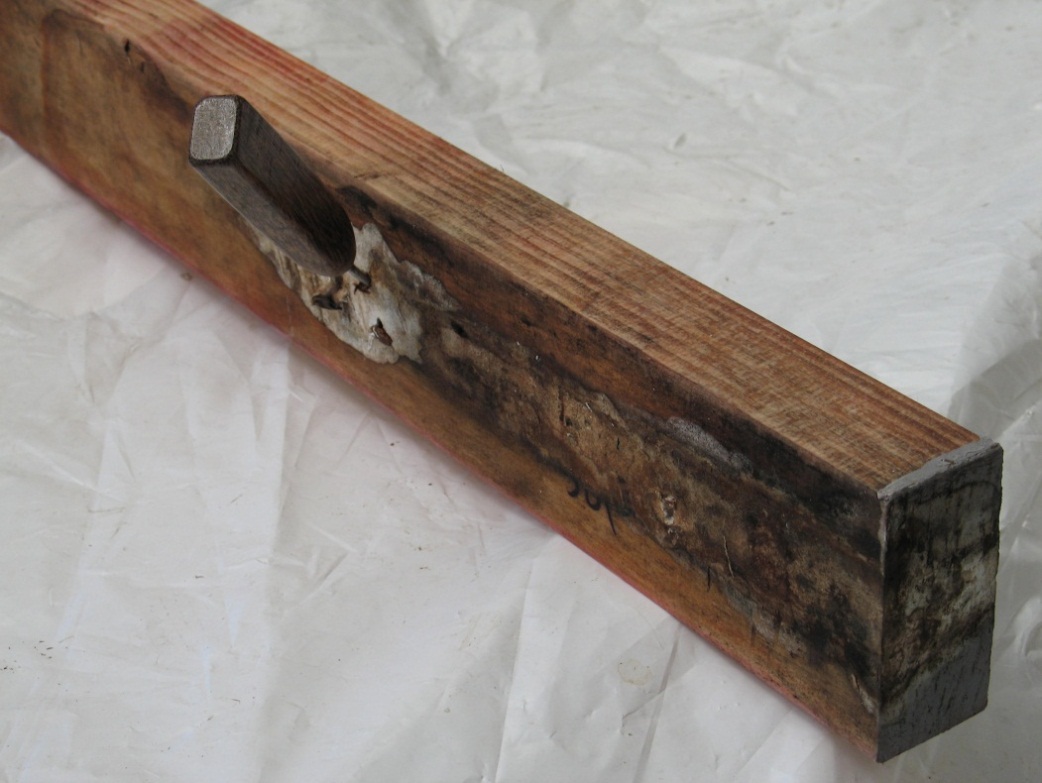 Figure 23
 – HMC sample B61H/12 treated with boron on one edge after 159 weeks
exposure. There was severe decay throughout the sample, away from the treated
edge. This was typical of many of the samples in the group that were treated with
boron on one edge only.
Figure 24 – HMC sample B32H/13 treated with boron on two edges after 159 weeks
exposure. There was a strip of severe decay through the centre of the sample but
this had not spread to the treated edges. This sample was in the top layer of the
tank and it is likely that boron loss would have been greater than for samples
lower in the tank. MOE for this sample had reduced by 23% over the exposure
period due to this decay (rated 6, 30-50% of the cross section).
Page28
APPENDIX I
RATINGS SYTEMS USED FOR SAMPLE ASSESSMENTS
Mycelium Spread Ratings
1 = No mycelium development onto the sample surface.
2 = Mycelium on the surface in the immediate vicinity of the feeder block.
3 = Active mycelium from the feeder block on the surface, spread <50 mm.
4 = Active mycelium development >50 mm from the feeder block.
5 = Extensive mycelium development over <50% of the surface area.
6 = Extensive mycelium development over >50% of the surface area.
Mould Ratings
1 = No perceivable mould.
2 = Light mould patches or a few widely scattered spots.
3 = Numerous spots or widespread light mould.
4 = Severe mould, up to 50% coverage.
5 = Severe mould, >50% coverage.
Decay Ratings
10 = No decay.
T = Trace, discolouration or softening, not positively identified as decay.
9 = First stages of decay or damage up to 3% of cross-section.
8 = Lightly established decay, 3-10% of cross-section.
7 = Well established decay, 10-30% of cross section.
6 = Deep established decay, 30-50% of cross section.
4 = Severe decay, nearing failure, more than 50% of the cross section.
0 = Failed.
Page29
APPENDIX IIa
INDIVIDUAL SAMPLE DETAILS AFTER 159 WEEKS EXPOSURE
Sample
OD Wt
Weight
MC
Ratings
Deflect
MOE
No
Calc
Wet
%
Mycel
Decay
Mould
(mm)
(GPa)
HMC/8-week pre-decay, Copper naphthenate treatment 1 edge
C61H/1 1738 2197 26
6
4
5.0 4.70 4.09
C61H/2 1695 2224 31
6
6
4.5 3.23 5.70
C61H/3 1648 2033 23
6
4
4.5 4.19 4.53
C61H/4 1667
Failed 137 weeks
0 8.00
0.00
C61H/5 1909 2663 39
5
6
4.0 3.10 5.72
C61H/6 1857
Failed 137 weeks
0 8.00
0.00
C62H/7 1778
Failed 84 weeks
0 8.00
0.00
C62H/8 1733 2818 43 6
6
4.5 2.84 6.59
C62H/9 1972 1951 32 5
4
4.5 4.17 4.41
C62H/10 1606 2764 39
6
6
4.5
2.00
9.06
C62H/11 1593 2558 58
6
4
4.5
4.22
4.45
C62H/12 1490 2491 38
6
4
4.0
3.85
4.58
C62H/13 1745 2359 33
5
6
4.5
2.73
6.99
C62H/14 1680 4324 138
1
8
3.5
1.97
8.99
C62H/15 1678 2357 33
6
4
4.0
2.73
6.67
C62H/16 1564 2780 54
4
7
4.0
2.10
8.97
C62H/17 1759 2432 24
5
7
4.5
2.73
7.09
C62H/18 1605 2336 22
6
4
4.5
3.16
5.73
C62H/19 1932 2158 50
5
4
4.0
3.17
6.00
C62H/20 1717 2303 44
6
6
3.5
3.45
5.43
43 5.3 4.5 4.3 3.92 5.25
HMC/8-week pre-decay, Copper naphthenate treatment 2 edges
C62H/1 1817 2379 31
6
6 4.0 2.79 6.38
C62H/2 1637 2198 34
6
4 4.0 4.80 3.95
C62H/3 1907 2459 29
6
4 4.0 3.08 6.16
C62H/4 1466 1869 27
5
4 4.5 5.03 3.80
C62H/5 1958 2590 32
5
6 4.0 2.41 7.59
C62H/6 1566 2136 36
5
6 4.5 2.96 6.26
C62H/7 1778
Failed 84 weeks
0 8.00
0.00
C62H/8 1733 2361 36
6
4 4.0 5.40 3.67
C62H/9 1972 2447 24
6
6 4.5 2.34 7.74
C62H/10 1606 2044 27
6
4
4.0
5.40
3.49
C62H/11 1593 2608 64
4
7
4.5
2.65
7.07
C62H/12 1490
Failed 159 weeks
0 8.00
0.00
C62H/13 1745 2478 42
6
4
4.5
4.05
4.52
C62H/14 1680
Failed 137 weeks
0 8.00
0.00
C62H/15 1678 2024 21
6
4
5.0
4.40
4.13
C62H/16 1564 1943 24
6
4
4.5
5.90
3.24
C62H/17 1759 2299 31
3
7
4.5
2.10
8.80
C62H/18 1605 2144 34
5
4
5.0
3.04
6.01
C62H/19 1932 2649 37
6
6
4.0
2.35
7.97
C62H/20 1717 2275 32
5
6
4.5
2.41
7.72
33 5.4 4.3 4.4 4.26 4.93
Page30
APPENDIX IIa (contd.)
INDIVIDUAL SAMPLE DETAILS AFTER 159 WEEKS EXPOSURE
Sample
OD Wt
Weight
MC
Ratings
Deflect
MOE
No
Calc
Wet
%
Mycel
Decay
Mould
(mm)
(GPa)
HMC/8-week pre-decay, Copper naphthenate treatment 1 face, 2 edges
C63H/1 1715 2546 48
4
7
4.0 1.95 9.52
C63H/2 1713 2782 62
6
6
3.5 3.03 6.31
C63H/3 1675 2366 41
6
7
4.5 2.62 7.32
C63H/4 1685 2556 52
2
8
3.5 2.01 8.83
C63H/5 1607 3147 96
5
8
3.0 3.08 6.16
C63H/6 1782 2625 47
6
4
4.5 2.38 7.35
C63H/7 1709 2556 50
2
8
4.0 2.50 7.42
C63H/8 1781 2791 57
5
6
3.5 2.92 6.24
C63H/9 1827 2480 36
5
6
4.0 2.17 8.54
C63H/10 1854 2709 46
6
4
4.5
4.68
4.00
C63H/11 1892 2834 50
5
8
4.5
1.95
9.44
C63H/12 1513 2317 53
1
8
3.0
2.87
6.84
C63H/13 1721
Failed 137 weeks
0 8.00
0.00
C63H/14 1968 2802 42
5
7
4.0
1.93
9.42
C63H/15 1614 2210 37
5
6
4.0
2.77
6.99
C63H/16 1736 2317 33
5
8
3.5
2.14
8.35
C63H/17 1804 2711 50
5
6
4.0
2.14
8.71
C63H/18 1770 2383 35
1
8
3.5
2.26
8.49
C63H/19 1801 2522 40
4
7
3.0
2.05
9.16
C63H/20 1598
Failed 159 weeks
0 8.00
0.00
49 4.3 6.1 3.8 3.07 6.95
HMC/8-week pre-decay, Copper naphthenate treatment 4 sides
C64H/1 1846 3146 70
3
7 2.5 2.03 9.25
C64H/2 1688 2488 47
1
8 3.0 1.98 9.30
C64H/3 1764 2645 50
1
8 2.5 2.42 7.63
C64H/4 1888 2888 53
4
7 3.0 2.13 8.86
C64H/5 1467 3067 109
1
8 3.0 2.65 7.20
C64H/6 1911 2588 35
1
9 2.0 3.37 5.97
C64H/7 1705 2827 66
1
9 2.5 2.21 8.41
C64H/8 1586 2367 49
4
6 3.0 1.97 9.41
C64H/9 1781 2354 32
1
8 2.0 1.76 10.54
C64H/10 1932 2567 33
3
8
3.0
1.49
12.02
C64H/11 1616 2596 61
1
8
4.0
3.03
6.35
C64H/12 1729 2199 27
3
8
3.0
2.17
8.71
C64H/13 1789 3128 75
1
8
2.5
2.05
9.22
C64H/14 1736 2377 37
1
8
2.0
2.50
7.50
C64H/15 1739 2525 45
4
8
3.0
2.80
6.83
C64H/16 2011 2750 37
6
4
4.0
2.33
7.91
C64H/17 2093 2693 29
4
7
3.5
1.93
9.74
C64H/18 1428 2395 68
1
8
2.5
2.44
7.64
C64H/19 1688 2495 48
5
7
3.0
2.36
7.96
C64H/20 1521 2047 35
1
8
3.0
2.42
7.81
50 2.4 7.6 2.9 2.30 8.41
Page31
APPENDIX IIa (contd.)
INDIVIDUAL SAMPLE DETAILS AFTER 159 WEEKS EXPOSURE
Sample
OD Wt
Weight
MC
Ratings
Deflect
MOE
No
Calc
Wet
%
Mycel
Decay
Mould
(mm)
(GPa)
HMC/8-week pre-decay, Boron treatment 1 edge
B61H/1 2012 2548 27
5
6
5.0 2.92 6.66
B61H/2 1780 2386 34
4
6
4.5 2.12 8.80
B61H/3 2030 2759 36
5
6
4.5 2.65 7.02
B61H/4 1719 2428 41
4
6
4.5 2.20 8.54
B61H/5 1923 2339 22
6
4
4.0 3.48 5.47
B61H/6 1857 3268 76
5
4
4.0 2.71 6.87
B61H/7 1802 2491 38
5
6
4.5 2.87 6.25
B61H/8 1922 2922 52
2
8
4.5 2.19 8.28
B61H/9 1675 2900 73
5
6
4.5 2.48 7.48
B61H/10 1615 2433 51
4
6
4.5
2.80
6.87
B61H/11 1706 2449 44
5
6
4.5
3.97
4.81
B61H/12 1814 2774 53
6
4
4.5
7.65
2.50
B61H/13 1686 2220 32
4
6
4.5
2.52
7.28
B61H/14 1837 2771 51
5
6
4.5
3.50
5.22
B61H/15 1849 2361 28
6
4
4.5
5.50
3.86
B61H/16 1745 2265 30
4
6
4.5
2.73
7.30
B61H/17 1624 2582 59
4
6
4.5
2.65
6.74
B61H/18 1481 2108 42
4
6
5.0
3.23
5.64
B61H/19 1641 2195 34
5
4
4.5
3.67
5.18
B61H/20 1608 2466 53
5
6
4.5
3.23
5.87
44 4.7 5.6 4.5 3.25 6.33
HMC/8-week pre-decay, Boron treatment 2 edges
B62H/1 2012 2667 33
3
8 4.5 1.55 11.58
B62H/2 1891 3127 65
3
8 4.5 2.87 6.59
B62H/3 1595 2817 77
1
8 4.5 2.23 8.40
B62H/4 1550 2539 64
1
9 4.5 3.82 5.13
B62H/5 1523 2285 50
3
7 4.5 2.97 6.39
B62H/6 1686 2657 58
1
8 4.5 2.16 8.48
B62H/7 1678 2379 42
1
9 4.5 1.91 9.30
B62H/8 1718 2553 49
2
9 4.5 1.97 9.42
B62H/9 1729 2446 41
2
9 4.5 3.72 4.97
B62H/10 1493 2224 49
1
8
4.5
3.26
5.87
B62H/11 1769 2335 32
1
8
4.0
1.61
11.51
B62H/12 1583 2578 63
2
8
4.0
3.30
5.88
B62H/13 1891 2909 54
2
8
4.5
1.95
9.18
B62H/14 1676 3102 85
1
9
4.0
2.02
8.91
B62H/15 1633 2251 38
1
9
4.5
2.48
7.32
B62H/16 1722 2578 50
1
9
4.5
1.80
9.76
B62H/17 1717 2743 60
1
8
4.5
1.95
9.39
B62H/18 1823 2572 41
1
8
4.5
1.99
8.88
B62H/19 1593 2400 51
3
8
4.5
3.09
6.36
B62H/20 1739 2627 51
3
7
4.5
2.15
8.81
53 1.7 8.3 4.4 2.44 8.11
Page32
APPENDIX IIa (contd.)
INDIVIDUAL SAMPLE DETAILS AFTER 159 WEEKS EXPOSURE
Sample
OD Wt
Weight
MC
Ratings
Deflect
MOE
No
Calc
Wet
%
Mycel
Decay
Mould
(mm)
(GPa)
HMC/8-week pre-decay, Boron treatment 1 face, 2 edges
B63H/1 1974 3187 61
3
8
3.5 1.77 10.40
B63H/2 1746 2351 35
1
8
4.0 2.75 6.82
B63H/3 1840 2603 41
1
9
3.0 1.66 10.81
B63H/4 1713 2440 42
1
8
3.5 2.00 9.21
B63H/5 1568 2682 71
1
8
3.5 2.92 6.84
B63H/6 1888 2556 35
1
9
3.5 1.80 9.98
B63H/7 1848 2570 39
1
9
3.5 1.98 9.11
B63H/8 1838 3481 89
1
9
3.0 1.83 9.53
B63H/9 1748 2912 67
1
9
3.5 2.88 6.41
B63H/10 1538 2333 52
1
8
3.5
2.12
9.00
B63H/11 1868 2993 60
1
9
3.5
2.05
8.75
B63H/12 1664 2385 43
1
9
4.0
2.03
8.94
B63H/13 1869 2553 37
1
9
3.5
1.83
9.91
B63H/14 1867 2811 51
1
9
3.5
1.96
9.37
B63H/15 1476 2368 60
1
8
4.0
2.67
7.26
B63H/16 1684 2547 51
1
9
3.5
2.39
7.62
B63H/17 1762 2680 52
1
8
4.0
2.30
7.85
B63H/18 1734 2691 55
1
8
3.0
2.52
7.86
B63H/19 1764 2733 55
1
9
4.5
1.81
9.89
B63H/20 1642 2333 42
1
9
3.5
2.78
6.37
52 1.1 8.6 3.6 2.20 8.60
HMC/8-week pre-decay, Boron treatment 4 sides
B64H/1 1668 2483 49
1
9 2.5 2.47 7.64
B64H/2 1816 2518 39
1
T 2.5 2.00 9.20
B64H/3 1642 3003 83
1
8 2.5 2.52 7.41
B64H/4 1594 3197 101
1
9 3.0 1.90 9.63
B64H/5 1811 2865 58
1
9 2.5 2.43 7.40
B64H/6 1587 2175 37
1
8 3.0 2.08 8.98
B64H/7 1772 3885 119
1
8 3.0 2.03 9.10
B64H/8 1574 2426 54
1
8 3.0 2.60 7.40
B64H/9 1690 3168 87
1
8 3.0 2.18 8.43
B64H/10 1692 2419 43
1
8
4.0
2.29
8.26
B64H/11 1835 2558 39
1
8
3.0
1.99
9.24
B64H/12 1621 2843 75
1
9
3.5
2.50
7.30
B64H/13 1464 2086 42
1
8
3.0
2.20
8.67
B64H/14 1758 2456 40
1
9
2.5
2.33
7.93
B64H/15 1839 2965 61
1
8
3.0
2.13
8.91
B64H/16 1795 2783 55
1
9
3.5
2.37
7.98
B64H/17 1483 2325 57
1
8
3.0
2.68
7.20
B64H/18 1711 2537 48
1
9
3.0
2.03
9.29
B64H/19 1761 2502 42
1
8
3.0
1.75
10.59
B64H/20 1779 2456 38
1
9
3.5
2.48
7.64
58 1.0 8.5 3.0 2.25 8.41
Page33
APPENDIX IIa (contd.)
INDIVIDUAL SAMPLE DETAILS AFTER 159 WEEKS EXPOSURE
Sample
OD Wt
Weight
MC
Ratings
Deflect
MOE
No
Calc
Wet
%
Mycel
Decay
Mould
(mm)
(GPa)
HMC/4-week pre-decay, Copper naphthenate treatment 1 edge
C31H/1 1624
Failed 159 weeks
0 8.00
0.00
C31H/2 1707 2200 29
6
4
5.0 3.22 5.82
C31H/3 1670 2250 35
4
7
4.5 3.32 5.54
C31H/4 1621
Failed 137 weeks
0 8.00
0.00
C31H/5 1862 2333 25
6
6
4.5 7.60 2.57
C31H/6 1941 3482 79
5
7
4.5 2.82 6.51
C31H/7 1997 3088 55
6
6
4.0 3.19 5.89
C31H/8 2008 2559 27
2
9
4.0 2.09 8.94
C31H/9 1761 2532 44
5
6
4.0 3.64 5.04
C31H/10 2043 2760 35
6
7
3.5
2.02
9.04
C31H/11 1595 2869 80
3
7
4.0
2.39
7.59
C31H/12 1811 2264 25
6
4
4.5
3.32
5.55
C31H/13 1769 3531 100
5
4
4.0
2.98
5.96
C31H/14 1724 2285 33
6
6
3.5
2.67
7.06
C31H/15 1490 1950 31
5
6
4.5
4.42
4.18
C31H/16 1768
Failed 137 weeks
0 8.00
0.00
C31H/17 1691 2249 33
6
4
4.5
2.96
6.43
C31H/18 1764 2200 25
5
6
4.0
2.55
7.32
C31H/19 1710 2188 28
6
4
5.0
4.92
3.82
C31H/20 1456
Failed 137 weeks
0 8.00
0.00
43 5.1 4.7 4.3 4.31 4.86
HMC/4-week pre-decay, Copper naphthenate treatment 2 edges
C32H/1 1553
Failed 48 weeks
0 8.00
0.00
C32H/2 1658
Failed 159 weeks
0 8.00
0.00
C32H/3 1665
Failed 137 weeks
0 8.00
0.00
C32H/4 1923
Failed 159 weeks
0 8.00
0.00
C32H/5 1697 2177 28
5
7 4.5 2.79 6.59
C32H/6 1664
Failed 159 weeks
0 8.00
0.00
C32H/7 1697 2005 18
6
6 4.5 4.35 4.20
C32H/8 1995 2615 31
5
4 4.5 3.54 5.24
C32H/9 1817
Failed 159 weeks
0 8.00
0.00
C32H/10 1901 2554 34
6
6
3.5
2.16
8.99
C32H/11 1795 2463 37
5
7
3.5
2.05
9.00
C32H/12 1678 1994 19
6
4
4.0
4.20
4.55
C32H/13 1987
Failed 159 weeks
0 8.00
0.00
C32H/14 1789 2233 25
6
6
4.5
3.50
5.09
C32H/15 1796 2195 22
6
6
4.0
2.67
6.77
C32H/16 1888 2873 52
6
6
4.5
3.62
5.17
C32H/17 1429 1858 30
6
4
4.5
7.00
2.67
C32H/18 1622
Failed 159 weeks
0 8.00
0.00
C32H/19 1983 2561 29
4
7
3.5
2.00
9.25
C32H/20 1916 2837 48
5
6
4.0
2.16
8.73
31 5.5 3.5 4.1 5.20 3.81
Page34
APPENDIX IIa (contd.)
INDIVIDUAL SAMPLE DETAILS AFTER 159 WEEKS EXPOSURE
Sample
OD Wt
Weight
MC
Ratings
Deflect
MOE
No
Calc
Wet
%
Mycel
Decay
Mould
(mm)
(GPa)
HMC/4-week pre-decay, Copper naphthenate treatment 1 face, 2 edges
C33H/1 1819 2314 27
6
6
5
4.36 4.28
C33H/2 1673 2332 39
6
4
3.5 5.18 3.59
C33H/3 1755 2256 29
4
7
4.0 3.01 6.16
C33H/4 1946 2965 52
6
6
3.0 2.39 7.96
C33H/5 2014 3239 61
5
6
3.0 2.30 7.85
C33H/6 1799 2513 40
4
7
4.5 2.73 6.99
C33H/7 1842 3991 117 1
9
3.5 2.11 8.61
C33H/8 1636 2257 38
5
6
4.5 2.72 7.09
C33H/9 1866 2238 20
6
7
3.5 3.35 5.76
C33H/10 2091 2776 33
4
8
4.5
1.73
10.14
C33H/11 1598 3108 94
1
9
2.5
2.46
7.34
C33H/12 1608 2542 58
3
7
3.0
2.62
7.41
C33H/13 1547 2493 61
5
7
3.5
4.42
4.41
C33H/14 1623 2780 71
5
7
4.0
3.02
6.16
C33H/15 1717 3026 76
5
6
3.5
2.75
6.70
C33H/16 1539 2220 44
4
6
3.5
3.74
5.21
C33H/17 1634 2400 47
4
8
4.0
2.37
7.80
C33H/18 1748 2313 32
5
6
4.5
3.46
5.34
C33H/19 1509 2270 50
6
4
4.0
4.40
4.40
C33H/20 1761 2378 35
6
4
4.0
3.02
6.03
51 4.6 6.5 3.8 3.11 6.46
HMC/4-week pre-decay, Copper naphthenate treatment 4 sides
C34H/1 1756 2356 34
6
6 4.5 2.58 7.14
C34H/2 1576 2143 36
1
9 2.5 3.18 5.74
C34H/3 1577
Failed 137weeks
0 8.00
0.00
C34H/4 1737 2430 40
3
8 3.0 2.23 8.30
C34H/5 1830 2492 36
5
7 3.5 2.39 7.64
C34H/6 1997 2690 35
5
8 3.0 2.70 6.89
C34H/7 1633
Failed 159 weeks
0 8.00
0.00
C34H/8 1684 2289 36
4
7 2.5 3.39 5.42
C34H/9 1722 2762 60
5
4 3.0 2.41 7.60
C34H/10 1608 2390 49
5
7
3.0
3.10
6.18
C34H/11 1802 2356 31
1
10
2.0
1.96
9.72
C34H/12 1557 2058 32
4
8
2.5
3.18
6.19
C34H/13 1873 2433 30
6
8
3.5
2.35
7.71
C34H/14 1489 2202 48
1
9
3.0
2.34
8.16
C34H/15 1783 2684 51
4
8
3.0
2.85
6.45
C34H/16 1806 2637 46
6
6
3.5
2.46
7.52
C34H/17 1869 2424 30
5
6
3.0
2.89
6.41
C34H/18 1737 2775 60
6
4
3.0
2.55
7.20
C34H/19 1899 2768 46
1
9
2.0
1.71
10.54
C34H/20 1540 3076 100
1
9
2.5
2.82
6.96
44 3.8 6.7 2.9 3.15 6.59
Page35
APPENDIX IIa (contd.)
INDIVIDUAL SAMPLE DETAILS AFTER 159 WEEKS EXPOSURE
Sample
OD Wt
Weight
MC
Ratings
Deflect
MOE
No
Calc
Wet
%
Mycel
Decay
Mould
(mm)
(GPa)
HMC/4-week pre-decay, Boron treatment 1 edge
B31H/1 1782
Failed 159 weeks
0 8.00
0.00
B31H/2 1836 2640 44
4
6
5.0 5.55 3.27
B31H/3 2053 2858 39
5
6
4.0 2.67 6.92
B31H/4 1733 2459 42
4
6
4.5 3.25 6.07
B31H/5 1624 2402 48
5
4
4.5 4.22 4.76
B31H/6 1607 2203 37
6
4
4.5 5.40 3.78
B31H/7 1556
Failed 137 weeks
0 8.00
0.00
B31H/8 1569 2060 31
5
4
4.5 4.97 3.95
B31H/9 1592 2717 71
5
7
3.5 3.02 6.34
B31H10 1922 2565 33
4
6
4.5
2.32
7.81
B31H/11 1676 2874 71
5
4
4.5
4.02
4.67
B31H/12 1694 2812 66
6
4
4.5
6.05
3.16
B31H/13 1742 2354 35
6
4
5.0
3.64
5.10
B31H/14 1664 2233 34
5
4
4.5
4.03
4.69
B31H/15 1735 2305 33
5
6
4.5
2.56
7.23
B31H/16 1585 2425 53
5
4
4.0
4.65
4.16
B31H/17 1647 2394 45
6
4
4.5
5.05
3.84
B31H/18 1835 2620 43
4
7
4.5
2.10
8.85
B31H/19 1697 2092 23
6
4
4.0
3.55
5.08
B31H/20 1789 2344 31
4
7
4.5
2.05
9.17
43 5.0 4.6 4.4 4.26 4.94
HMC/4-week pre-decay, Boron treatment 2 edges
B32H/1 1735 3438 98
1
T 4.5 3.50 5.32
B32H/2 1761 2406 37
1
9 4.5 1.97 9.17
B32H/3 1766 2394 36
1
T 4.5 1.82 9.86
B32H/4 1662 2468 48
1
8 4.5 2.27 8.24
B32H/5 1963 3390 73
1
9 4.5 2.09 8.46
B32H/6 1760 2281 30
1
T 4.0 2.12 8.55
B32H/7 1782 2423 36
4
T 4.0 2.14 8.59
B32H/8 1742 2693 55
2
9 4.5 2.41 7.72
B32H/9 1816 2645 46
1
9 4.5 1.96 9.21
B32H/10 1630 2789 71
1
T
3.5
2.60
7.28
B32H/11 1721 2248 31
3
7
4.5
1.95
9.67
B32H/12 1997 2791 40
1
9
4.0
1.79
10.11
B32H/13 1869 3394 82
5
6
4.5
2.13
8.70
B32H/14 1878 2548 36
4
7
4.5
2.13
8.87
B32H/15 1629 3144 93
1
9
4.0
2.43
7.46
B32H/16 1457 2061 41
1
9
4.5
3.29
5.73
B32H/17 1743 2718 56
1
T
4.5
3.09
6.10
B32H/18 1789 2411 35
1
9
4.5
2.15
8.66
B32H/19 1806 2837 57
1
9
4.5
2.43
7.78
B32H/20 1495 2143 43
4
8
4.5
3.08
6.09
52 1.8 8.9 4.4 2.37 8.08
Page36
APPENDIX IIa (contd.)
INDIVIDUAL SAMPLE DETAILS AFTER 159 WEEKS EXPOSURE
Sample
OD Wt
Weight
MC
Ratings
Deflect
MOE
No
Calc
Wet
%
Mycel
Decay
Mould
(mm)
(GPa)
HMC/4-week pre-decay, Boron treatment 1 face, 2 edges
B33H/1 1599 2702 69
1
T
3.5 2.58 7.03
B33H/2 1843 2459 33
1
T
3.5 1.66 11.04
B33H/3 1561 2131 37
1
10
3.0 3.67 4.94
B33H/4 1813 2529 39
1
T
4.0 2.05 9.02
B33H/5 1845 2560 39
1
10
3.5 3.24 5.77
B33H/6 1781 2753 55
1
9
3.5 2.55 7.54
B33H/7 1695 2351 39
1
T
4.0 2.01 9.14
B33H/8 1816 2682 48
1
10
3.5 2.63 6.98
B33H/9 1793 2531 41
1
T
3.5 1.86 10.07
B33H/10 1615 2536 57
1
T
3.5
2.3
7.93
B33H/11 1644 2181 33
1
T
3.0
2.85
6.66
B33H/12 1861 2794 50
1
T
4.0
2.03
9.21
B33H/13 1703 2399 41
1
9
3.5
2.03
9.04
B33H/14 1837 2594 41
1
T
4.0
1.60
11.24
B33H/15 1964 3481 77
1
9
3.5
2.02
8.97
B33H/16 1630 2588 59
1
9
3.5
2.85
6.66
B33H/17 1809 3357 86
1
T
4.0
2.17
8.48
B33H/18 1744 2442 40
1
T
3.5
1.78
10.25
B33H/19 1685 2433 44
1
T
4.0
2.24
8.31
B33H/20 1546 2271 47
1
T
3.5
3.02
6.39
49 1.0 9.8 3.6 2.36 8.23
HMC/4-week pre-decay, Boron treatment 4 sides
B34H/1 1623 2512 55
1
T 2.5 2.88 6.37
B34H/2 1871 3380 81
1
T 3.5 1.73 10.45
B34H/3 1469 2404 64
1
9 2.5 2.32 8.23
B34H/4 1936 2697 39
1
T 3.0 3.10 6.04
B34H/5 1809 2670 48
1
T 3.0 2.27 8.35
B34H/6 1471 2147 46
1
9 2.0 2.88 6.77
B34H/7 1791 2935 64
1
9 3.0 1.68 10.85
B34H/8 1793 2528 41
4
T 3.0 2.18 8.27
B34H/9 1816 2485 37
1
T 3.0 1.90 9.88
B34H/10 1758 2923 66
1
9
2.0
1.75
10.39
B34H/11 1822 2707 49
1
9
3.5
1.80
10.16
B34H/12 1666 2394 44
1
9
2.5
2.25
8.44
B34H/13 1671 2893 73
1
9
2.5
1.93
9.71
B34H/14 1492 2132 43
1
9
2.5
2.93
6.54
B34H/15 1868 4252 128
1
9
3.0
1.85
9.82
B34H/16 1804 2701 50
1
T
2.5
2.05
8.81
B34H/17 2125 3258 53
1
9
3.0
1.80
10.20
B34H/18 1621 2291 41
1
9
3.0
2.14
9.01
B34H/19 1635 2566 57
4
9
2.0
2.70
6.96
B34H/20 1737 2708 56
1
T
3.0
2.62
7.65
57 1.3 9.4 2.8 2.24 8.64
Page37
APPENDIX IIa (contd.)
INDIVIDUAL SAMPLE DETAILS AFTER 159 WEEKS EXPOSURE
Sample
OD Wt
Weight
MC
Ratings
Deflect
MOE
No
Calc
Wet
%
Mycel
Decay
Mould
(mm)
(GPa)
HMC/4-week pre-decay, Boron H1.2 Commercial treatment
B3H/1 1481
2694 82 1
10 2.0 3.26 5.72
B3H/2 1507
2488 65 1
10 2.5 4.98 3.72
B3H/3 1263
2684
113 1
10 2.0 5.45 3.63
B3H/4 1356
2622 93 1
10 4.0 3.48 5.60
B3H/5 1344
2387 78 1
10 2.0 3.33 5.68
B3H/6 1511
2805 86 1
10 2.5 4.05 4.63
B3H/7 1504
2614 74 1
10 3.0 4.03 4.72
B3H/8 1554
2885 86 1
10 2.5 3.65 5.25
B3H/9 1514
3102
105 1
10 2.5 3.86 4.80
B3H/10 1533 2263 48
1
10
2.0 5.27 3.44
B3H/11 1537 2573 67
1
10
2.5 4.07 4.55
B3H/12 1404 1881 34
1
10
2.5 3.40 5.65
B3H/13 1546 2296 49
1
10
2.0 6.14 3.14
B3H/14 1468 3506 139 1
10
2.5 2.97 6.54
B3H/15 1617 2285 41
1
10
2.0 3.18 6.06
B3H/16 1404 2542 81
1
10
2.5 2.96 6.32
B3H/17 1493 2928 96
1
10
3.5 3.08 6.30
B3H/18 1262 2645 110 1
10
2.5 4.30 4.56
B3H/19 1411 2476 75
1
10
4.0 3.36 5.75
B3H/20 1351 2639 95
1
10
3.0 3.74 5.27
81 1.0 10.0 2.6 3.93 5.07
HMC/4-week pre-decay, Untreated controls
U3H/1 1775
Failed 137 weeks
0 8.00
0.00
U3H/2 2026
Failed 137 weeks
0 8.00
0.00
U3H/3 1579
1966 25 5
6 4.5 3.60 5.25
U3H/4 1875
Failed 159 weeks
0 8.00
0.00
U3H/5 1545
Failed 108 weeks
0 8.00
0.00
U3H/6 1695
2255 33 4
7 4.5 3.40 5.54
U3H/7 1821
2542 40 4
8 4.5 2.28 8.42
U3H/8 1650
Failed 137 weeks
0 8.00
0.00
U3H/9 1662
Failed 108 weeks
0 8.00
0.00
U3H/10 1985
Failed 84 weeks
0 8.00
0.00
U3H/11 1774 2453 38
5
6 4.5 6.56 2.92
U3H/12 1830 2715 48
6
4 4.5 4.75 3.96
U3H/13 1813
Failed 108 weeks
0 8.00
0.00
U3H/14 1727 2110 22
5
6 4.5 2.11 8.95
U3H/15 1624 2030 25
5
7 4.5 3.13 5.77
U3H/16 2038
Failed 137 weeks
0 8.00
0.00
U3H/17 1907 2316 21
6
4 4.5 2.97 6.37
U3H/18 1472 1867 27
6
4 3.5 4.98 3.83
U3H/19 1600
Failed 137 weeks
0 8.00
0.00
U3H/20 1490 1946 31
6
4 4.5 3.63 4.95
31 5.2 2.9 4.4 5.76 2.95
Page38
APPENDIX IIa (contd.)
INDIVIDUAL SAMPLE DETAILS AFTER 159 WEEKS EXPOSURE
Sample
OD Wt
Weight
MC
Ratings
Deflect
MOE
No
Calc
Wet
%
Mycel
Decay
Mould
(mm)
(GPa)
HMC/not pre-decayed, Untreated controls
UMH/1 1738 2566 48 1
10 4.5 2.82 6.76
UMH/2 1806 2635 46 1
10 5.0 1.84 9.96
UMH/3 1906 2546 34 4
7
4.5 2.10 8.52
UMH/4 1653 2800 69 2
9
5.0 2.24 8.03
UMH/5 1660 2412 45 5
7
3.5 2.98 6.41
UMH/6 1724 2404 39 3
8
5.0 3.32 5.70
UMH/7 1940 2376 22 6
7
5.0 2.55 7.35
UMH/8 1635 3305 102 4
8
5.0 3.39 5.63
UMH/9 1932 2785 44 3
9
5.0 2.03 8.87
UMH/10 1887 2686 42
2
9
4.0
1.78 10.48
UMH/11 1558 2512 61
2
9
4.5
3.13
6.38
UMH/12 1581
Failed 159 weeks
0 8.00
0.00
UMH/13 1683 2582 53
1
10
5.0
3.03
6.26
UMH/14 1849 2392 29
4
8
4.5
1.90
9.58
UMH/15 1594 2515 58
3
8
4.5
2.65
7.04
UMH/16 2019 2936 45
3
9
4.5
1.86
9.82
UMH/17 1752 2438 39
3
8
5.0
2.59
7.33
UMH/18 1889 3353 78
5
7
4.0
2.08
8.87
UMH/19 1963
Failed 137 weeks
0 8.00
0.00
UMH/20 1936 2713 40
1
10
4.0
1.98
9.22
50 2.9 7.7 4.6 3.01 7.11
Page39
APPENDIX IIb
INDIVIDUAL SAMPLE DETAILS AFTER 157 WEEKS EXPOSURE
Sample
OD Wt
Weight
MC
Ratings
Deflect
MOE
No
Calc
Wet
%
Mycel
Decay
Mould
(mm)
(GPa)
LMC/12-week pre-decay, Copper naphthenate treatment 2 edges
C62L/1 1741 2002 15 5
6
4.5 2.49 7.60
C62L/2 1568 1908 22 3
7
4.5 2.62 7.32
C62L/3 1865 2264 21 3
7
4.5 1.81 10.63
C62L/4 1693
Failed 135 weeks
0 8.00
0.00
C62L/5 1845 2067 12 5
6
4.5 3.63 5.29
C62L/6 1601
Failed 40 weeks
0 8.00
0.00
C62L/7 1552
Failed 84 weeks
0 8.00
0.00
C62L/8 1760 2067 17 4
6
4.0 2.10 9.13
C62L/9 1691 2101 24 3
8
4.5 2.54 7.79
C62L/10 1419 1957 38
1
8
4.0
2.87
6.92
21 3.4 4.7 4.4 4.21 5.47
LMC/12-week pre-decay, Copper naphthenate treatment 4 sides
C64L/1 1645 2192 33 3
8
3.5 3.08 5.82
C64L/2 1861 2309 24 1
8
4.0 1.84 10.48
C64L/3 1740 2089 20 3
8
4.5 1.94 9.71
C64L/4 1898 2180 15 3
7
4.0 1.58 12.06
C64L/5 1937 2152 11 1
7
4.5 2.03 9.35
C64L/6 1728 1858 8
1
8
4.5 2.41 7.90
C64L/7 1622 1916 18 3
8
4.0 4.84 3.92
C64L/8 1689 1938 15 1
7
4
3.26 6.02
C64L/9 1692 2124 26 1
8
3.5 1.87 10.30
C64L/10 1699 2038 20
1
8
4.5
2.96
6.55
19 1.8 7.7 4.1 2.58 8.21
LMC/12-week pre-decay, Boron treatment 2 edges
B62L/1 1640 2041 24
1
8 3.5 1.88 10.28
B62L/2 1975 2443 24
3
8 4.0 1.64 11.34
B62L/3 1892 2246 19
5
6 4.0 1.74 10.83
B62L/4 1768 2214 25
3
8 4.0 1.98 9.47
B62L/5 1907 2376 25
3
8 3.5 1.76 10.84
B62L/6 1630 2205 35
4
7 4.5 3.31 5.73
B62L/7 1661 2071 25
3
8 4.0 2.96 6.74
B62L/8 1763 2209 25
2
8 3.5 1.81 10.56
B62L/9 1718 2166 26
3
8 4.5 2.95 6.56
B62L/10 1739 1995 15
5
4
4.5
7.08
2.78
24 3.2 7.3 4.0 2.71 8.51
Page40
APPENDIX IIb (contd.)
INDIVIDUAL SAMPLE DETAILS AFTER 157 WEEKS EXPOSURE
Sample
OD Wt
Weight
MC
Ratings
Deflect
MOE
No
Calc
Wet
%
Mycel
Decay
Mould
(mm)
(GPa)
LMC/12-week pre-decay, Boron treatment 4 sides
B64L/1 1798 2282 27 1
8
2.0 1.61 11.85
B64L/2 1637 2076 27 1
8
2.0 2.49 7.83
B64L/3 1758 2214 26 1
8
2.0 1.90 9.76
B64L/4 1573 2052 30 1
8
2.0 2.38 8.08
B64L/5 1715 2249 31 1
9
2.0 2.34 8.34
B64L/6 1681 2127 27 1
8
2.5 1.91 9.82
B64L/7 1612 2087 29 1
9
2.0 3.54 5.25
B64L/8 1811 2728 51 1
8
3.5 2.88 6.65
B64L/9 1709 2147 26 1
8
2.0 1.76 10.89
B64L/10 1837 2350 28
1
8
2.0
2.74
6.80
30 1.0 8.2 2.2 2.36 8.53
LMC/7-week pre-decay, Copper naphthenate treatment 2 edges
C32L/1 1589 2024 27 1
T
4.0 2.37 7.70
C32L/2 1884 1980 5
6
4
4.5 3.27 5.69
C32L/3 1663
Failed 135 weeks
0 8.00
0.00
C32L/4 1684 2091 24 1
9
4.0 2.11 9.08
C32L/5 1825 2101 15 6
4
5.0 3.06 6.25
C32L/6 1879 2116 13 5
6
4.5 2.52 7.50
C32L/7 1518 1914 26 1
8
4.0 2.71 7.34
C32L/8 1584 1911 21 5
4
4.5 2.38 7.87
C32L/9 1728 2148 24 1
9
4.5 2.54 7.43
C32L/10 1986 2346 18
4
7
5.0
3.89
5.17
19 3.3 6.1 4.4 3.29 6.40
LMC/7-week pre-decay, Copper naphthenate treatment 4 sides
C34L/1 1753 2186 25
1
8 2.5 1.90 9.86
C34L/2 1843 2280 24
1
8 4.5 1.71 11.04
C34L/3 1605 2058 28
1
9 4.0 2.39 7.90
C34L/4 1959 1983 1
1
9 4.5 2.28 8.16
C34L/5 1789 2256 26
1
8 3.0 1.87 10.20
C34L/6 1810 2268 25
1
8 3.5 2.87 6.64
C34L/7 1725 2163 25
1
8 4.0 1.83 10.40
C34L/8 1838 2376 29
1
8 4.0 2.08 9.02
C34L/9 1662 2070 25
1
8 3.0 2.86 6.95
C34L/10 1579 1974 25
1
8
4.0
2.00
9.76
23 1.0 8.1 3.7 2.18 8.99
Page41
APPENDIX IIb (contd.)
INDIVIDUAL SAMPLE DETAILS AFTER 157 WEEKS EXPOSURE
Sample
OD Wt
Weight
MC
Ratings
Deflect
MOE
No
Calc
Wet
%
Mycel
Decay
Mould
(mm)
(GPa)
LMC/7-week pre-decay, Boron treatment 2 edges
B32L/1 1750 2247 28 1
9
4.5 2.07 9.07
B32L/2 1862 2290 23 4
7
4.0 1.85 10.09
B32L/3 1685 2132 27 1
T
4.0 2.59 7.33
B32L/4 1765 2198 25 1
9
3.5 1.72 10.88
B32L/5 1687 2122 26 1
9
4.0 2.03 9.51
B32L/6 1973 2512 27 1
9
3.5 1.61 11.54
B32L/7 1702 2136 25 1
9
4.5 2.90 6.56
B32L/8 1636 2057 26 1
9
2.0 2.63 7.28
B32L/9 1729 2422 40 3
7
4.5 2.57 7.22
B32L/10 2037 2536 24
3
7
4.0
1.79 10.57
27 1.7 8.3 3.9 2.18 9.01
LMC/7-week pre-decay, Boron treatment 4 sides
B34L/1 1799 2411 34 1
9
3.5 1.78 10.47
B34L/2 1738 2168 25 1
9
2.0 2.48 7.84
B34L/3 1569 2101 34 1
T
3.0 2.40 7.91
B34L/4 1556 1982 27 1
8
2.0 2.14 8.78
B34L/5 1699 2137 26 1
9
2.0 2.13 9.05
B34L/6 1705 2148 26 1
8
2.0 2.72 7.17
B34L/7 1329 1695 28 1
8
2.0 3.17 6.18
B34L/8 1755 2231 27 1
9
2.0 2.50 7.60
B34L/9 1630 2039 25 1
8
2.0 2.13 9.08
B34L/10 1794 2298 28
1
8
2.0
2.10
9.01
28 1.0 8.4 2.3 2.36 8.31
LMC/7-week pre-decay, Boron H1.2 Commercial treatment
B3L/1 1500
1924 28 1 10 2.0 3.92 4.91
B3L/2 1463
2003 37 1 10 2.0 3.93 4.95
B3L/3 1490
1908 28 1 10 2.0 2.55 7.80
B3L/4 1497
1873 25 1 10 2.0 3.52 5.62
B3L/5 1407
1783 27 1 10 2.0 2.99 6.66
B3L/6 1424
1873 32 1 10 2.0 3.13 6.21
B3L/7 1299
1663 28 1 10 2.0 4.23 4.61
B3L/8 1429
1792 25 1 10 2.5 3.56 5.32
B3L/9 1351
1711 27 1 10 2.0 3.39 5.65
B3L/10 1478 2770 87
1
10 2.5 7.05 2.66
34 1.0 10.0
2.1 3.83 5.44
Page42
APPENDIX IIb (contd.)
INDIVIDUAL SAMPLE DETAILS AFTER 157 WEEKS EXPOSURE
Sample
OD Wt
Weight
MC
Ratings
Deflect
MOE
No
Calc
Wet
%
Mycel
Decay
Mould
(mm)
(GPa)
LMC/7-week pre-decay, Untreated controls
U3L/1 1656
2068 25 3
8 3.5 1.72 10.92
U3L/2 1689
2000 18 4
4 4.5 2.63 7.05
U3L/3 1775
2170 22 3
8 4.0 1.67 11.51
U3L/4 1553
Failed 107 weeks
0 8.00
0.00
U3L/5 1770
Failed 84 weeks
0 8.00
0.00
U3L/6 1729
1986 15 5
6 5.0 4.06 4.74
U3L/7 1524
Failed 56 weeks
0 8.00
0.00
U3L/8 1637
1931 18 4
7 4.0 2.51 7.37
U3L/9 1779
2053 15 5
4 4.5 2.89 6.59
U3L/10 1588 1932 22 3
7
4.5 2.34 8.36
19 3.9 4.4 4.3 4.18 5.65
LMC/not pre-decayed, Untreated controls
UML/1 1729
Failed 84 weeks
0 8.00
0.00
UML/2 1614 1991 23 1
10 4.0 2.66 7.54
UML/3 1570 2036 30 1
10 4.5 2.44 7.93
UML/4 1911 2178 14 6
4
4.5 3.35 5.90
UML/5 1679 2082 24 3
7
4.0 2.19 8.63
UML/6 1716 2153 25 1
10 4.5 2.37 8.09
UML/7 1464 1811 24 5
4
4.5 2.97 6.42
UML/8 2099 2660 27 1
10 4.5 1.65 10.97
UML/9 1738 2191 26 1
10 4.0 2.15 8.91
UML/10 1688 2103 25
1
10
4.0
2.38
8.04
24 2.2 7.5 4.3 3.02 7.24
Page43