 2021-31 Long Term Plan -
Economic and Financial Strategy Briefing
Workshop Outline
Purpose of workshop:
To provide information to Council to help inform decisions regarding the 2021-31 Long
Term Plan (LTP) Infrastructure and Financial Strategies and to discuss desired rating levels
for the coming years
Items to be discussed:
•
LTP overview and update – Tracy Plane (Manager Strategic and Corporate Planning)
•
Economic outlook and recovery – Jake Gilmer (Senior Strategic Advisor)
•
Asset Management and Infrastructure Strategy – Nicci Wood (Asset Management Advisor)
•
GW Financial Strategy and rates affordability – Tony Stallinger (interim CFO)
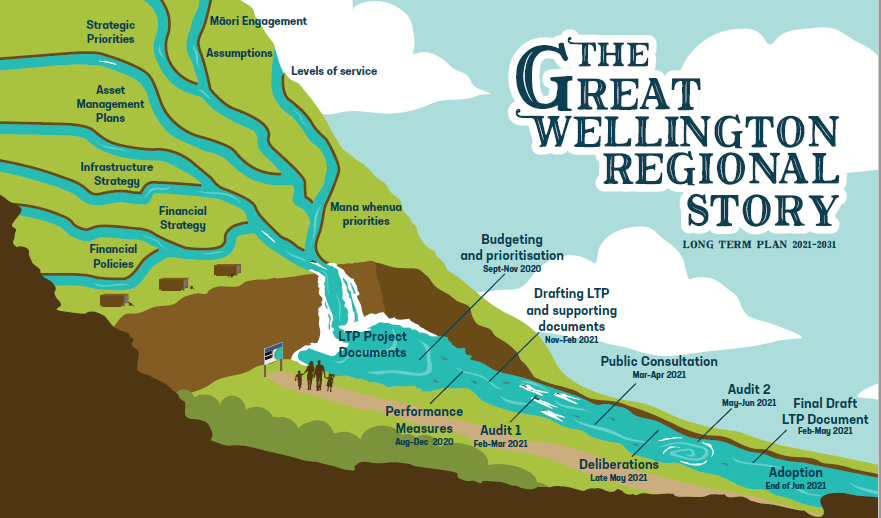
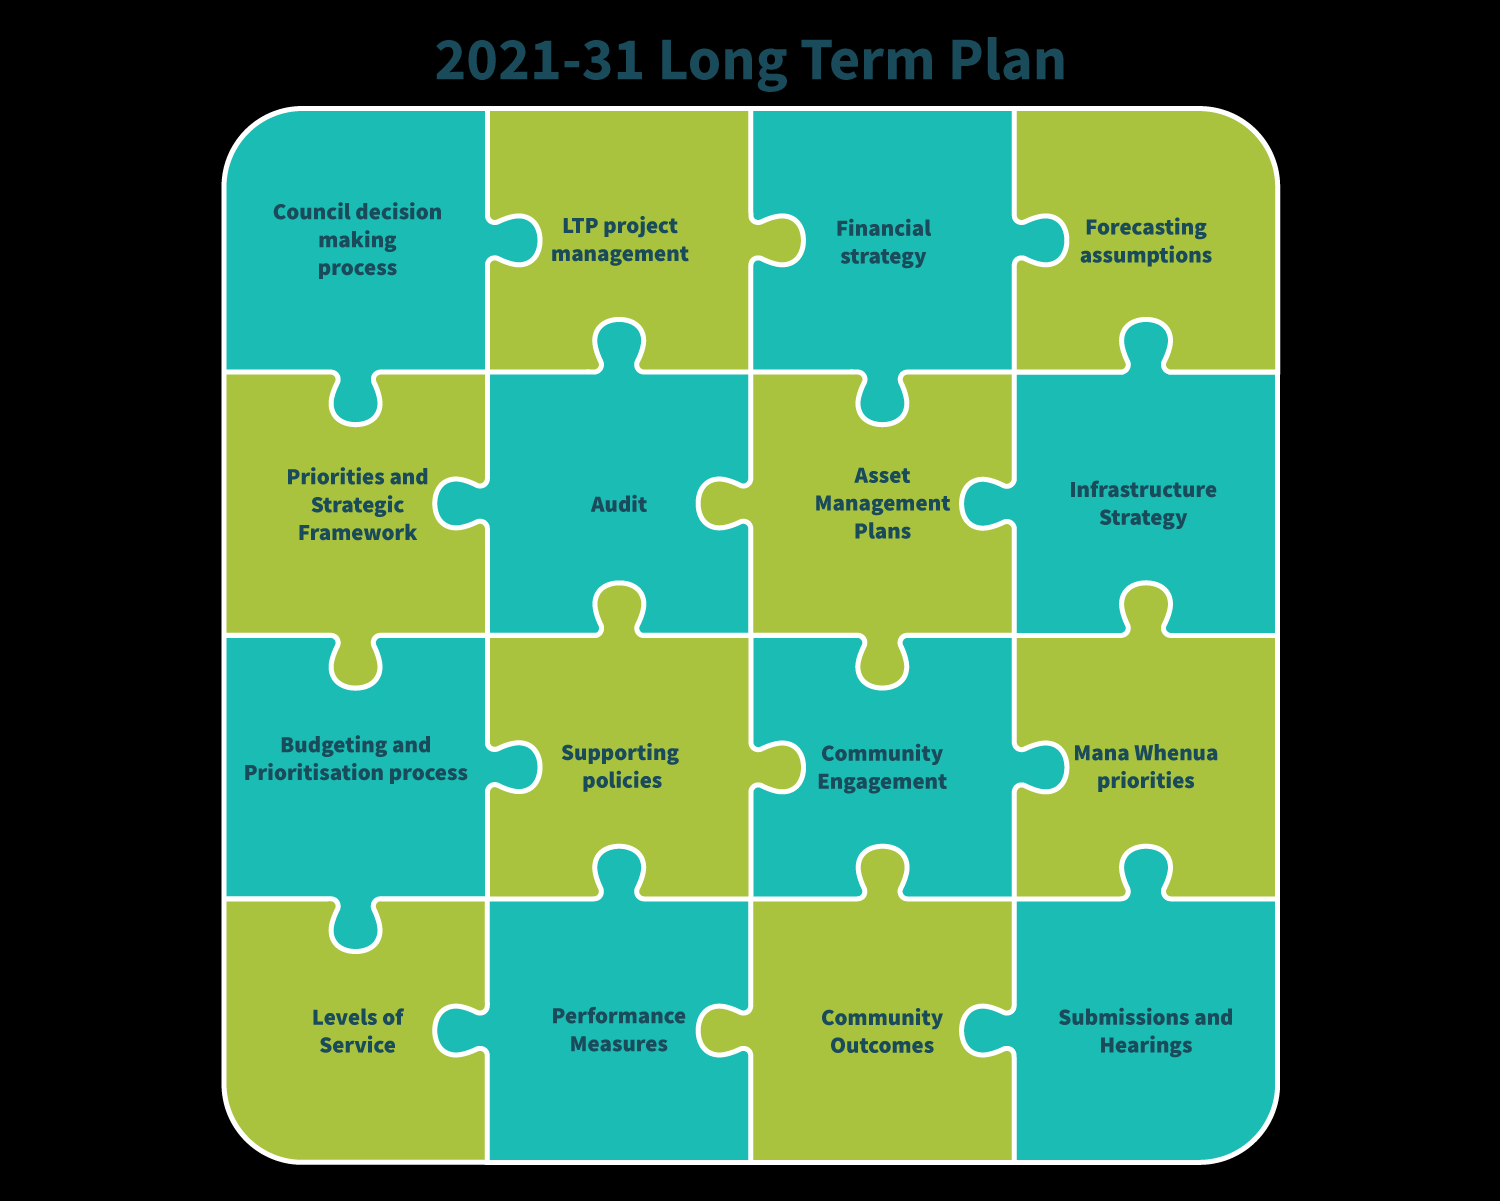 LTP overview – how it fits together

 LTP Assumptions
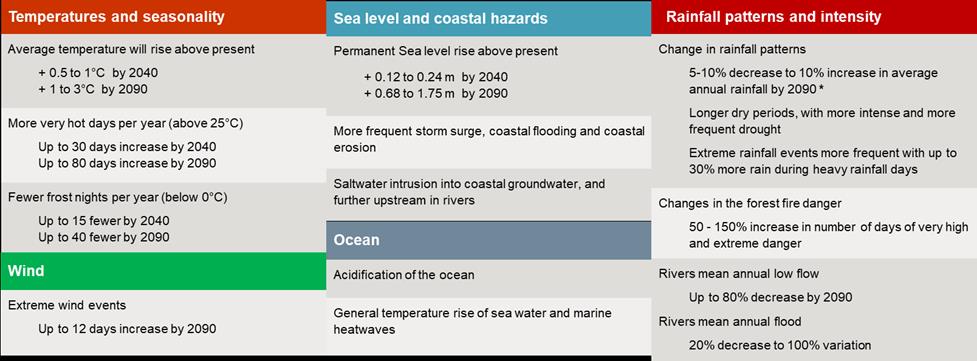
Climate Change
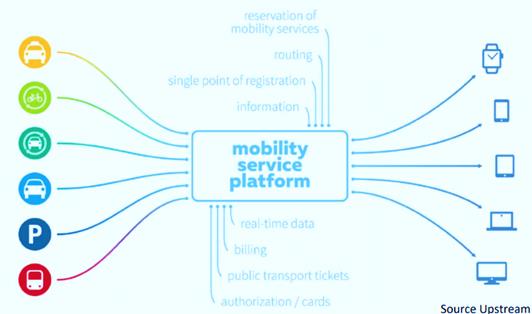
Technology
Legislation and Governance
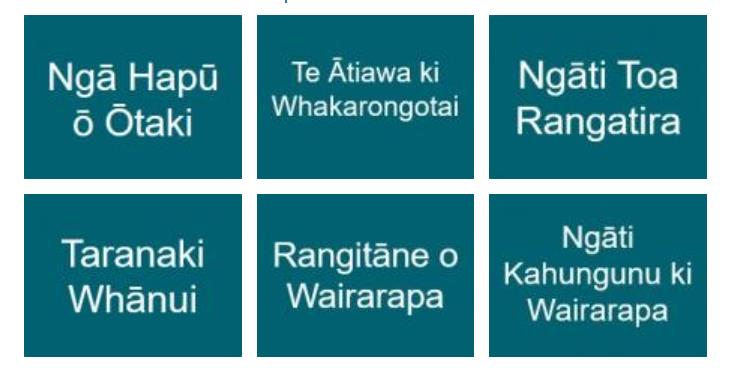
Partnerships with Mana Whenua and Māori
LTP Assumptions
Climate Change
Technology
Legislation and Governance
Partnerships with Mana Whenua and Māori
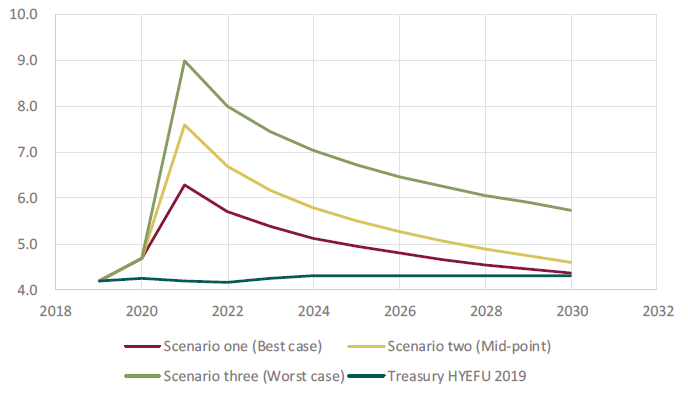
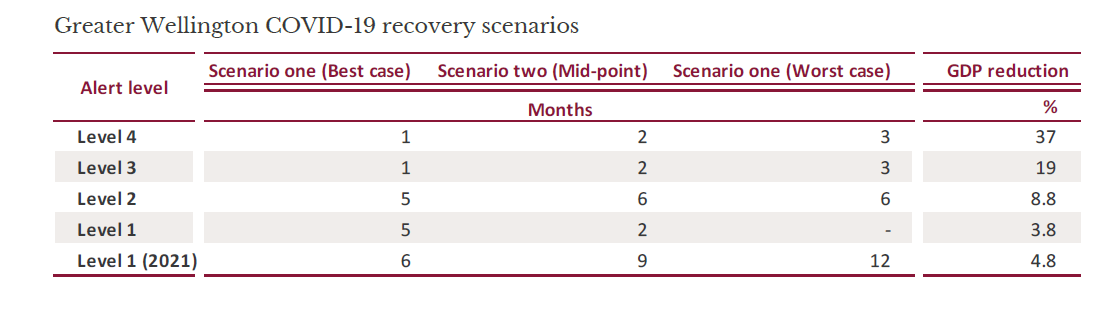 COVID-19 Recovery Scenarios
Alert level
Cumulative months as of 14 August 2020
COVID-19 Recovery Scenarios
Alert level
Cumulative months as of 14 August 2020
Level 4
1
Level 3
1
Level 2
1
Level 1
1
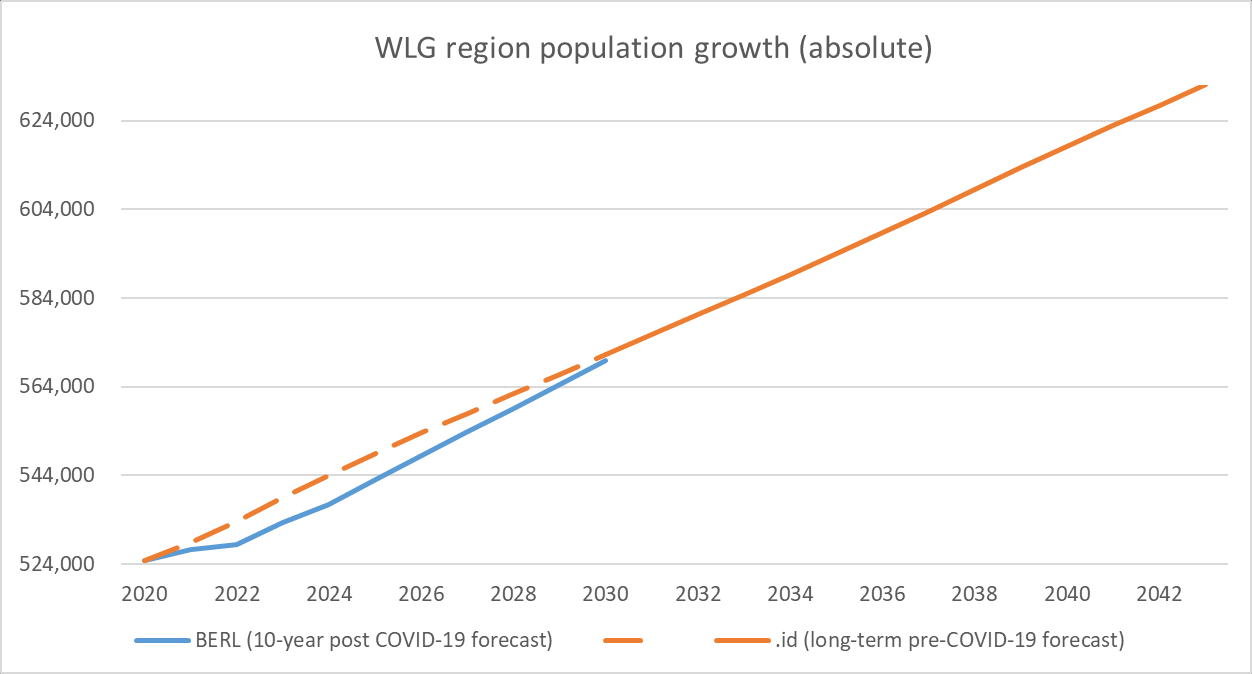
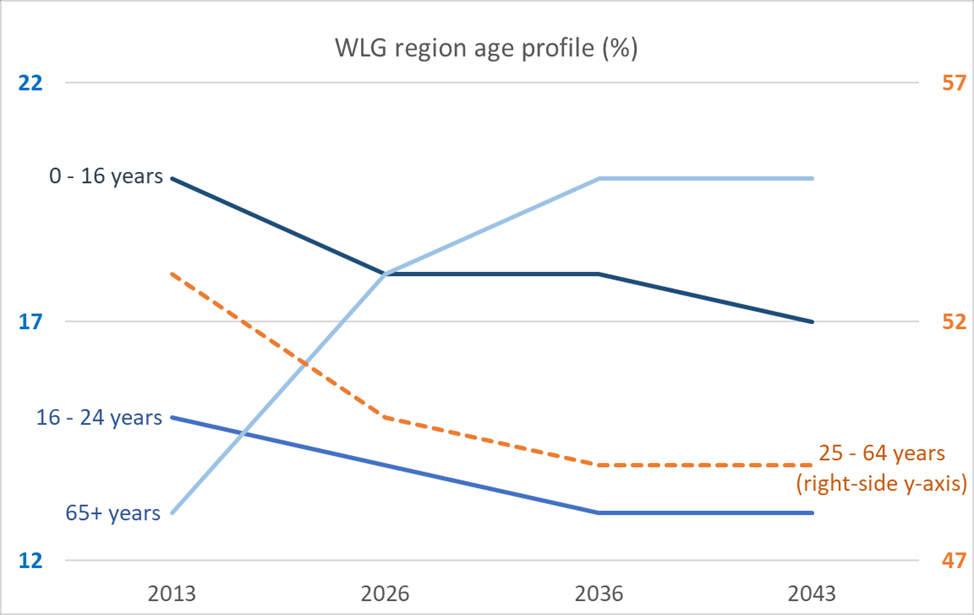 Population Trends
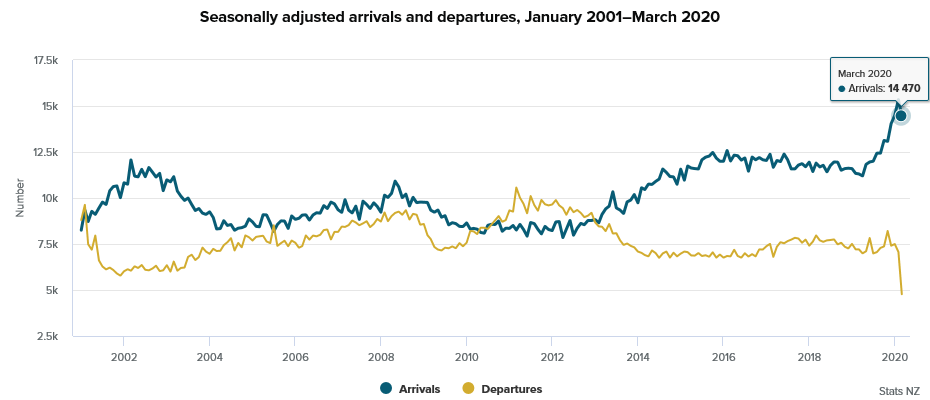 Population – COVID-19 Impact on Migration
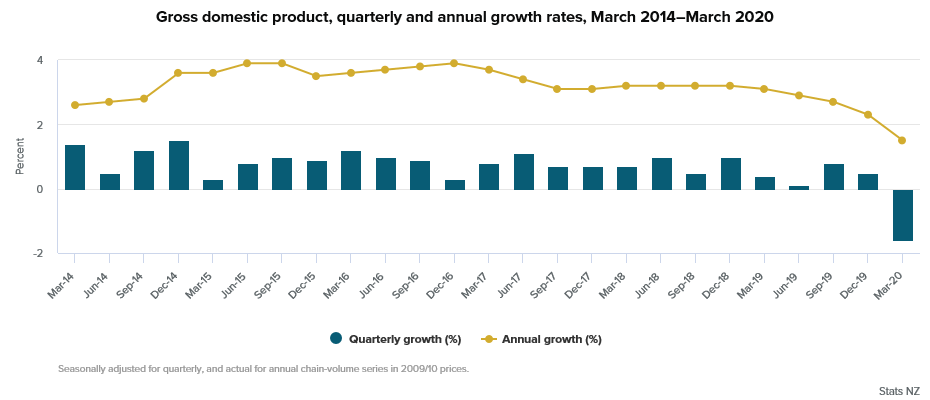
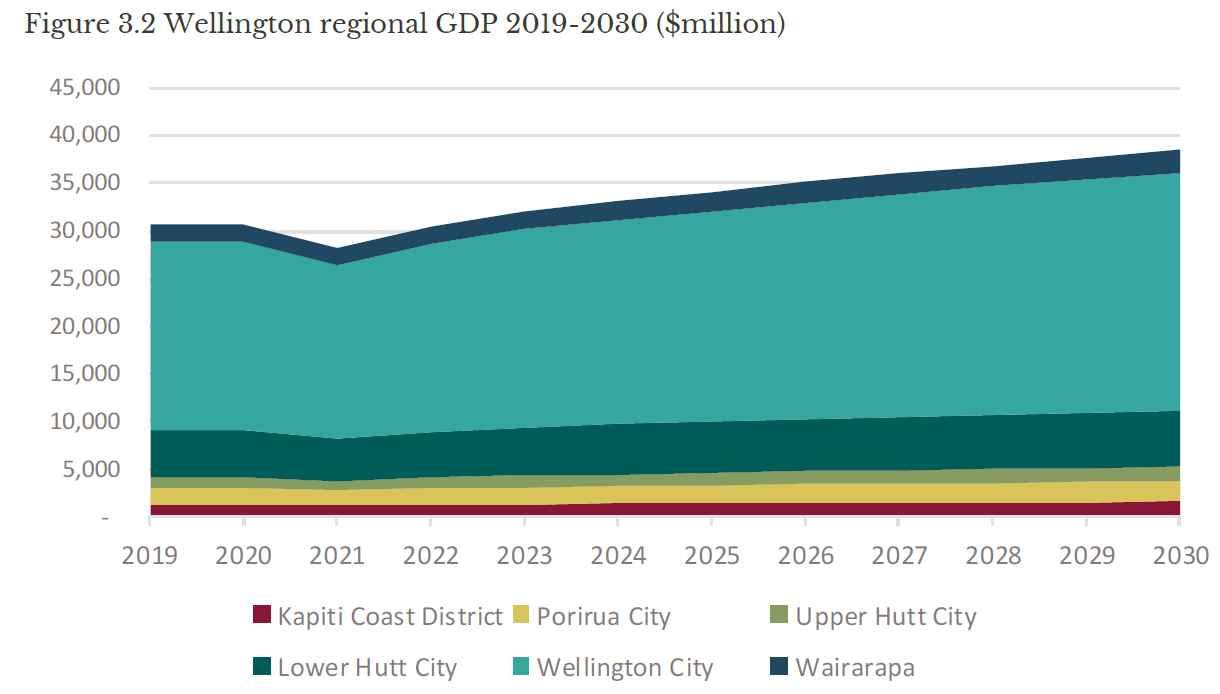 Economy – Gross Domestic Product
 Economy – Unemployment
COVID-19 Unemployment Scenarios
Employment at a glance
June
Quarterly
Annual change
(seasonally adjusted)
2020 quarter
change
Economy – Unemployment
COVID-19 Unemployment Scenarios
Employment at a glance
June
Quarterly
Annual change
(seasonally adjusted)
2020 quarter
change
Percent
Percentage points
Unemployment rate
4.0
-0.2
0.0
Underutilisation rate
12.0
1.6
0.9
Employment rate
66.9
-0.6
-0.6
Labour force participation
69.7
-0.8
-0.6
rate
(000)
Percent
Unemployed
111
-5.1
2.1
Employed
2665
-0.4
1.2
Filled jobs
1989
-0.5
0.8
Working-age population
3984
0.5
2.0
 Council Role in COVID-19 Response and Recovery
Economic outlook summary
•
COVID-19 will impact population and economic growth over the next two years, even
under the best case scenario
•
Local and regional government spending can help keep people employed and stimulate
the economy
•
But that needs to be balanced with rates affordability and consideration of
unemployment levels
Any thoughts or comments before we move on to the next section?
 Infrastructure Strategy
Outline
•
Infrastructure Strategy: What, why, how
•
Audit NZ & SOLGM expectations
•
Significant issues and cross cutting theme
•
Options and decisions
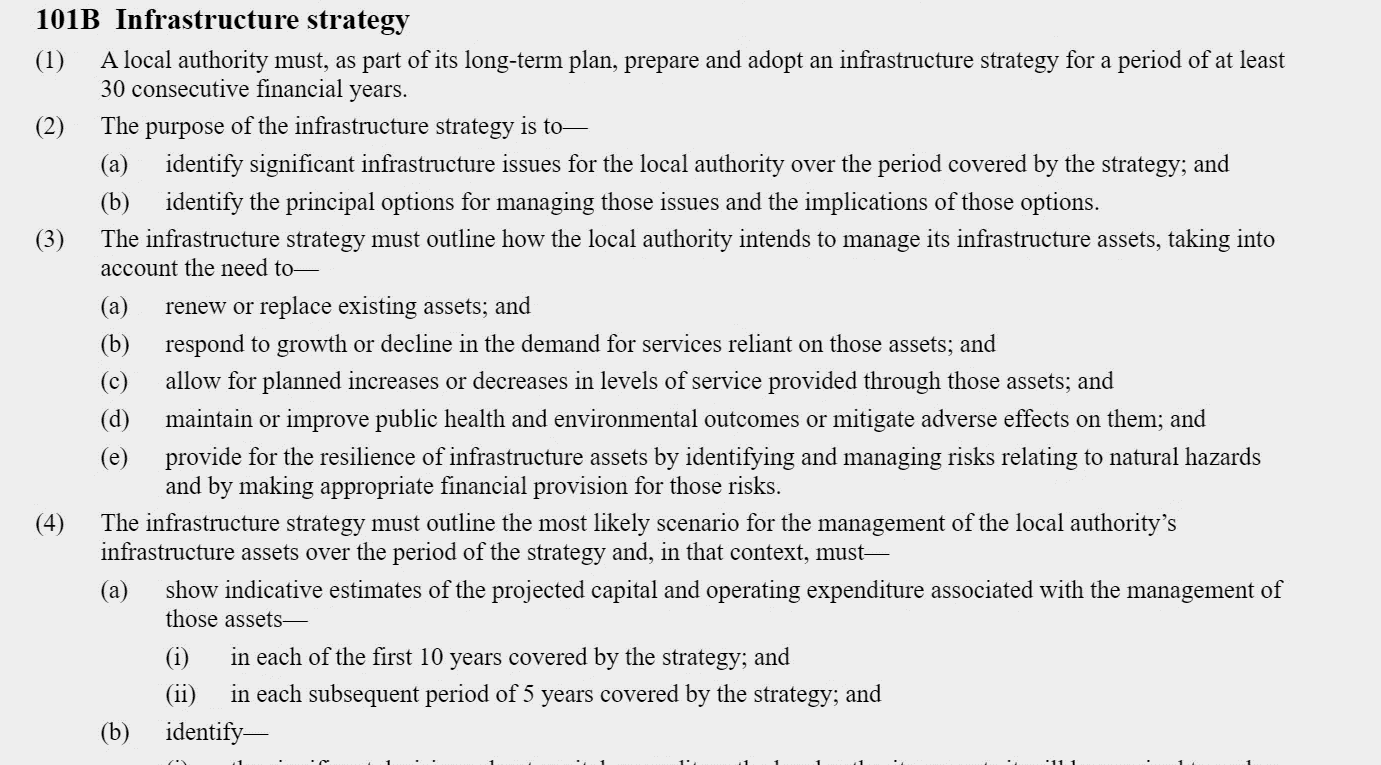 Section 101B of the Local Government Act
Principles Approach
• Forward looking
• Optimal
• Adaptive
• Coordinated
What when how.
Greater Wellington’s Infrastructure Strategy tells you
how we plan to manage our infrastructure over the next
30 years, to support the vision we have for the region.
It defines the nature of the challenges, our
approach and actions for dealing with the challenges;
and the implications of these actions
Audit NZ’S Key Disclosures
•
Clear approach to lifecycle asset management
•
Comprehensive discussion of climate change risks and our long
term responses.
•
Ratepayer affordability
GWRC infrastructure asset groups
•
Public Transport;
•
Water Supply;
•
Flood Protection;
•
Environmental Monitoring;
•
Parks; and
•
Harbour Management


 Assumptions, Future Demand and Risk
The significant infrastructure issues for the region are:
•
Achieving zero carbon 2030
•
Improving resilience
•
Managing critical infrastructure
•
COVID-19 recovery
The cross cutting theme-
•
Affordability
Principle options for managing issues – carbon zero
Issues
Options
Most likely scenario
Policy changes (low carbon consideration policy,
Energy and low carbon first)
Eliminate operational carbon to meet carbon
Retire grazing land
EV bus fleet
zero 2030
Changes to levels of service.
Retire grazing leases
Grazing in Parks
Low carbon accelerator funding
Reforestation and offsetting
MetLink bus and train fleet.
Energy initiatives
New power supplier
Corporate machinery
New infrastructure, investment and policy
Low carbon Accelerator Fund
Energy treating and delivering water supply
Do nothing- submit to >2oC warming /accept
climate crisis
Policy changes (low carbon capital)
PFSI (Permanent Forest Sink) registration of area
Mitigating capital/ embodied carbon of assets review
Off site construction
lifecycle
Low carbon Accelerator Fund
Low carbon Accelerator Fund
Reduce carbon in newly-built assets and
materials, manufacturing, transportation, labour New ways of thinking and working
Drive development of new low carbon products
and end-of-life
– i.e. cement free concrete
Innovation in digital technologies, construction
techniques and development of standard
products.
Principle options for managing issues – resilience
Issues
Options
Most likely scenario
New investment – edge protection
Managed retreat.
Rail in region at risk sea level rise
Partnership investment for protection?
New ways of thinking and working
Accept risk
Rebuild as is
Parks assets at risk from undermining and sea level Retreat
Rebuild inland
rise
Retire activity - Policy changes
Innovation construction techniques
New investment for upgrades and renewal
Reprioritised Ngauranga reservoir strengthening
Innovation construction techniques and
Water supply at risk from seismic events
Ground strengthening Waterloo TP $2M
development of standard products.
Replacement of Kaitoke trunk main ($270mil)
Cross Harbour Pipeline
Vegetated ‘soft’ erosion edge protection
Hutt River erosion edge protection. Critical
Critical stopbank building and /or reconstruction
stopbank building.
Existing and potential land and development at
increasing flood risk
Retreat no new development in hazardous land – Ruamahanga River Scheme buffer land
new policies required
establishment and tree planting ($1m); stopbanks
reconstruction
Do nothing
Principle options for managing issues – infrastructure
Issues
Options
Most likely scenario
$5M IN FUNDING FOR REGIONAL TRAINS
Greater public transport patronage requires
New infrastructure, investment and policy
$4M business case is being prepared
significant investment in infrastructure
Partnership to drive efficiencies
$6B for MRT under LGWM
$200M infra Commission funding for rail
New infrastructure, investment and policy
network upgrades – Improvements to rail line
Existing Metlink assets require ongoing
Partnerships
between Wellington, Wairarapa and Palmerston
investment to meet current LOS
North and Wellington Station safety
Decrease LOS
improvements
Upgrading and new assets
Optimisation of capacity at Te Marua upgrade
Integrated planning with WRGF
Future demand on water supply
$20M?
New source supply for growth
- Growth Porirua
Replacement of Kaitoke trunk main ($270mil)
Different technology
- Regional Growth Plan
Sustainable supply programme
Demand Management - Promoting water
Water meters
conservation
Key decisions
Significant Decision Required
Most Likely Scenario
Achieving Carbon Zero 2030
Capital Carbon options
Wetland restoration
Regional trains and EV bus fleet
Capital carbon lifecycle approach
Sustainable flood protection strategies
Ruamahanga River Scheme
Improving water supply resilience
Strengthening Ngauranga
Waterloo
Kaitoke bridge
Delivering a high quality, reliable public transport
network
Meeting future demands
Developing and committing to delivering Regional Growth
Framework
Lets Get Wellington Moving
RiverLink
 Infrastructure Strategy Questions?
 Financial Strategy
Financial Strategy – guiding principles
We adopted a principle-based approach in developing our Financial Strategy centred on:
•
Fairness and intergenerational equity
•
Balanced budget
•
Borrowings funding
•
Distribution of benefits
•
Market neutrality
•
Willingness to pay
•
Value for money
•
Prudent
Financial Strategy – strategic direction
Our Financial Strategy focuses on these key elements:
•
Rates affordability
We balance demand for enhanced services with our communities’ ability to pay
•
Financial risk management
We have clear and effective risk management practices to protect core service delivery to our
communities
•
Investing in the right activities with appropriate funding and financing sources
We manage Infrastructure Strategy requirements within Financial Strategy limits. We select funding
sources in line with our Revenue and Financing Policy objectives
 Revenue, rates and affordability
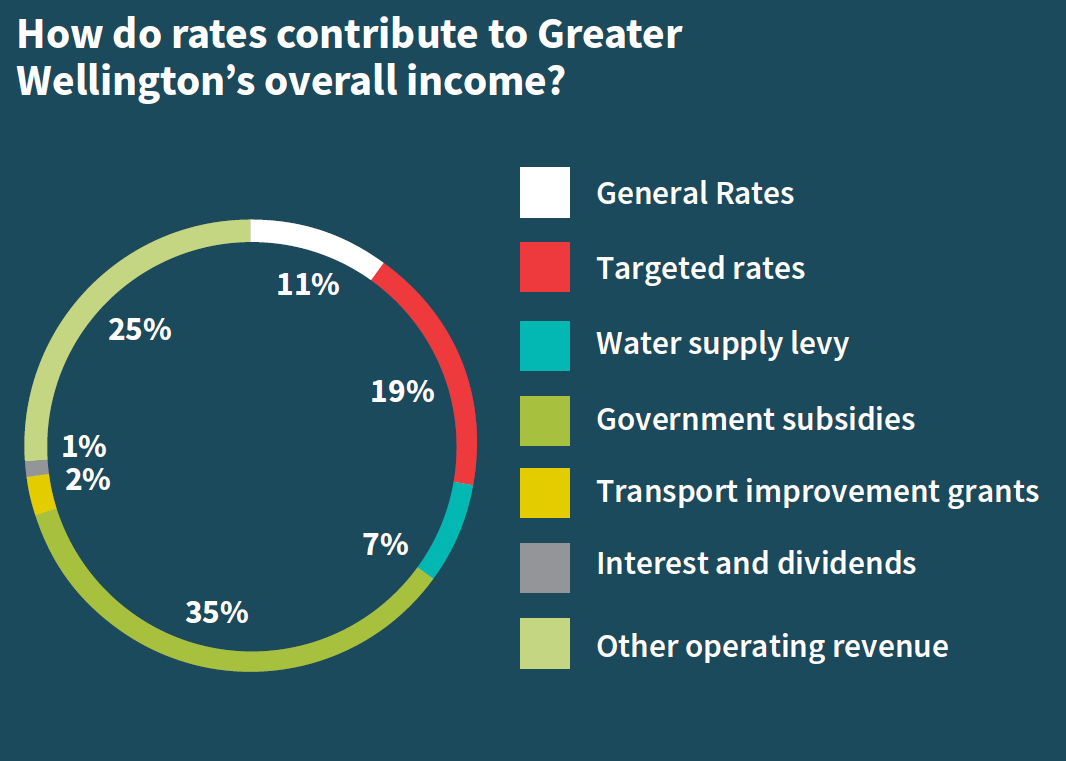 Composition of revenue
 Rates and rates affordability
Rates and rates affordability cont….
Rates % increase vs inflation, household and consumer spending % change year on year
10.0%
5.0%
0.0%
2020/21
2021/22
2022/23
2023/24
2024/25
2025/26
2026/27
2027/28
2028/29
2029/30
2030/31
-5.0%
-10.0%
-15.0%
Limit on rates increase %: 2018 LTP
Inflation rate (LGCI)
Inflation rate CPI
Household incomes % increase
Consumer spending % increase
Rates and rates affordability cont….
Annual change in forecast rates revenue
12%
10%
8%
6%
4%
2%
0%
2014/15
2015/16
2016/17
2017/18
2018/19
2019/20
2020/21
2021/22
2022/23
2023/24
2024/25
2025/26
2026/27
2027/28
Rates increase %: LTP 2015
Rates increase %: LTP 2018
Actual rates increase %
What can our rates look like?
Options
Years 1-3
Years 4-10
Low
0% - 4%
3% - 8%
Main focus is on affordability and alleviation of economic hardship
Economic forecasts indicate rates increases maybe more affordable over this period
Less focus on supporting economic recovery and strategic priorities
Lower rates increases during years 1-3 will result in upward pressure on rates in subsequent years
Aligns with slower population growth and higher unemployment
Delayed projects and constrained service levels during years 1-3 will add to that pressure on rates
High priority on core services, keeping expenditure low and finding
as pressure mounts to catch up and enhance services
savings
Deferral of some significant projects and some service levels reduced
Minimal opportunity for new initiatives
Probable budget deficits in the short term
Medium
5% - 7%
3% - 10%
Balances focus on affordability and alleviation of economic hardship
Economic forecasts indicate rates increases maybe more affordable over this period
with delivering on strategic priorities
Continued pressure on service levels, project delivery and rates will continue, but at a lower level
High priority on core services
than the “low” option above
Emphasis on finding savings opportunities
Deferral of some projects and some service levels reduced to create
opportunity for new initiatives
Possibility of budget deficits in the short term
High
8% - 10%
3% - 12%
Main focus on continued investment to support economic recovery
Economic forecasts indicate rates increases maybe more affordable over this period
and our strategic priorities
Higher rates increases in years 1-3 will create more flexibility and ability to consider lower rates
Less focus on community affordability
increases in subsequent years
Projects deferred only if necessary due to delivery constraints
Demand for increased service levels and project delivery will be lower than other options, as
Savings identified to help fund new initiatives
investment levels were higher during years 1-3
Service levels maintained and increased in some areas
Higher likelihood of running a balanced budget