EECA Brief: ‘Transport’ Jam Layer
22 September 2020
Current Situation
New Zealand is a nation of car lovers. With over 3.3 million vehicles on the road, our vehicles give us
freedom: freedom to jump in the car and go wherever we want, whenever we want. We have never
owned more cars per person than we do now, and it continues to be on an upward trajectory.
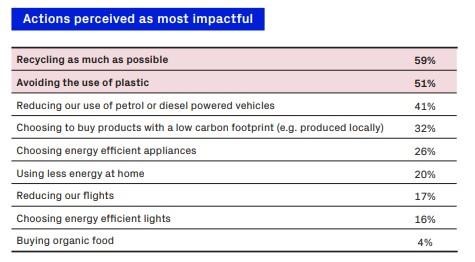
While 83% of New Zealanders believe in climate change, what New Zealanders and businesses are
blissfully unaware of is that their transport is their biggest contributor to their carbon footprint. In fact,
people believe that recycling and waste have more of an impact on the climate than their transport use.
(See graph later in brief.)
In order to achieve New Zealand’s climate change goals, we need New Zealanders and businesses to
understand their transport impact on the climate and rethink how they use their vehicles.
What do we want to achieve?
This sub-campaign needs to:
1. Make New Zealanders and SME’s fully aware that their transport is their biggest contributor to
their carbon footprint/climate change
2. Get New Zealanders and SMEs to change their transport actions (act). Key actions:
1. EV’s are a great option
2. Drive less (eg only: optimise your transport, car-free day)
3. Use or buy/lease a more efficient car (use your smaller car, hybrid, EV)
3. Act as the support layer for the Gen Less 2.0 AV and build Gen Less recognition amongst New
Zealanders and SME’s
This sub-campaign needs to work so cohesively with the Build layer and Always-On layer that New
Zealanders see all of our Gen Less activity as one overarching programme of work. This means using the
‘Power of No’ creative concept and ensuring the messaging and look-and-feel works cohesively and
consistently across:
• all layers (Build, Jam, Always-On),
• all territories (Transport, Home, Business) and
• all possible channels
This campaign uses $200k from the ‘EV Information Campaign’ fund that EECA is responsible for
administering. Therefore it is critical that this campaign has EV-specific messaging in it that can be
reported on.
We wil also be spending $100k to sponsor Haydon Paddon. He is launching his world-first, purpose-built
EV Rally car on 4th November and will be racing it during the ‘City of Auckland’ car rally (14th/15th
November). This is one example of how we will use the Always-On layer (social, eDM etc) to strengthen
and build connection with the Jam layer.
Refer to the Appendix for our Consumer and Business ‘actions’ framework (transport-related). The EECA
team will be using this framework to build up the ‘Always on’ material to build on the Build and Jam layers.
This will include infographics, videos, case studies, quotes, etc.
Why is this important?
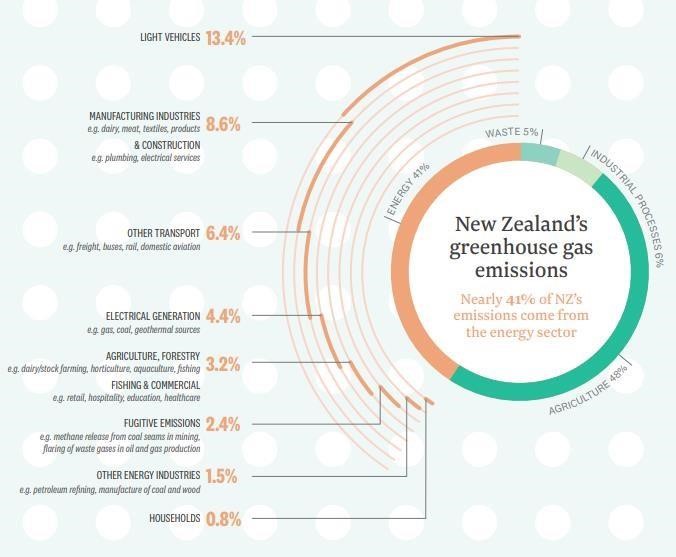
Transport is responsible for 48% of New Zealand’s energy-related greenhouse gas emissions (and 20% of
all greenhouse gas emissions).
Yet, research from TRA shows that New Zealanders do not think about their transport use as a
contributor to their carbon footprint.
(Source: Consumer Monitor - Apr-Jun 2020)
Key Facts
Ministry of Transport stats:
1. 3.3M light passenger vehicles in NZ in 2018. This is a 24% increase between 2012 and 2018
2. While the NZ population grew by 850,000 since 2003, our car fleet has grown by 1,165,000
a. Since 2000, NZ’s light passenger vehicles (eg. cars) has increased by 54%.
b. NZ’s light commercial fleet (including utes) has increased by 79%. Fringe Benefit Tax
exemptions for commercial vehicles has encouraged businesses to buy utes, rather than
cars, when the vehicle is used for both business and personal purposes.
i. Utes are almost universally heavier and less fuel efficient than cars.
3. 802 vehicles per 1000 people
4. Average age of vehicle: 14 years
5. Passengers per light vehicle: 1.58
6. Emissions per vehicle: 2.8 tonnes per year
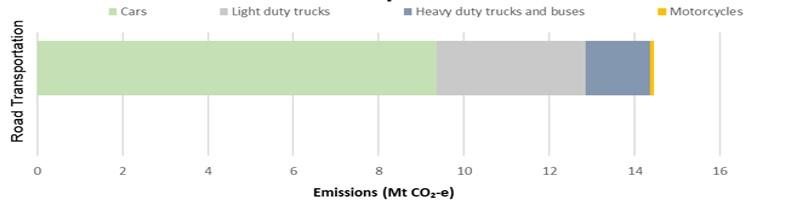
7. Cars are NZ’s biggest road transport emittors:
8. The rate of imported Light commercial vehicles (eg. utes) has increased significantly and are not
always being used for their ‘commerical’ purposes.
Barriers
• General transport o Cars give people a sense of ‘freedom’. People won’t respond well if we ask
them to give up their cars totally o A lack of good public transport infrastructure in Auckland is
keeping people in their cars o Changing vehicles is considered expensive, therefore, New
Zealanders hold onto their cars for a long time
o ‘Bigger is better’ perception
• EVs and hybrids o Limited range of vehicles o Price of EVs o Concern about the battery – how
far can you travel on one charge, lifetime of a battery, and disposal
• Efficient cars o Tend to be smal er
Measures of success
Awareness: People and businesses understand that their transport use is their biggest contributor to
their carbon footprint and climate change
1. (SPE) Percentage of people who say that an individual’s transport choices are the most significant
way they can reduce energy-related emissions
2. (SPE) Percentage of people who agree we need to make changes to our energy use to address
climate change, even if it means a change to our current lifestyle
3. (SPE) Recognition of Gen Less: At least 13% of New Zealanders and 11% of businesses have seen
our Gen Less campaign material
(Note, where no percentage is given, the baseline and target wil be established once we have Q1 Consumer
Monitor data in October.) Taking action:
1. (SPE) Percentage increase of people who have in the past month reduced the number of flights or
petrol/diesel car trips by minimising outings, using videoconferencing, using an electric vehicle or
by walking, biking or taking public transport. (Baseline and target to be set once we have Q1
Consumer Monitor data.)
2. (SPE) At least 37% of businesses are actively seeking to reduce the impact of their energy use and
transport choices
3. (SPE) Percentage of people who are likely to consider an electric vehicle as their next car purchase
(Electric vehicle =
Battery electric vehicle or a
plug-in hybrid electric vehicle)
a. Consumers: At least 37%
b. Businesses: baseline to be established
(Note, where no percentage is given, the baseline and target wil be established once we have Q1 Consumer
Monitor data in October.) Marketing:
1. Gen Less engagement. Depending on the creative approach, this could include:
a. Views on executions
b. Website visits (and tool engagement)
c. Social Media growth and engagement
d. Media coverage
CONSIDERATIONS
• How does this campaign work with, and support, the Build creative and media investment to drive
a cumulative affect (and not distract or confuse)?
• The art direction needs to be in line with the Build AV and the revised Gen Less brand playbook.
Please show us how this might rol out over the ful year to ensure that the Transport territory gets
the visual cues that drives recal (eg. colour treatment, icons etc)
• As mentioned earlier, a significant proportion of this campaign budget comes from our ‘EV
Information Campaign’ fund, so we need to have strong, specific EV messaging to justify/report
this spend.
CALL TO ACTION
Genless.govt.nz, where supporting material and actions will be available. (To be
determined once the media approach has been agreed.)
TIMINGS AND BUDGET
Campaign activity to commence in the first half of November, following/supporting the launch of the Gen
Less 2.0 AV. The next activity planned wil be a business campaign in March.
Budget: $540k.
Note, $200k of this budget needs to be EV-specific, as the budget comes from EV funding we
receive and we must report on how the funding has been spent.
TIMING
Brief to agency
Tuesday 22 September
Reverse brief from Clemenger
EECA approval (incl GM)
Creative Development – interim session
Creative Development – final recommendation
Media Recommendation
Campaign launch
First half of November
APPENDIX
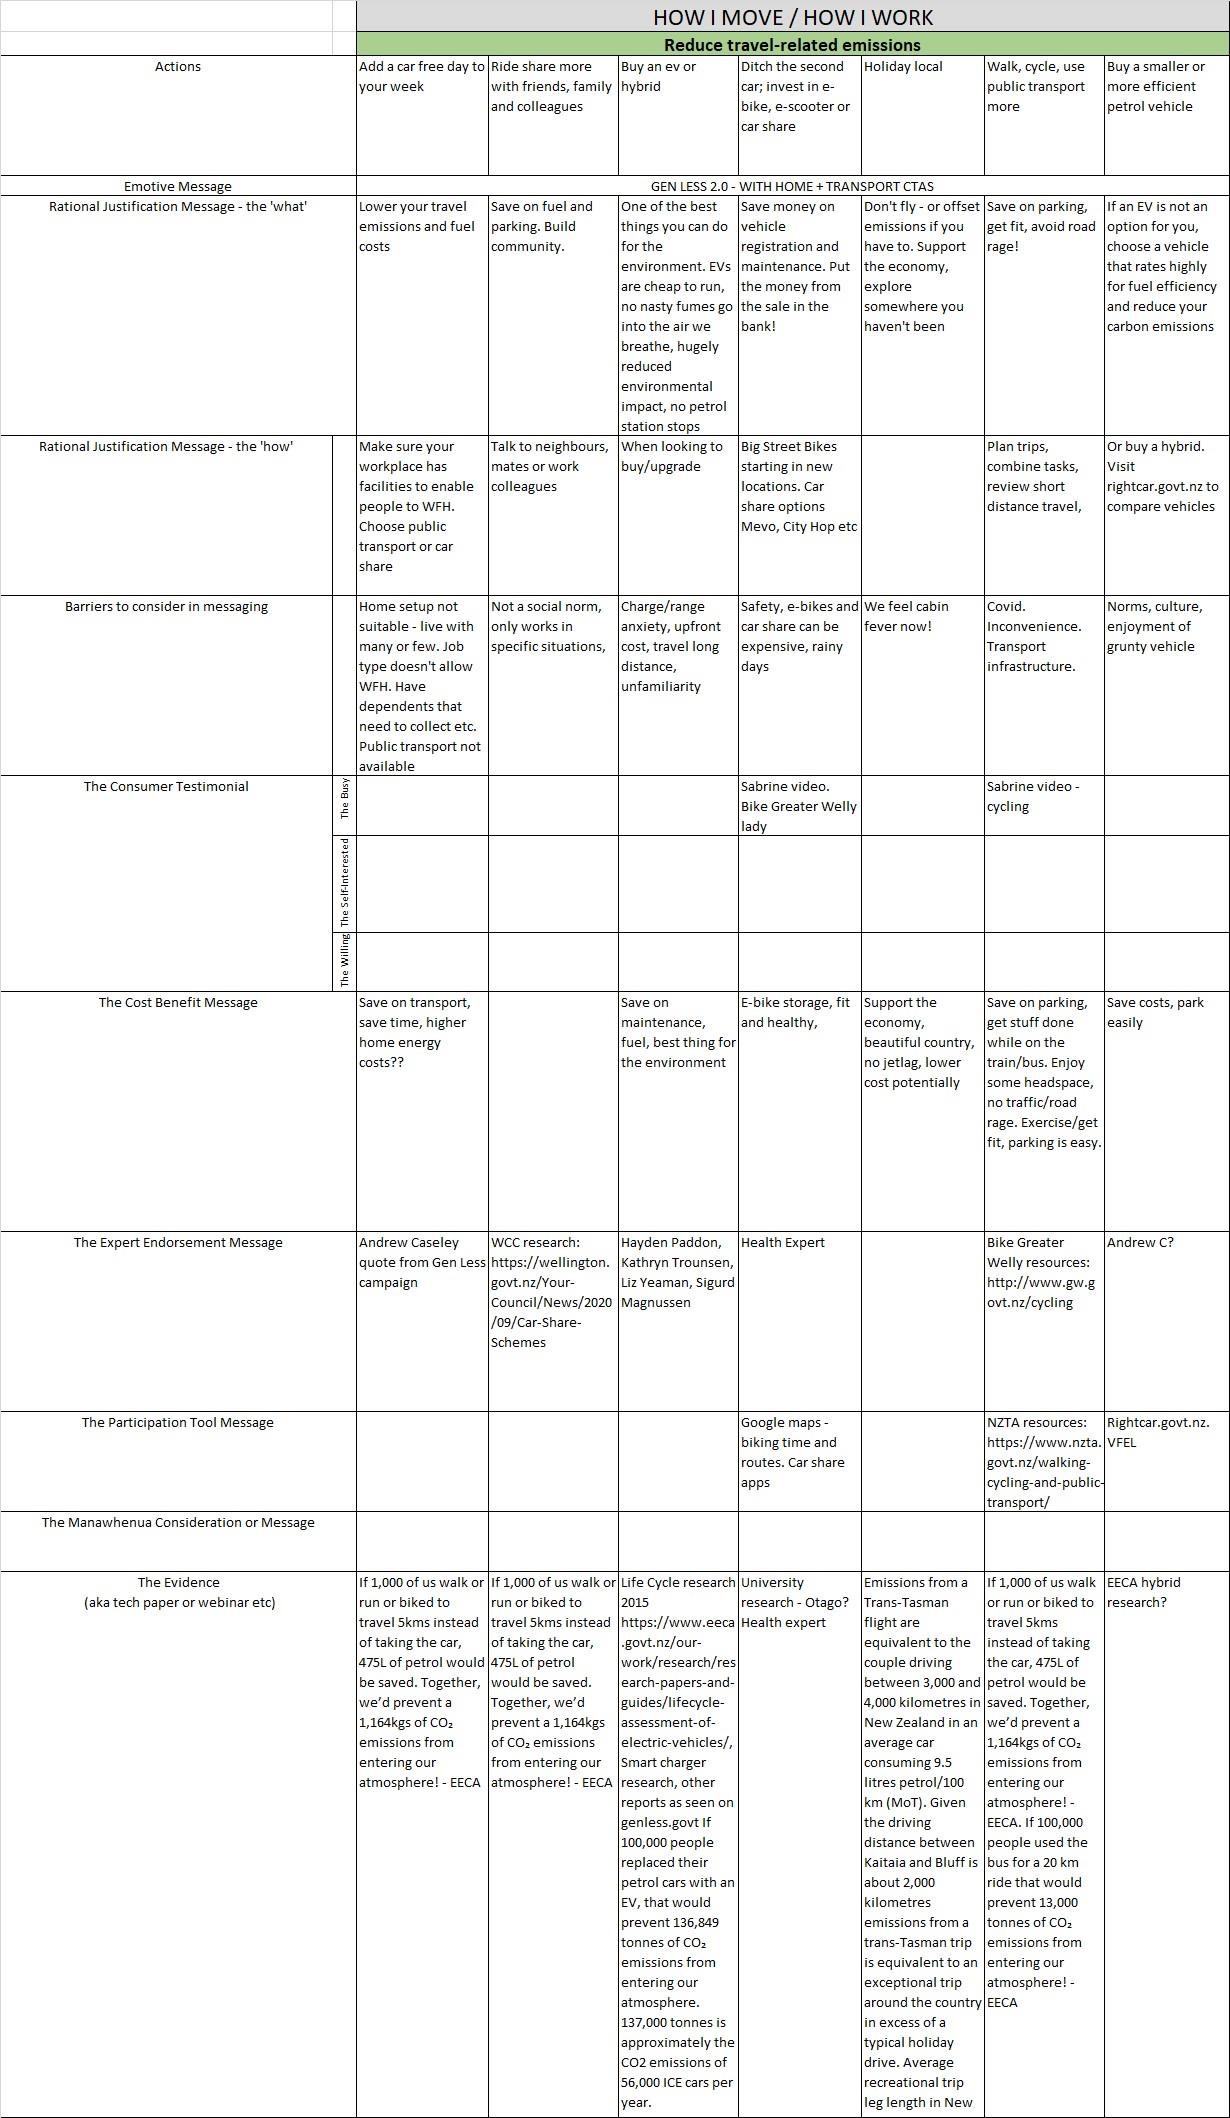
a) Consumer ‘Actions’ Framework (work in progress)
b) Business ‘Actions’ Framework (work in progress)

 Reduce travel-related carbon emissions / Optimise your travel
Actions
Enable your employees to WFH at
least one day a week
Optimise your travel
Emotive Message
Rational Justification Message - the 'what' Before Covid, around 75% of Kiwis Encourage your teams and coleagues to Remove
Buy or lease Evs
Encourage your team to walk, cycle or
Mandate the hiring of EVs on business
drove to work. Even if just one in
carparking
Buy or lease smal er cars; buy or lease
Reduce air travel and use technology
instead
use public transport to get to work
trips
five of them switch the car for
ride share to meeting.
inclusions and
less cars
active transport (biking or
provide public
for your fleet
walking), or even work at home
transport or ride (light, light
one day a week, we could avoid
share inclusions
commercial and
84,000 tonnes of carbon emissions
instead
heavy)
each year – that’s like taking
35,000 cars off the road for good.
Build it into HR policies, enable the
Create corporate accounts for car share
tech to easily support it.
schemes such as CityHop, Mevo or Zilch.
There are more creative transport
options than owning or leasing a car.
Rational Justification Message - the
Car share schemes, e-bikes, e-scooters
'how'
Set up a carpooling or taxi sharing
calendar so staff can share rides when
and public transport are cost-effective
and flexible options that can save
they travel to the same place. Car pool
resources and stil meet your needs.
booking software can help to make sure
Encourage staff to walk to meetings,
the right vehicle is available for the right
or make it easy for them to take a bus
job.
and have the fare reimbursed. There’s
no pressure to do it al at once.
Record data on how your vehicles are
used over a period of months. Use this
Change one trip at a time. Others are
to structure an efficient fleet that stil
doing the
same – and it al adds up.
meets your needs. If 1-2 staff members
often take short trips journey, you may
be able to switch a wagon for a fuel
efficient compact car – or an electric
vehicle.
The Business Testimonial
Not as impactful for smaller
TBC
businesses?
Approach SBN for a SME case study Approach SBN for a SME case study
Datacom? HRC? PWC?
Christchurch City Council car share first
policy?
The Cost Benefit Message
Longer term, it may also save on
Longterm savings Harder sell - although reducing fleet is
Biggest thing you can do for your
rent, power, emissions from office
Save money
good
emissions, cost and time saving.
space.
Document Outline