 Business Case
Sustainability Story
Update
11 May 2020

2
BC Process
Process for each business case
1. Initial review
2. Involvement of sustainability expert in constraints mapping / optioneering /
MCA
3. Capture opportunities
4. Sustainability section in DBC with ‘signposting’
5. Reporting on Outcomes at a broader level (including use of Emissions
modelling)


 Signposting in DBC document
Local considerations
Regional considerations
Signposting in DBC document
Local considerations
Regional considerations
• Access to jobs for residents
• Resilience of strategic transport corridors
• Access for business
• Value for money of transport
• Enabling growth area
infrastructure
development in line with FULSS
• Prioritisation of projects
• Efficiency of the regional transport
network
Economic
Local considerations
• Cost of travel for residents
Local considerations
• Transport choice available
• Natural assets – Significant
Viable
Equitable
• Safety of transport network
ecological area, Streams, rivers and
• Human Health and wellbeing
waterways
• Stormwater effects and treatments
Social
• Social cohesion
Environmental
• Effects on surrounding land use
• Flooding impacts (local level)
• Liveability of future growth areas
• Mode share of growth areas
Liveability
Regional considerations
Regional considerations
• Reduction in VKT
• Mode share and travel behaviour
• Reduction in CO2
• Safety of transport network
• Impact on Coastal marine areas
• Access to social opportunities
• Flooding impacts

4
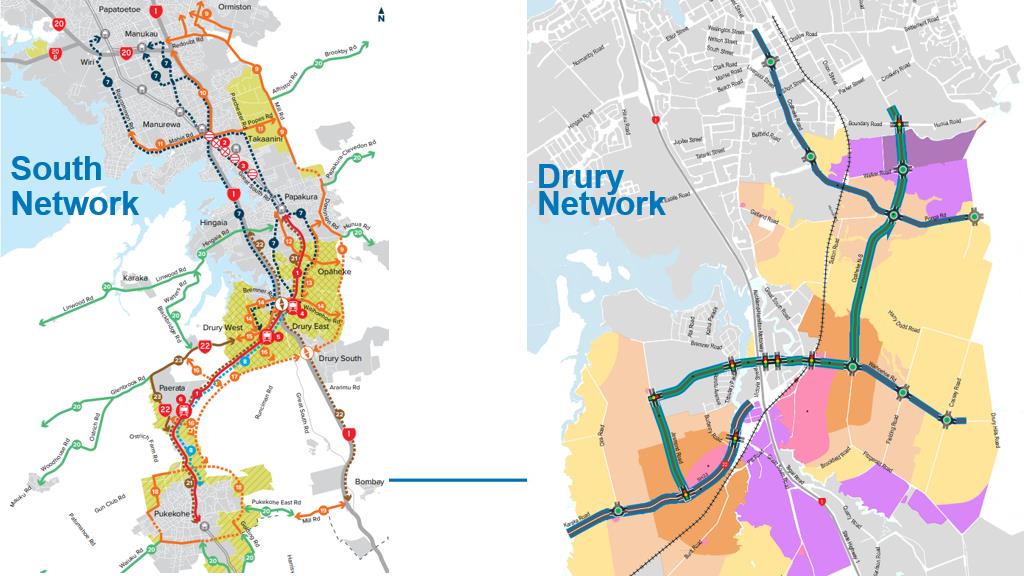
An example – Drury Package
Detailed Business Case

5


 Drury package –Regional benefits
Social
Drury package –Regional benefits
Social
• Options that integrate well with
Economic
future land use and FUZ
development have been selected.
• Forms part of the FTN
• Opportunity to integrate with rail
supporting access to jobs for
stations at Drury West and Drury
residents and access for
Central providing transport choice
business.
and increasing mode share of
• Provide direct connections
growth areas.
for residents and businesses
Environmental
into the wider transport
network.
Reduced emissions as a result of mode shift
• Opportunity to integrate with
by:
Papakura to Bombay project
• Four-lane capacity prioritises PT and active
enabling growth area
modes enabling transport choice,
development.
accessibility and travel behaviour change
within existing and new communities.
• In addition to population growth, the
Structure Plan also enables employment
growth in Drury and will reduce reliance on
longer distance journeys to work
7
Drury Package – Local Environment Outcomes
Wetlands
Recycling materials
Opportunity for a centralised wetland in the
Four-laning presents a significant burden on resource
Bremner/Waihoehoe Roads area and a
use, as well as poor soils in the Opaheke area, that
‘floating’ bridge at Ponga Symonds Stream to
will require a focus on minimising excessive use of
enhance the connection and revegetate the
materials and identification of opportunities to reuse
embankments.
materials during the design phase.
Earthworks
Riparian habitats
Earthmoving quantities have been
Opportunities to enhance riparian
considered to seek a good cut/fill
habitat and retain mature vegetation
balance, significant gullies have been
have also been identified, including
avoided
preservation of mature trees that may
support roosting ‘Threatened’ long-
tailed bats.
Habitats
Climate change and flooding
Wherever possible, impacts on local
Options which impact the least on flood zones
streams and Significant Ecological Areas
and Overland Flow Paths have been selected
have been avoided, and where this has
wherever possible, however some robust flood
not been possible opportunities for
mitigation measures will need to be
mitigation through design have been
incorporated across the local roads network
identified.
such as Bremner Road east.
 Drury Package – Local Economic Outcomes
Transport Choice
Drury Package – Local Economic Outcomes
Transport Choice
Four-lane capacity prioritises PT and active
modes enabling transport choice, accessibility
and travel behaviour change within existing
and new communities.
Connection to the rail corridor
•
Greater than 50% PT mode share for AM
Opportunity to integrate with rail stations at Drury
peak northbound trips in 2048+
West and Drury Central providing transport choice
and increasing mode share of growth areas.
•
Ability to cater for buses every 4min along
FTN corridors
•
Enables access to the wider PT network
•
Additional 1,800 PT trips in the AM peak
•
40% of rail patronage at Drury Central station
estimated to be facilitated by the proposed
upgrades
Access to jobs
Integrate with other projects
Forms part of the FTN supporting access to
Opportunity to integrate with Papakura to Bombay
jobs for residents and access for business
project enabling growth area development.
•
10% (107,400) of all jobs in Auckland
accessible within 45min from Drury via PT
Integration with development
Connectivity
•
30% (313,000) of all jobs in Auckland
Provide direct connections for residents
accessible within 60min from Drury via PT
Options that integrate well with future land use
and businesses into the wider transport
•
91,500 jobs accessible within 30min by car
and FUZ development have been selected.
network.
•
Provision for 13km of new walking and cycling
facilities
•
Amenity of these corridors expected to
improve by the FTN corridors. 10% reduction
of daily traffic flows expected.
 Drury Package – Local Social Outcomes
Links to Greenways
Drury Package – Local Social Outcomes
Links to Greenways
For the Bremner / Waihoehoe Rd sections
there is the opportunity to link with the
Local Board greenway route, providing
Walking and
another connection for communities.
cycling
Change in human health
All projects
and emissions
support safer
walking and
Reduction in annual CO2 emissions by
cycling through
1,270 tonnes, and reduction of annual
segregated
fuel consumption by 575 tonnes when
routes.
compared to the do-min
Sympathetic to
community facilities
Wherever possible, options have been
Travel choice
selected that have reduced impact on
social facilities including local reserves
Provides better choice for residents for
and sports fields, as well as heritage
short and longer trips, and encourages
sites.
healthy and active lifestyles.
2,700 dwellings are expected to be
within 800m walk catchment, and
43,000 dwellings within 3km cycling
catchment

10
General Approach to Emissions Modelling
• Use the VEPM model to estimate emissions rates (kg/km)
• Apply VEPM rates to transportation models to estimate emissions
• Assess the impact of the transport intervention by comparing Scenarios:
• Existing: Current situation for context (2016 or 2018 model)
• Baseline: A future without the recommended intervention
• Option: A future the proposed transport intervention
• Sensitivity test long-term results with shorter-term rates, to separately identify
the impact of the assumed future fleet changes

11
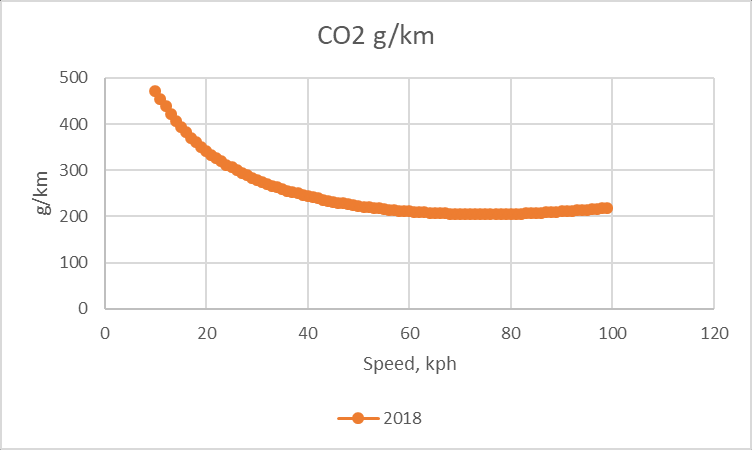
VEPM Vehicle Emissions Modelling
• Tail pipe emissions are a function of:
• Amount of vehicle travel (
VKT)
•
Speed of travel
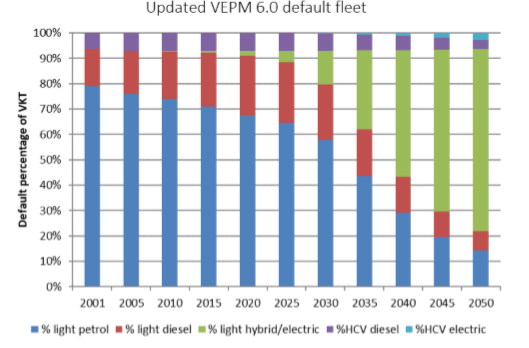
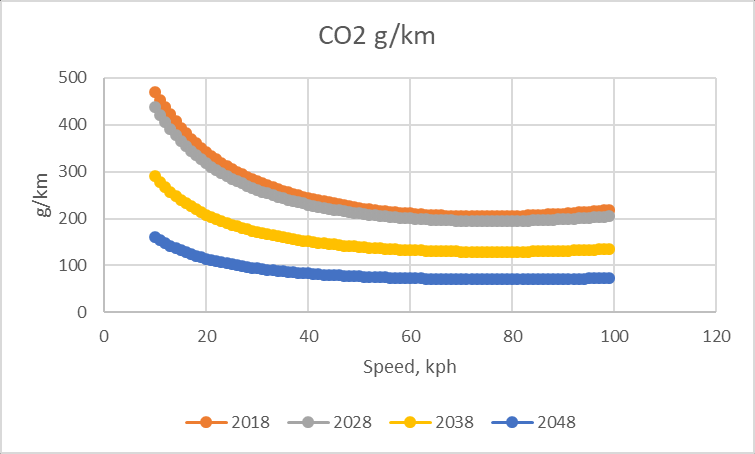
• Vehicle
fleet assumptions (rates differ by forecast year)
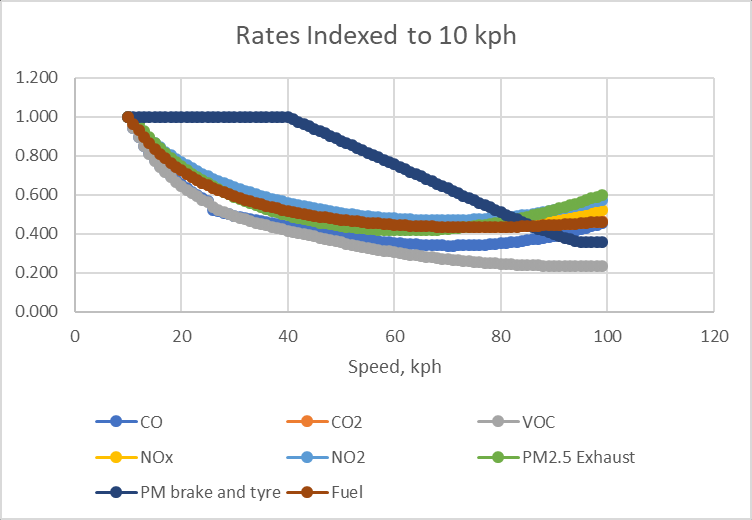
• VEPM provides rates for average journey speeds
• Rates applied to each road in transport models scenarios
• Emissions include:
• CO, CO , VOC, NOX, NO , PM, Fuel consumption
2
2
Limitations of VEPM:
• The MoT fuel consumption factors are considered more accurate than VEPM but don't provide needed speed effect
• further planned updates to VEPM this year, including improving real world fuel consumption in VEPM

12
Impact of Speed

13
Impact of Fleet Assumptions
Tim
e

14
Impact of Interventions
• Models predict VKT and speed, based on:
• Land use inputs
• Policy assumptions
• Network and service inputs
• Proposed Interventions impact VKT via:
• Mode shift (amount of travel by vehicle)
• Change in destination (distance to destination)
• Time of day (peak travel and speed)
• Network performance (speed)
• Choice of route (shorter or longer distance routes)

15
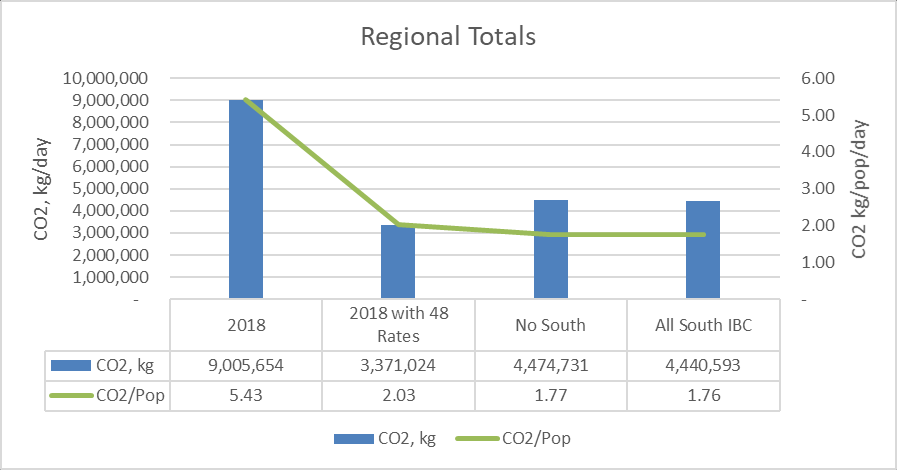
Suggested Baseline
• Use
total emissions as key indicator to compare future scenarios but
•
also use
per-capita values to benchmark against current day network and other areas (controlling for changes in fleet composition)
•
Sensitivity test with and without changes related to
future vehicle fleet assumptions
• Assume
Common land use for Baseline and Option scenarios, comprising:
•
Full development of Greenfield areas with total yield as per Council forecasts
•
Regional growth as per agreed Auckland Forecasting Centre forecasts
•
Sensitivity test with revised spatial allocations, retaining regional total:
•
Centralised employment (reduced in growth areas)
•
Dispersed density (rather than Structure Plan focus around stations)
• Use a ‘
Do Minimum’ transport network as the Baseline Network, comprising:
•
existing network
•
Plus committed projects in growth area
•
Plus ‘ATAP3’ assumptions outside growth areas
•
Assumed local and collector roads plus reduced speeds on rural roads in greenfield growth areas
• Use common ‘ATAP3’ economic and policy inputs to models
• Assess short, medium, longterm: 2028, 2038, 2048, 2048+ (note emissions targets set for 2030/2050)

16
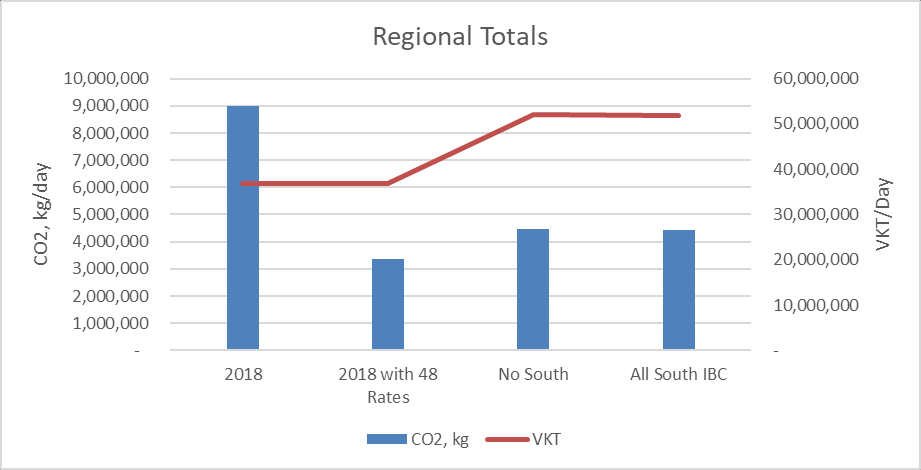
Programme Outcomes (All South IBC Network)
Note: Early illustrative results, to be updated for final business cases

17
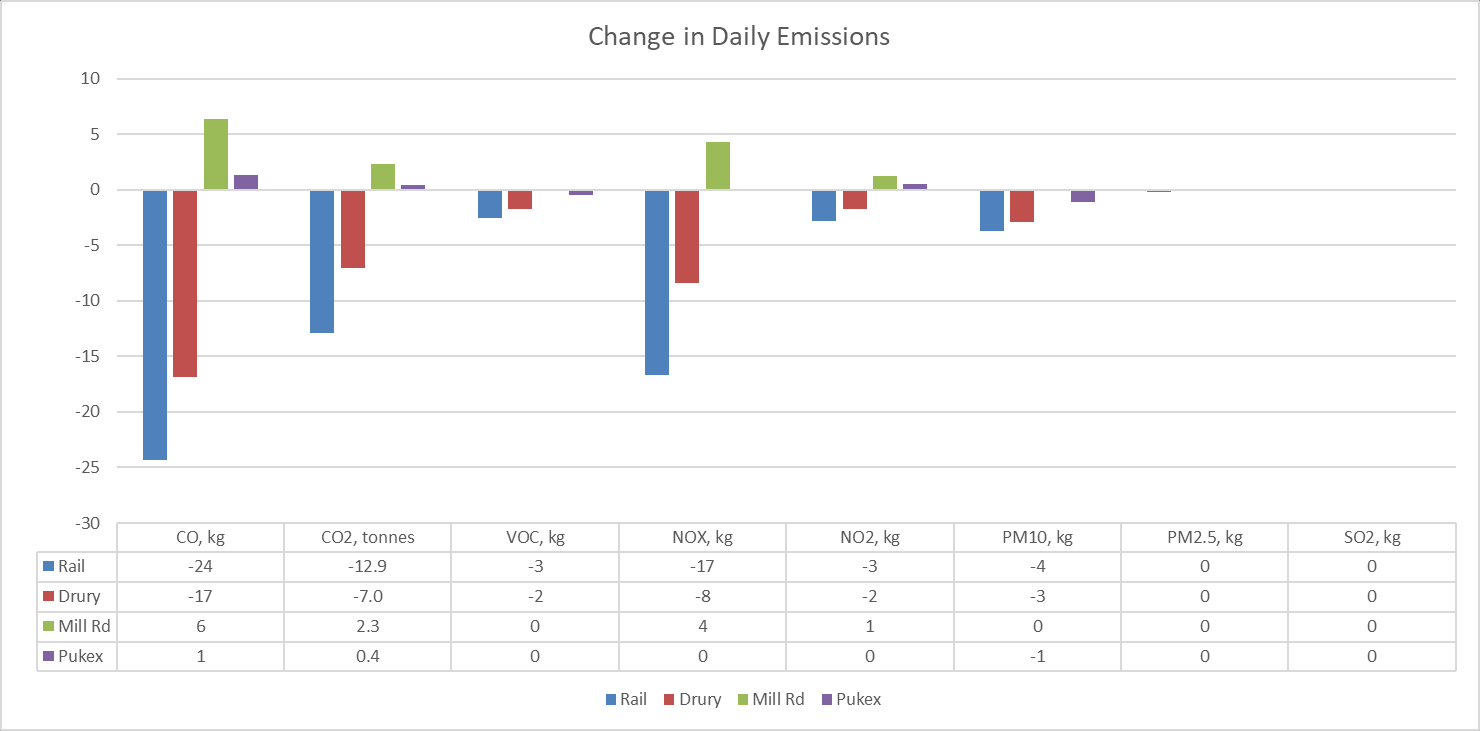
Project Outcomes (Current Business Cases)
Note: Early illustrative results, to be updated for final business cases

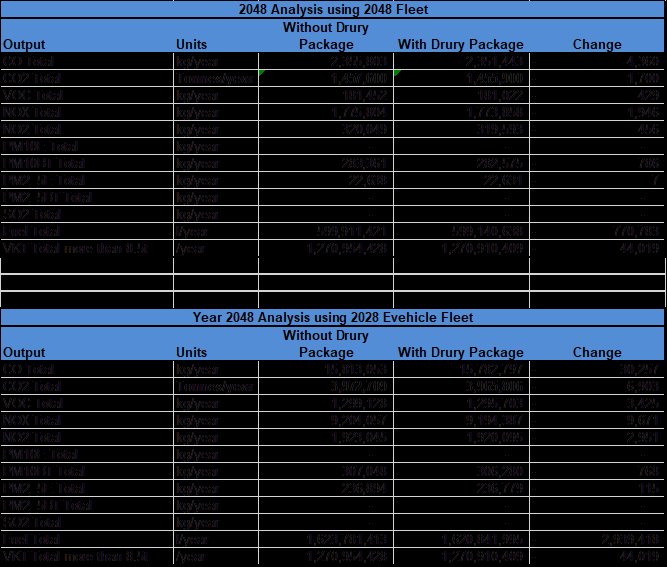
18
Sensitivity test on
fleet assumptions

19
Relevance for the AEE
• Guideline being developed for AEE based on work done as part of the BC
• Regional Benefits reported as part of section 1 of the AEE which covers
Reasons for the Project
• Approach to design and alternatives assessment to explain consideration of
sustainability
• Planner to analyse positive sustainability effects, drawing on specialist
assessments and recommended mitigation e.g. riparian planting
• Further benefits and opportunities could be captured in
conditions/management plans e.g. principles in ULDF and CMP.