AECOM
Mill Road Upgrade
Air Quality Assessment
Air Quality Assessment
Redoubt Rd to Mill Road Corridor Upgrade
Client: Auckland Transport
ABN: N/A
Prepared by
AECOM New Zealand Limited 8 Mahuhu Crescent, Auckland 1010, PO Box 4241, Auckland 1140, New Zealand
T +64 9 967 9200 F +64 9 967 9201 www.aecom.com
27-Aug-2013
Job No.: 60250009
AECOM in Australia and New Zealand is certified to the latest version of ISO9001, ISO14001, AS/NZS4801 and OHSAS18001.
© AECOM New Zealand Limited (AECOM). All rights reserved.
AECOM has prepared this document for the sole use of the Client and for a specific purpose, each as expressly stated in the document. No o her
party should rely on his document without the prior written consent of AECOM. AECOM undertakes no duty, nor accepts any responsibility, to any
third party who may rely upon or use this document. This document has been prepared based on the Client’s description of its requirements and
AECOM’s experience, having regard to assumptions that AECOM can reasonably be expected to make in accordance with sound professional
principles. AECOM may also have relied upon informa ion provided by the Client and other third parties to prepare this document, some of which
may not have been verified. Subject to the above conditions, this document may be transmitted, reproduced or disseminated only in its entirety.
\\NZAKL1FP002\transportation$\_PROJECTS\ATTH ACT Mill Rd Corridor 60250009\6. Draft Docs\6.1 Reports\NOR\Updated AEE September
2013\Appendix K - Air quality assessment\MillRdAQA_Issue_20130827.docx
Revision D – 27-Aug-2013
Prepared for – Auckland Transport – ABN: N/A
AECOM
Mill Road Upgrade
Air Quality Assessment
Table of Contents
Executive Summary
i
1.0
Introduction
1
2.0
Project Description
2
3.0
Methodology
3
3.1
Approach to Assessment of Effects
3
3.1.1
Assessment Overview
3
3.1.2
Review of Existing Environment
4
3.1.3
Consultation
4
3.1.4
Assessment of Construction Effects
5
3.1.5
Assessment of Operational Effects
5
4.0
Assessment Matters
7
4.1
National Planning Policy
7
4.1.1
Resource Management Act 1991
7
4.1.2
Land Transport Management Act
8
4.1.3
Air Quality Standards and Guidelines
8
4.2
Regional Planning Policy
9
5.0
Existing Environment
11
5.1
Land use and Topography
11
5.2
Receptor Locations
11
5.3
Meteorology
13
5.4
Background Ambient Air Quality
14
6.0
Traffic Data and Emission Rates
18
6.1
Traffic Modelling and Data
18
6.2
Emission Modelling and Rates
18
7.0
Dispersion Modelling
20
7.1
Modelling Approach
20
7.2
Modelling Input Data
20
7.2.1
Emissions Inventory
20
7.2.2
Meteorological Data
20
7.2.3
Background Pol utant Concentrations
21
7.2.4
Receptor Locations
22
7.2.5
Additional Model Parameters
23
7.3
Conversion of NOx to NO2
23
7.4
Assumptions and Limitations
23
8.0
Assessment of Effects
24
8.1
Construction Activities
24
8.2
Operational Effects
26
8.2.1
Carbon monoxide (CO)
26
8.2.2
Nitrogen dioxide (NO2)
27
8.2.3
Fine particulate matter (PM10)
28
8.2.4
Fine particulate matter (PM2.5)
28
8.2.5
Benzene (as Volatile Organic Compounds)
29
9.0
Mitigation of Effects
30
9.1
Construction Effects
30
9.2
Operational Effects
32
10.0
Summary and conclusion
33
Appendix A
Traffic data for Air Quality Assessment
A
Appendix B
Modelling Results
B-A
Appendix C
Predicted Change in Pollutant Concentrations
C-A
\\NZAKL1FP002\transportation$\_PROJECTS\ATTH ACT Mill Rd Corridor 60250009\6. Draft Docs\6.1 Reports\NOR\Updated AEE September
2013\Appendix K - Air quality assessment\MillRdAQA_Issue_20130827.docx
Revision D – 27-Aug-2013
Prepared for – Auckland Transport – ABN: N/A
AECOM
Mill Road Upgrade
i
Air Quality Assessment
Executive Summary
AECOM has been commissioned by Auckland Transport to carry out an Air Quality Assessment for the proposed
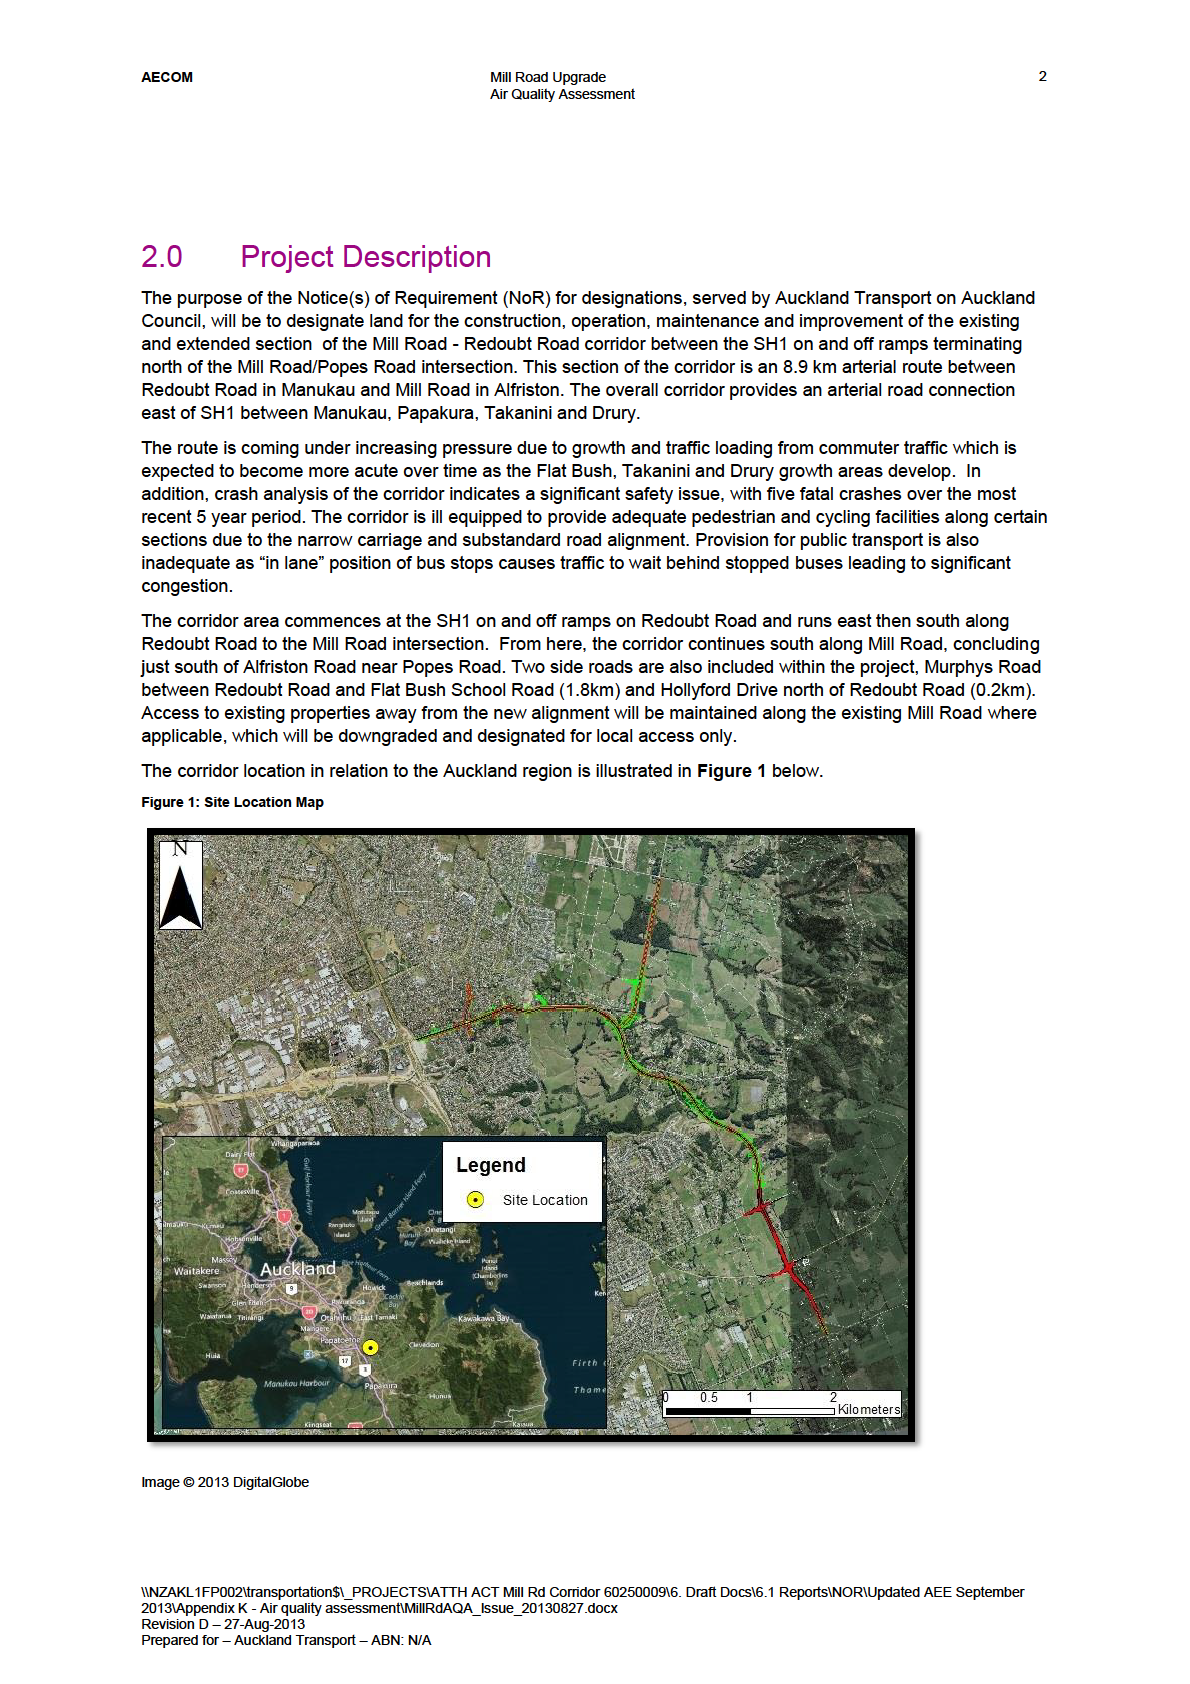
Redoubt Road to Mill Road corridor upgrade as part of the Assessment of Environmental Effects to support the
Notice of Requirement for designation(s).
This section of the corridor is an 8.9 km arterial route between Redoubt Road in Manukau and Mill Road in
Alfriston, 20 kilometres south east of Auckland’s Central Business District. The overall corridor provides an arterial
road connection east of SH1 between Manukau, Papakura, Takanini and Drury.
The assessment examines the existing air quality in the area, the local meteorology and terrain and then
considers the likely effect on air quality as a result of emissions during the construction and operational phases of
the upgrade.
Local air quality monitoring data collected by New Zealand Transport Agency (NZTA) indicate that NO2 annual
mean pol utant concentrations in the vicinity of the corridor are below the Auckland Regional Target. No
continuous monitoring of pollutants is conducted in the vicinity of the corridor. All of the background
concentrations used in the assessment are below the relevant National Ambient Air Quality Standards and
Regional Targets, with the exception of the default Auckland background 24-hour PM2 5 mean used, which does
exceed the Auckland Regional Standard.
During construction, the main potential impact would be expected to be from emissions of dust. If released in
sufficient quantities, given the proximity of existing sensitive residential receptors to the corridor, this could result
in a nuisance from soiling and also have potential health implications if not properly managed. Construction
effects however would be controlled as far as possible through the implementation of best practise construction
methods and the adoption of mitigation measures through a contractor’s Construction Environmental
Management Plan (CEMP), together with a Construction Dust Management Plan (CDMP) / Construction Air
Quality Management Plan (CAQMP), including specific objectives and measures developed by Ministry for the
Environment and the NZTA to ensure compliance with the relevant Standards and therefore limit residual
impacts.
Atmospheric dispersion model ing has been undertaken using AUSROADS, to assess the impact of the
operational changes in vehicle emissions both with and without the ful upgrade in the modelled opening year of
2026 and 15 years from opening (2041). The meteorological data used in the modelling were supplied by
Auckland Council for the worst-case years of 2005 and 2007 and no future improvement in background pollutant
concentrations was assumed. The pollutants assessed were the principle transport-related pollutants listed in the
National Environmental Standards for Ambient Air Quality; namely carbon monoxide (CO), nitrogen dioxide (NO2)
and fine particulate matter (PM10). Additional transport related pollutants of fine particulate matter (PM2.5) and
benzene have also been included in the study, which are listed as Auckland Regional Air Quality Targets.
Predicted pol utant concentrations were then forecast at identified worst-case receptor locations along the
corridor.
The forecast concentrations indicate that all National Ambient Air Quality Standards for the modelled pollutants
will be met at all worst-case receptor locations and in al future assessment years. In addition, al Auckland
Regional Targets with the exception of 24-hour mean PM2.5 concentrations are also predicted to be met at al
locations and in all assessment years and the predicted levels of impact are considered to be less than minor.
The predicted PM2.5 exceedances are due to the use of the Auckland default background concentrations. No
mitigation measures have been recommended with regards to the operation of the upgrade.
Overall, impacts on local air quality are considered to be less than minor as a result of the Mill Road upgrade,
during both the construction and operational phases.
\\NZAKL1FP002\transportation$\_PROJECTS\ATTH ACT Mill Rd Corridor 60250009\6. Draft Docs\6.1 Reports\NOR\Updated AEE September
2013\Appendix K - Air quality assessment\MillRdAQA_Issue_20130827.docx
Revision D – 27-Aug-2013
Prepared for – Auckland Transport – ABN: N/A
AECOM
Mill Road Upgrade
1
Air Quality Assessment
1.0
Introduction
AECOM New Zealand Pty Ltd (AECOM) was commissioned by Auckland Transport to undertake an Air Quality
Assessment for the proposed Redoubt Road to Mill Road corridor upgrade, Auckland.
The study corridor is located 20 kilometres south east of Auckland’s Central Business District and is situated in
both the Metropolitan Urban and Rural Boundaries.
The proposal seeks to increase capacity on the increasingly important strategic link in south Auckland due to
significant anticipated growth in traffic generated from development, combined with the corridor’s current
substandard quality and poor safety record.
The report considers and assesses the potential impact at sensitive receptors from the road upgrade against
health-based National and Regional air quality standards and targets. It outlines the current regulatory system
relevant to air quality management, the baseline air quality and meteorological conditions in the area and also the
methodology used to carry out the assessment of the resultant air quality.
Emissions to air are associated with changes in traffic volumes and flow patterns, not only on the Redoubt Road
to Mill Road corridor, but on the wider associated network. During the operation of the corridor upgrade, potential
emissions to air are associated with products of vehicular fuel combustion. The primary pollutants of concern
regarding road transport movement which are listed in the National Environmental Standards for Ambient Air
Quality and have been included in the study are carbon monoxide (CO), nitrogen dioxide (NO2) and fine
particulate matter (PM10). The additional road transport related pol utants of fine particulate matter (PM2.5) and
benzene, have also been included in the study but are listed as Auckland Regional Air Quality Targets. Computer
based dispersion modelling has been used to predict pollutant concentrations for the baseline year of 2011,
together with future 2026 and 2041 operational scenarios, both with and without the proposed full corridor
upgrade in place. The meteorological data used in the modelling were supplied by Auckland Council for the worst-
case years of 2005 and 2007 and no future improvement in background pollutant concentrations was assumed.
The predicted pol utant concentrations have been assessed through comparison of these concentrations with the
regulatory air quality standards and targets at the closest identified receptors. Potential effects during construction
have also been considered and mitigation measures developed to minimise any residual impacts.
\\NZAKL1FP002\transportation$\_PROJECTS\ATTH ACT Mill Rd Corridor 60250009\6. Draft Docs\6.1 Reports\NOR\Updated AEE September
2013\Appendix K - Air quality assessment\MillRdAQA_Issue_20130827.docx
Revision D – 27-Aug-2013
Prepared for – Auckland Transport – ABN: N/A
AECOM
Mill Road Upgrade
3
Air Quality Assessment
3.0
Methodology
The main elements of the proposed corridor upgrade relevant to air quality are emissions from the fol owing
sources:
Construction activities, including construction related traffic; and
Changes in the number of vehicles and patterns of travel during the operational phase, on both the
directly affected Redoubt Rd to Mill Road corridor, together with the wider in-directly associated network.
3.1
Approach to Assessment of Effects
The air quality impact assessment has been conducted in-line with the Ministry for the Environment’s
Good
Practice Guide for Assessing Discharges to Air from Land Transport1 and
Good Practice Guide for Atmospheric
Dispersion Modelling2, together with the New Zealand Transport Agency’s (NZTA) draft air quality effects guide3
to ensure a consistent and robust assessment approach.
This air quality impact assessment therefore comprises:
-
A review of the legislative framework surrounding air quality;
-
A review of the existing baseline environment;
-
Assessment of the potential changes in air quality arising from the construction and operation of the
corridor upgrade (inclusive of cumulative traffic effects);
-
Formulation of mitigation measures, where appropriate, to ensure that any potential adverse impacts on
air quality are minimised; and,
-
Identification of likely residual effects, following application of the outlined mitigation measures.
3.1.1
Assessment Overview
The assessment process for land transport in New Zealand utilises a three-tiered approach, based on increasing
levels of scrutiny as the project develops. The level of detail required for each study is also determined by the
perceived level of risk posed to air quality, based on set criteria. The three tiers of assessment are summarised as
follows:
-
Tier 1 Assessment – High level review of potential impacts and existing environment, to identify any risks
early in the project process.
-
Tier 2 Assessment – Conservative screening assessment using published default data to understand the
potential magnitude of impact. A simple screening tool4 has been developed by NZTA to predict
concentrations based on vehicle link flow data, composition and distances to the closest sensitive
receptors.
-
Tier 3 Assessment – Detailed assessment using dispersion modelling, incorporating emissions
parameters, complex traffic model ing, site specific meteorological and background data where
appropriate.
A checklist process for each Tier is available within the guidance documents however
Table 1 details the initial
risk rating matrix conducted for Tier 1 of the study. A risk classification is then given based on whether two or
more positive results are achieved within a certain rating.
Table 2 also details the significance criteria from NZTA
which the risk rating exceedance score is based upon.
1 MfE, 2008.
Good Practice Guide for Assessing Discharges to Air from Land Transport. New Zealand Ministry for the
Environment, June 2008.
2 MfE, 2004.
Good Practice Guide for Atmospheric Dispersion Modelling. New Zealand Ministry for the Environment, June 2004.
3 NZTA, 2012.
Draft Guide to assessing air quality effects for state highway asset improvement projects. Version 0.6, New
Zealand Transport Agency, September 2012
4 NZTA, 2012.
State highway project – tier 2 air quality screening tool. Available at www.air.nzta.govt.nz. New Zealand
Transport Agency, September 2012
\\NZAKL1FP002\transportation$\_PROJECTS\ATTH ACT Mill Rd Corridor 60250009\6. Draft Docs\6.1 Reports\NOR\Updated AEE September
2013\Appendix K - Air quality assessment\MillRdAQA_Issue_20130827.docx
Revision D – 27-Aug-2013
Prepared for – Auckland Transport – ABN: N/A
AECOM
Mill Road Upgrade
4
Air Quality Assessment
Table 1: NZTA Tier 1 Risk Ratings
Individual rating
NO2 or PM10 exceeded?
No. sensitive land uses
Annual Average Daily Traffic
(AADT) – Opening Year
Low (L)
No
<10
<10,000
Medium (M)
Yes
10 – 50
10,000 – 50,000
High (H)
Yes
>50
>50,000
Table 2: NZTA Air Quality Significance Criteria
Pollutant
Limit
Averaging time
Significance criteria
PM10
50 µg/m3
24-hour
2.5 µg/m3
PM2.5
25 µg/m3
24-hour
1.25 µg/m3
NO2
40 µg/m3
Annual
2.0 µg/m3
Note – results to be determined using the Tier 2 Screening Tool
For projects identified as being low risk, a Tier 1 assessment is typical y considered to be sufficient for reporting.
Projects scoring ‘medium’ or ‘high risk’ ratings must automatically undergo Tier 2 or Tier 3 assessments
depending on the potential level of impacts significance.
This tiered approach has therefore been used for this assessment and the following points are noted:
-
The western end of Redoubt Road (approximately 1.2 kilometres) is located within a designated Urban
Air Quality Management Area;
-
No tunnels >90 metres in length are proposed;
-
> 50 high sensitivity air pol ution land uses (HSAPLU) are identified within 200 metres of the corridor;
-
Traffic volumes along the Redoubt Road to Mill Road corridor in the year of opening are projected to be
in the order of 10,000 – 50,000 AADT;
-
The Tier 2 screening assessment for the proposed upgrade identified that whilst 24 hour mean PM10 and
PM2 5 predicted concentrations do not exceed the stated significance criteria, predicted annual average
NO2 concentrations do exceed the stated criteria on a number of roads on the corridor in the proposed
opening year.
As a result of this process and using the criteria in
Table 1 it is considered that this assessment report therefore
represents a ‘high risk’ Tier 3 assessment, as two of the three outlined criteria are met.
3.1.2
Review of Existing Environment
The existing environment has been reviewed through data and tools available from Auckland Council, the New
Zealand Transport Agency (NZTA) and New Zealand's National Climate Database (NIWA). More information on
the data used in this assessment is detailed in
Section 5.0.
No project specific air quality monitoring has been undertaken as part of the assessment and none is proposed as
we do not consider it to be necessary at this stage in the project. This is due to the large amount of available
background data in the general area which is considered sufficient to characterise the existing air quality
conditions.
3.1.3
Consultation
Consultation with the Air Quality Policy Team Leader at Auckland Council was conducted in July 2013, where the
Tier 3 assessment methodology and choice of dispersion model was discussed and agreed in principle5.
The current New Zealand specific vehicle emission factor database model was subsequently provided by
Auckland Council for the assessment, together with representative meteorological data files and Auckland
Council’s background monitoring data for use in the assessment.
5 Record of telephone conversation between John Hodgson and Janet Petersen on 26th July 2013
\\NZAKL1FP002\transportation$\_PROJECTS\ATTH ACT Mill Rd Corridor 60250009\6. Draft Docs\6.1 Reports\NOR\Updated AEE September
2013\Appendix K - Air quality assessment\MillRdAQA_Issue_20130827.docx
Revision D – 27-Aug-2013
Prepared for – Auckland Transport – ABN: N/A
AECOM
Mill Road Upgrade
5
Air Quality Assessment
3.1.4
Assessment of Construction Effects
During construction, the potential sources of emissions (for example, dust, exhaust and odour emissions) are as
follows:
-
those arising from construction traffic accessing the designated construction site(s).
-
those arising from the construction activities themselves (site plant/vehicles and earth moving operations,
etcetera)
-
those arising from vehicle emissions caused by necessary road diversions.
Given the inherent uncertainty surrounding potential construction impacts, due to the temporal nature and
duration of works and opportunities for a contractor to refine design and construction methods, the construction
effects have therefore been assessed through a qualitative review of potential sources of air emissions. This has
been based on the project description, detailed alignment plans and understood best practice construction
methods.
The
6
Good Practice guide for assessing and managing the environmental effects of dust emissions , prepared by
the Ministry for the Environment has been used in this assessment as it serves as a useful document to help
assess the potential construction impacts of the project. It also provides a series of recommendations and control
methods to be included within a Construction Dust Management Plan (CDMP) or Construction Air Quality
Management Plan (CAQMP) to minimise impacts. There are also no national air quality guidelines for nuisance
dust impacts, however the document outlines commonly used criteria and ‘trigger levels’ based on observational
data which should be specified.
The assessment has therefore taken into account the proximity and number of receptors (and their sensitivity) in
the vicinity of the corridor upgrade and likely construction activities areas (such as work sites and construction lay
down areas). In addition, the duration of activities and the local meteorological conditions have also been
considered in the assessment. The guidance note acknowledges the use of air dispersion model ing to assess
potential impacts in certain circumstances; however it adds that given the level of uncertainty during construction,
the priority of the assessment should be given to specifying and employing best practice measures to control
potential releases.
Recommendations for mitigation and control measures, to be included within a formal CDMP / CAQMP have been
made as part of the assessment and are detailed in
Section 9.1.
3.1.5
Assessment of Operational Effects
In order assess the potential impact of the project proposals on local air quality, in-line with the Tier 3 assessment
approach identified in
Section 3.1.1, estimated emissions of the pollutants are required within the computer-
based dispersion model. The primary air pollutants of concern regarding road transport movement which are
listed in the National Environmental Standards for Ambient Air Quality and have been included in the study are
carbon monoxide (CO), nitrogen dioxide (NO2) and fine particulate matter (PM10). The additional road transport
related pollutants of fine particulate matter (PM2 5) and benzene (as volatile organic compounds (VOCs)), have
also been included in the study but are listed as Auckland Regional Air Quality Targets. Predicted concentrations
of these pol utants, at the identified worst case receptors will be compared with associated air quality standards
and targets.
The primary factors that influence emissions from vehicles include the mode and speed of travel, the grade of the
road and the mix, type and age of the vehicles. The general approach to derive total pol utant emission rates from
a road section is simply to multiply the total number of vehicles on the road section by the pollutant emission per
vehicle (the emission factor).
Pollutant emission rates have been calculated using traffic model ing data supplied by AECOM transport and
Auckland Transport for a number of future scenarios, together with emission factors taken from NZTA’s Vehicle
Emissions Prediction Model (VEPM 5.1), provided for the assessment by Auckland Council.
Pollutant concentrations have been forecast for the following scenarios:
-
The baseline (existing) traffic scenario of 2011;
6 MfE, 2001.
Good Practice guide for assessing and managing the environmental effects of dust emissions. New Zealand
Ministry for the Environment, September 2001.
\\NZAKL1FP002\transportation$\_PROJECTS\ATTH ACT Mill Rd Corridor 60250009\6. Draft Docs\6.1 Reports\NOR\Updated AEE September
2013\Appendix K - Air quality assessment\MillRdAQA_Issue_20130827.docx
Revision D – 27-Aug-2013
Prepared for – Auckland Transport – ABN: N/A
AECOM
Mill Road Upgrade
6
Air Quality Assessment
-
The 2026 ‘Do Minimum’ scenario (DM2026) in the modelled year of opening without the complete
upgrade in place;
-
The 2026 ‘Do Something’ option scenario (DS2026) in the model ed year of opening with the complete
operational upgrade in place;
-
The 2041 ‘Do Minimum’ scenario (DM2041) 15 years following the modelled year of opening without the
complete upgrade in place; and,
-
The 2041 ‘Do Something’ option scenario (DS2041) 15 years fol owing the modelled year of opening with
the complete operational upgrade in place.
It is understood that the western urban section of the corridor may be constructed and in operation by 2020,
however with the remaining entire corridor unlikely to be operational until 2034. Since the traffic model ing and air
quality assessment have been based on a fully operational corridor by 2026, whilst six years later than the
potential initial section opening year, it is considered that the increase in vehicle numbers used in the assessment
based on the complete corridor upgrade stil represents a worst-case assessment of the potential impacts to air
quality, when compared to the reduction in vehicle emission factors in later years.
All future year traffic modelling data is inclusive of predicted growth in the Auckland Plan, draft Unitary Plan,
Drury, Takanini and Flatbush plan changes, in terms of cumulative impacts.
The level of impact from the upgrade proposals can be determined by comparing the predicted impact in the
future years with the upgrade in place, against the same year without the road upgrade. The results of the
dispersion modelling and the potential impact of the road upgrade during operation, incorporating existing air
quality background concentrations, have been compared to the appropriate standards and targets detailed in
Section 4.0.
\\NZAKL1FP002\transportation$\_PROJECTS\ATTH ACT Mill Rd Corridor 60250009\6. Draft Docs\6.1 Reports\NOR\Updated AEE September
2013\Appendix K - Air quality assessment\MillRdAQA_Issue_20130827.docx
Revision D – 27-Aug-2013
Prepared for – Auckland Transport – ABN: N/A
AECOM
Mill Road Upgrade
7
Air Quality Assessment
4.0
Assessment Matters
In assessing any project with potential emissions to air, it is necessary to compare the impacts of the project with
relevant air quality criteria. Air quality standards and targets and potential changes to them are used to assess the
potential for ambient air quality to give rise to adverse health or nuisance effects.
The Minister for the Environment is responsible for recommending national environmental standards for the
protection of health for al New Zealanders. In turn, regional councils and unitary authorities are then responsible
for ensuring that these national standards are met in their regions and how air quality is managed. The Ministry for
the Environment serves as a liaison between the parties and publishes guidance seeking to assist the regions
with their duties. The New Zealand regulatory and policy framework includes the National environmental
standards for air quality, National ambient air quality guidelines and objectives and policies in regional plans
4.1
National Planning Policy
The primary national legislation which al air quality policy stems from is the Resource Management Act 1991
(RMA).
4.1.1
Resource Management Act 1991
Air quality management is governed by the RMA. Whilst no air quality standards are specifically contained within
the RMA (these are detailed in associated regulations noted below), the Act provides overall direction for the
national and regional statutory regulations control ed by a number of agencies. Section 5 of the RMA 1991 states
that:
“(1) The purpose of the Act is to promote the sustainable management of natural and physical
resources.”
(2) In this Act, sustainable management means managing the use, development, and protection of
natural and physical resources in a way, or at a rate, which enables people and communities to provide
for their social, economic, and cultural well-being and for their health and safety while—
(a) sustaining the potential of natural and physical resources (excluding minerals) to meet the
reasonably foreseeable needs of future generations; and
(b) safeguarding the life-supporting capacity of air, water, soil, and ecosystems; and
(c) avoiding, remedying, or mitigating any adverse effects of activities on the environment”
Conditions surrounding the discharge of contaminants into the environment, which may ultimately affect air
quality, are however expressed in Section 15 of the RMA, which states:
“(1) No person may discharge any—
(c) contaminant from any industrial or trade premises into air; or
unless the discharge is expressly allowed by a national environmental standard or other
regulations, a rule in a regional plan as well as a rule in a proposed regional plan for the same
region (if there is one), or a resource consent.
(2) No person may discharge a contaminant into the air, or into or onto land, from a place or any other
source, whether moveable or not, in a manner that contravenes a national environmental standard
unless the discharge—
(a) is expressly allowed by other regulations; or
(b) is expressly allowed by a resource consent; or
(c) is an activity allowed by section 20A.
(2A) No person may discharge a contaminant into the air, or into or onto land, from a place or any other
source, whether moveable or not, in a manner that contravenes a regional rule unless the discharge—
(a) is expressly allowed by a national environmental standard or other regulations; or
(b) is expressly allowed by a resource consent; or
\\NZAKL1FP002\transportation$\_PROJECTS\ATTH ACT Mill Rd Corridor 60250009\6. Draft Docs\6.1 Reports\NOR\Updated AEE September
2013\Appendix K - Air quality assessment\MillRdAQA_Issue_20130827.docx
Revision D – 27-Aug-2013
Prepared for – Auckland Transport – ABN: N/A
AECOM
Mill Road Upgrade
8
Air Quality Assessment
(c) is an activity allowed by section 20A.
Whilst transport infrastructure upgrade projects typically do not require discharge consents under the RMA
(unless including for example, tunnel ventilation stacks), the conditions give an insight into the subsequent
development of the Resource Management (National Environmental Standards for Air Quality) Regulations 2004,
in terms of ‘
safeguarding the life-supporting capacity of air’, The RMA discharge conditions could however be
interpreted to cover potential construction phase impacts such as off-site dust or plant emissions and have
therefore been included for completeness.
4.1.2
Land Transport Management Act
The Land Transport Management Act 2003 (LTMA), amended 2013, sets out the framework to operate, manage
and fund New Zealand’s transport network. One of the operating principles for the Auckland Transport in meeting
its objectives and functions, is the expectation that it “
exhibits a sense of social and environmental responsibility” in meeting the statutory objective of operating a network that contributes to an integrated, safe, responsive and
sustainable land transport system.
4.1.3
Air Quality Standards and Guidelines
The National Environmental Standards for Ambient Air Quality are mandatory regulations, first introduced within
the Resource Management (National Environmental Standards for Air Quality) Regulations 2004, under the
Resource Management Act 1991. These regulations were subsequently amended in 2011.
Ambient air quality standards are listed within Schedule 1 of the amended 2011 Regulations and must not be
exceeded unless for a stated permitted activity. The Standards, provided for varying pol utants and averaging
periods, apply at any place in the open air where people may be exposed to pollutants for the quoted period of
time (general y greater than one hour).
Locations where the standards are considered to apply include roadside verges, residential areas, central
business districts, parks and beaches. Locations where the standards do not apply include inside houses,
vehicles and tunnels. The National Environmental Standards for Ambient Air Quality are detailed below in
Table
3.
Further details on the selection criteria for receptors are given in
Section 8.1.
Table 3:
National Environmental Standards for Ambient Air Quality
Contaminant
Averaging period
Threshold concentration
Number of exceedances
allowed
Carbon monoxide (CO)
8-hour mean
10 mg/m3
1
Nitrogen dioxide (NO2)
1-hour mean
200 µg/m3
9
Ozone (O3)
1-hour mean
150 µg/m3
0
Fine particulate matter (PM10) 24-hour mean
50 µg/m3
1
Sulphur dioxide (SO2)
1-hour mean (maximum)
570 µg/m3
9
1-hour mean
350 µg/m3
0
With regards to dust impacts during construction of the upgrade, a series of trigger levels are specified within the
Ministry for the Environment’s 2001
Good practice guide6, as there are no national air quality guidelines for
assessing nuisance dust impacts. In this absence, recommended trigger levels for deposited and suspended
insoluble particulates to be included with a formal CDMP / CAQMP, together with example areas of applicability,
are detailed below in
Table 4.
\\NZAKL1FP002\transportation$\_PROJECTS\ATTH ACT Mill Rd Corridor 60250009\6. Draft Docs\6.1 Reports\NOR\Updated AEE September
2013\Appendix K - Air quality assessment\MillRdAQA_Issue_20130827.docx
Revision D – 27-Aug-2013
Prepared for – Auckland Transport – ABN: N/A
AECOM
Mill Road Upgrade
9
Air Quality Assessment
Table 4: Recommended Dust Trigger Levels
Dust type
Trigger level
Averaging times
Example locations
Deposited dust
4 g/m2/day
30-day average
Above background levels
Total suspended particulates
80 µg/m3
24-hour
Sensitive areas
100 µg/m3
24-hour
Moderate sensitivity areas
120 µg/m3
24-hour
Insensitive areas
Note – Sensi ive areas in this instance are classified as being locations with a large number of residential properties and typically apply at the
property boundary.
4.2
Regional Planning Policy
As regional plans are statutory instruments under the RMA; where air quality standards are more stringent than
those set in the National Standards quoted above, the regional standards apply. The National Standards however
must be complied with throughout New Zealand.
Auckland Council has prepared Regional Air Quality Targets contained within the Auckland Regional Plan: Air,
Land and Water 2012, using the key pollutants identified within the National environmental standards for air
quality, however setting standards for additional averaging periods and pollutants specific for the region. The
primary difference with the Auckland Regional Targets is that they do not contain al owable exceedances. The
Auckland Regional Air Quality Targets for the pol utants of concern within this study are detailed below in
Table 5.
Table 5: Auckland Regional Air Quality Targets
Contaminant
Target
Averaging Time
Fine particulate matter (PM10)
20 µg/m3
Annual
Fine particulate matter (PM2.5)
25 µg/m3
24-hour
10 µg/m3
Annual
Nitrogen dioxide (NO2)
100 µg/m3
24-hour
40 µg/m3
Annual
Carbon monoxide (CO)
30 mg/m3
1-hour
Sulphur dioxide (SO2)
120 µg/m3
24-hour
Ozone (O3)
100 µg/m3
8-hour
Benzene
3.6 µg/m3
Annual
Through extensive ambient air quality monitoring, Auckland Council has designated a number of airsheds in the
Auckland region where air quality is known, or considered likely, to exceed the air quality standards now or in the
future. The Air Quality Management Areas are designated as Urban, Industrial and Rural. The urban airshed
(Urban Air Quality Management Area) covers most of urban Auckland7 and approximately 1.3km of the western
end of the proposed corridor. The remainder of the corridor falls under the rural airshed.
The most pertinent air quality policy within the Auckland Regional Plan with regards to the Mill Road upgrade is
contained within Policy 4.4.16 Mobile Sources, which states: -
“Any land use proposals with transportation effects, and any new transport projects or proposals for
redeveloping transport infrastructure which have the potential to adversely affect air quality, should be
assessed at a level considered appropriate for the size and scale of the project or proposal, and shall
consider the following:
(a) Effects on human health;
(b) Effects on regional and local air quality; and
7 Auckland Council, 2010.
Chapter 4.1 Air, State of the Auckland Region report, Auckland Council, March 2010
\\NZAKL1FP002\transportation$\_PROJECTS\ATTH ACT Mill Rd Corridor 60250009\6. Draft Docs\6.1 Reports\NOR\Updated AEE September
2013\Appendix K - Air quality assessment\MillRdAQA_Issue_20130827.docx
Revision D – 27-Aug-2013
Prepared for – Auckland Transport – ABN: N/A
AECOM
Mill Road Upgrade
10
Air Quality Assessment
(c) Any alternatives or methods to mitigate effects on air quality or minimise the discharge of
contaminants into air.”
The Regional Plan also contains policies regarding the wider permitted release of contaminants to the air,
particularly relevant to the upgrade during construction, fol owing the conditions stated within the RMA.
Rule 4.5.1 of the document states: -
“Unless provided for otherwise in this plan, activities that discharge contaminants into air are Permitted
Activities, subject to the following conditions:
(a) That beyond the boundary of the premises where the activity is being undertaken there shall be no
noxious, dangerous, offensive or objectionable odour, dust, particulate, smoke or ash; and
(b) That there shall be no noxious, dangerous, offensive or objectionable visible emissions; and
(c) That beyond the boundary of the premises where the activity is being undertaken there shall be no
discharge into air of hazardous air pollutants that does, or is likely to, cause adverse effects on human
health, ecosystems or property.”
Given the proximity of the existing sensitive receptors to the corridor, construction impacts therefore need to be
managed appropriately so as not to be in breach of the Rules set out above. Recommended mitigation measures
to be employed by the appointed site contractor to minimise any potential impacts are highlighted and discussed
in
Section 9.1.
To add to the air quality policies listed above in the Regional Plan, with regard to the assessment of transport
projects and the discharge of contaminants to air, Policy 4.5.3 Mobile Sources – Permitted Activities, provides
further clarification on the matter, stating that: -
“
The discharge of contaminants into air created by motor vehicle, aircraft, train, vessel and lawnmower
engines including those located on industrial or trade premises is a Permitted Activity.”
\\NZAKL1FP002\transportation$\_PROJECTS\ATTH ACT Mill Rd Corridor 60250009\6. Draft Docs\6.1 Reports\NOR\Updated AEE September
2013\Appendix K - Air quality assessment\MillRdAQA_Issue_20130827.docx
Revision D – 27-Aug-2013
Prepared for – Auckland Transport – ABN: N/A
AECOM
Mill Road Upgrade
11
Air Quality Assessment
5.0
Existing Environment
The major factors of the existing environment that can influence the level of air pol utants adjacent to a particular
site and at sensitive receptors include:
-
The presence of private, commercial and industrial facilities / sources that can emit similar air pollutants
to those being assessed,
-
Meteorological conditions and terrain features; and,
-
Existing air quality due to regional sources of air pollution.
The following section describes the existing air quality, general meteorology and terrain of the study area.
5.1
Land use and Topography
The Redoubt Road to Mill Road upgrade corridor, given its approximate length of 13 kilometres and geographic
location 20 kilometres south east of Auckland’s Central Business District, is situated within both the Metropolitan
Urban and Rural land use Boundaries. The land use can therefore be classified as a mix of both urban low-rise
residential at the initial western end, with the remaining corridor (including Murphys Road) classified as rural
residential, park and agricultural land.
The topography of the surrounding environment consists of gentle rolling hills as the corridor navigates around the
central Totara Park, rising to 120 metres above sea level (ASL) at its peak, from a height of 60 metres ASL to the
west as it approaches the State Southern Highway 1 and from 24 metres ASL at the southern end in Alfriston.
The gradient of the road may increase vehicle emissions traveling up hil (the benefit of downhil emissions are
typical y not cancel ed out) and therefore the effect of gradients has been taken into account within the emissions
modelling and rate determination for the dispersion model ing.
Due to the width of the existing and proposed corridor and the relatively open non-industrial atmosphere, together
with the absence of
‘street canyons’8, the dispersion of pollutants from vehicles would not be considered to be
negatively affected by the terrain and therefore the direct effects of terrain through a terrain data model ing file
have not been used in the assessment. This is an industry standard approach.
5.2
Receptor Locations
Sensitive receptor locations are those individuals and communities who are likely to be susceptible to changes in
air quality, such as an increase in air emissions. These receptors include locations where people spend extended
periods of time, typically greater than one hour (sufficient to meet ambient air quality criteria averaging periods).
Receptors sensitive to the construction (in particular, dust and combustion emissions) and operational air
emissions from the project include schools, hospitals, childcare facilities, educational facilities, residential areas
and sporting / recreational facilities (often people engaging in sporting activities have increased respiratory stress
and are therefore more sensitive to air pol ution).
Receptor locations have been selected where exposure to atmospheric emissions from traffic is potential y the
greatest. Pollutant concentrations decrease significantly with distance from a road source and, provided there are
no other major sources in the vicinity, concentrations are lower at locations located further away from the
receptors chosen. Therefore, all selected receptors are locations in closest proximity to the roads most affected.
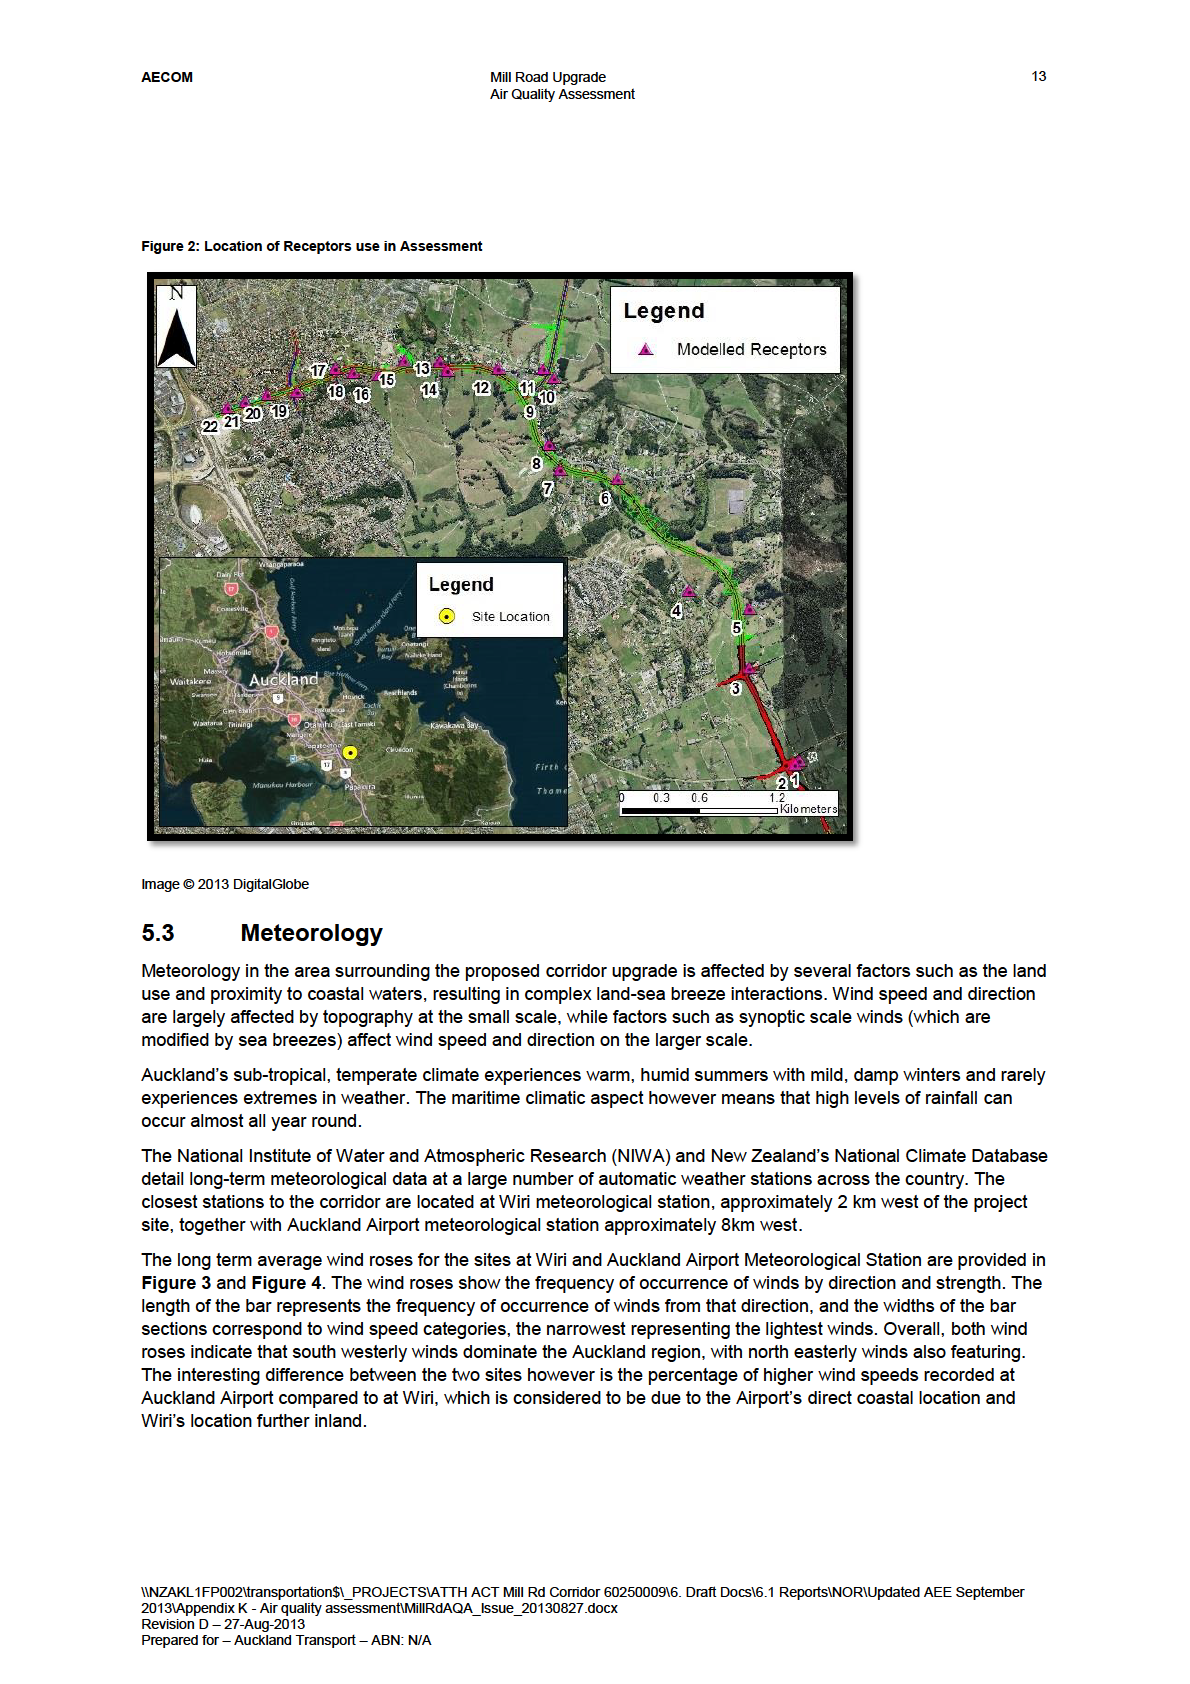
Table 6 details
the most affected sensitive receptors in the study area, with regards to air quality, along the route
corridor and other affected roads which have been considered for the air quality assessment. The receptors
identified, the majority of which are residential properties, are considered to be representative of the worst case
exposure in those particular locations, at distances up to 200 metres from the centre line of the proposed
alignment. The receptor locations are also il ustrated in
Figure 2.
8 A term used to describe a location where the width of a road is less than the height of the buildings bordering it, resulting in the
flow of air being dominated by vehicle induced turbulence due to the poor natural dispersal of pollutants.
\\NZAKL1FP002\transportation$\_PROJECTS\ATTH ACT Mill Rd Corridor 60250009\6. Draft Docs\6.1 Reports\NOR\Updated AEE September
2013\Appendix K - Air quality assessment\MillRdAQA_Issue_20130827.docx
Revision D – 27-Aug-2013
Prepared for – Auckland Transport – ABN: N/A
AECOM
Mill Road Upgrade
12
Air Quality Assessment
Table 6: Sensitive Receptor Locations
Receptor
Receptor Location
Receptor Type
Receptor Coordinates (UTM Zone 60S)
Reference
x
Y
R1
Cnr of Mill Road and Alfriston Road
Residential
316710
5901280
R2
Alfriston School, Mill Road
School
316672
5901250
R3
Cnr of Mill Road and Ranfurly Road
Residential
316319
5901996
R4
5 Polo Prince Road
Residential
315857
5902596
R5
182 Mill Road
Residential
316324
5902462
R6
361 Redoubt Road
Residential
315301
5903466
R7
323 Redoubt Road
Residential
314850
5903540
R8
280 Redoubt Road
Residential
314764
5903732
R9
246 Redoubt Road
Residential
314715
5904140
R10
51 Murphys Road
Residential
314801
5904251
R11
34 Murphys Road
Residential
314722
5904325
R12
208 Redoubt Road
Residential
314373
5904324
R13
170 Redoubt Road
Residential
313917
5904372
R14
189 Redoubt Road
Residential
313973
5904309
R15
156 Redoubt Road
Residential
313640
5904389
R16
141 Redoubt Road
Residential
313443
5904276
R17
1 Santa Monica Place
Residential
313107
5904321
R18
12 Elsted Place
Residential
313244
5904295
R19
2 Everglade Drive
Residential
312808
5904147
R20
38 Redoubt Road
Residential
312575
5904123
R21
22 Redoubt Road
Residential
312403
5904067
R22
12 Redoubt Road
Residential
312268
5904022
Note – Receptor addresses have been iden ified from Project alignment drawings and plans
\\NZAKL1FP002\transportation$\_PROJECTS\ATTH ACT Mill Rd Corridor 60250009\6. Draft Docs\6.1 Reports\NOR\Updated AEE September
2013\Appendix K - Air quality assessment\MillRdAQA_Issue_20130827.docx
Revision D – 27-Aug-2013
Prepared for – Auckland Transport – ABN: N/A
 AECOM
AECOM
Mill Road Upgrade
14
Air Quality Assessment
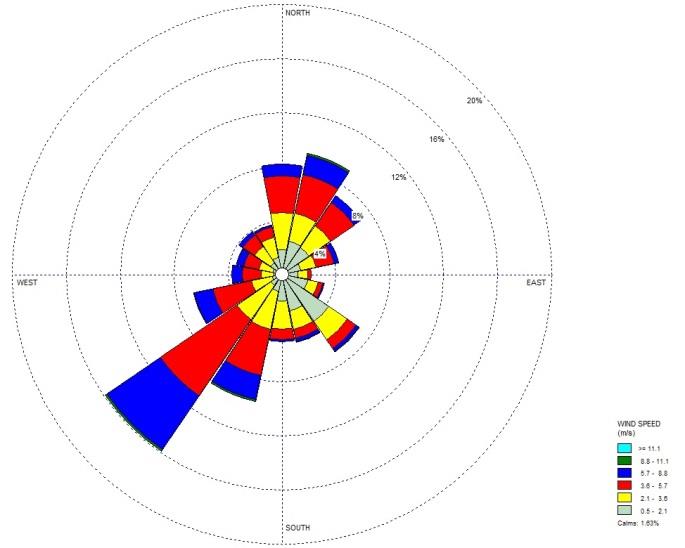
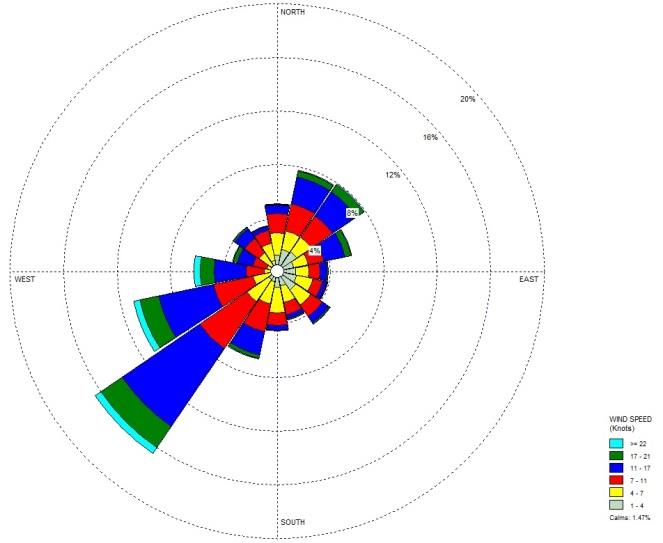
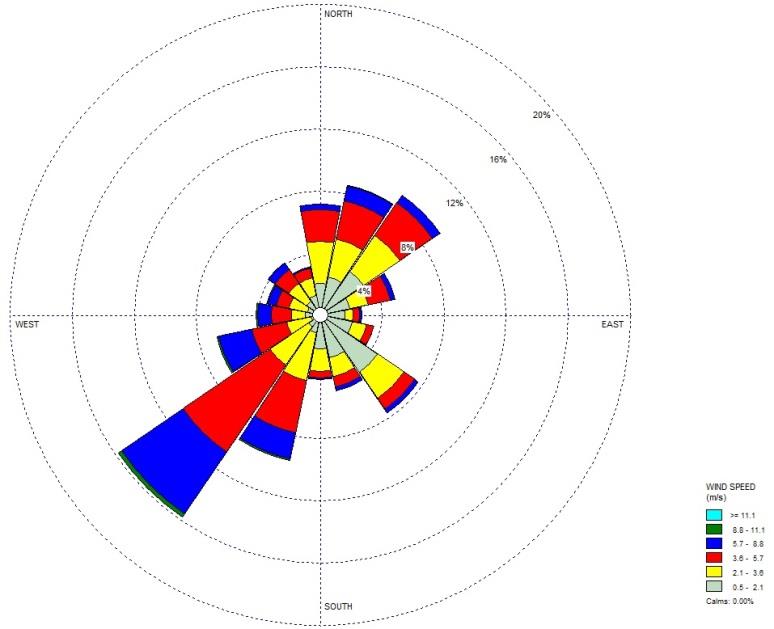
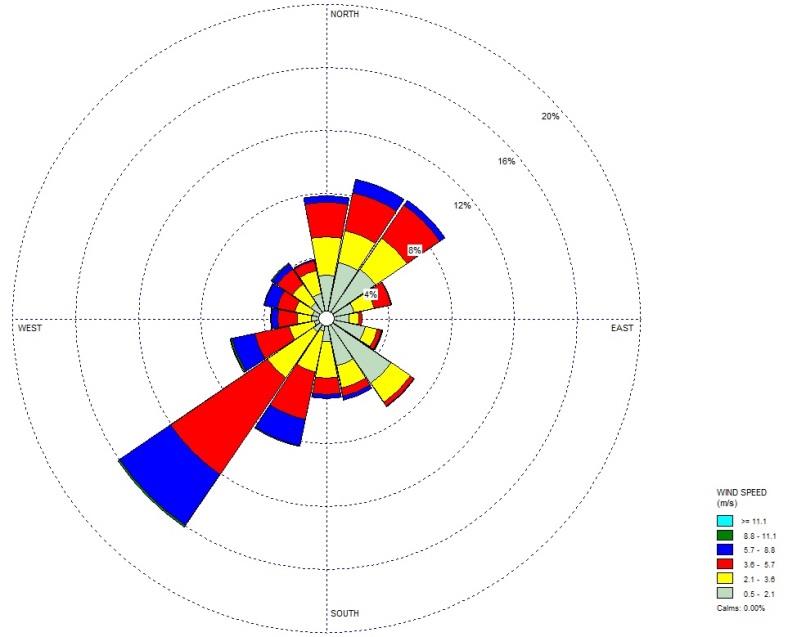
Figure 3: Wiri Meteorological Station Wind Roses 2008–2012 Figure 4: Auckland Airport Meteorological Station Wind Roses 2008–2012
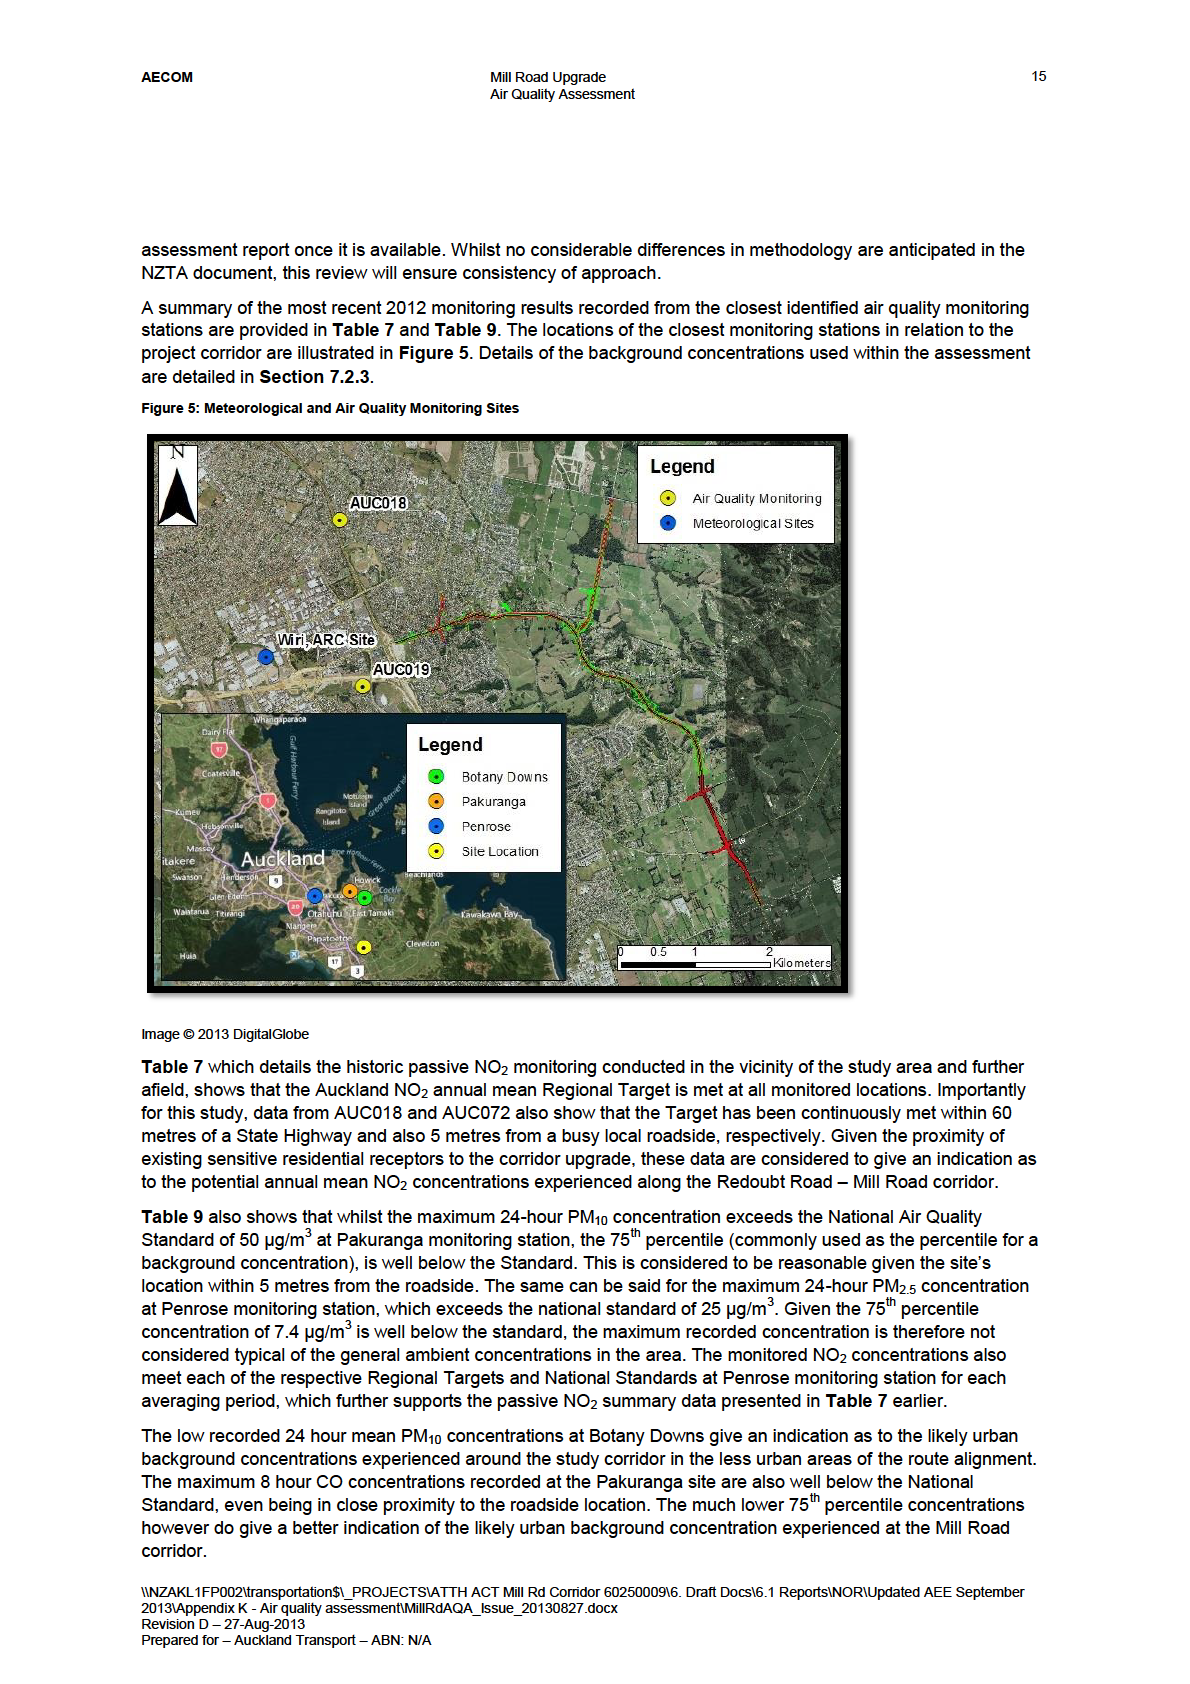
The location of the Wiri Meteorological Station, which is the closest station to the corridor and has been used in
this assessment (see
Section 7.2.2), is il ustrated in
Figure 5.
5.4
Background Ambient Air Quality
Air quality at sensitive receptor locations generally depends on the proximity to roads and industry. For receptors
close to main roads during peak hours, vehicle emissions will be the primary source of air pollution. Air quality at
locations more than 500 metres from major existing roads will tend to be dominated by other local activities (e.g.
industrial sources) or by the mix of regional air pol utant sources.
Auckland Council and the New Zealand Transport Agency (NZTA) operate an extensive network of continuous
and non-continuous air quality monitoring stations across the Auckland region. The network ensures compliance
with the Auckland air quality targets and National air quality standards is measured across a broad area. Auckland
Council currently operate 15 continuous monitoring stations across the Auckland region, however none are
located near to the road corridor. NZTA detail the locations and results of their passive diffusion tube network
monitoring programme within their annual report9, of which two roadside sites are located 700 metres and 1700
metres to the southwest and northwest, respectively.
Auckland Council’s draft
Use of Background Air Quality Data in Resource Consent Applications10 document has
been prepared to provide guidance for both applicants and assessors alike in how to incorporate background
pollutant concentrations, to ensure consistency within assessments. Whilst an industrial source and assessment
focussed document, it does contain details on how to appropriately apply continuous monitoring data from the
existing network within transport studies. The document states that for hourly sequential modelling, data from the
roadside Kingsland continuous monitoring station should be used. However, since the document is intended for
industry assessment and within this Tier 3 study we will be explicitly modelling the vehicle emissions component
from the road, using the Kingsland data is considered to result in the double counting of vehicle emissions. The
published urban classification ‘Default Values’, which summarise a number of measured urban sites over a series
of years, have therefore been used to avoid the potential gross estimation of predicted pollutant concentrations at
sensitive receptor locations.
It is acknowledged that at the time of the assessment, the NZTA is preparing a guidance document detailing the
application of default background concentrations for use within roadway assessment. Unfortunately the
assessment was completed prior to this document being formally issued and therefore Auckland Council’s draft
document has been used in its absence. The NZTA guidance document however will be reviewed alongside this
9 NZTA, 2012.
Ambient air quality (nitrogen dioxide) monitoring network – annual report 2007-11. NZ Transport Agency,
September 2012.
10 Metcalfe, J. Wickham, L. and Rolfe, K. (2012).
Draft - Use of Background Air Quality Data in Resource Consent Applications.
Prepared by Emission Impossible Ltd and Kevin Rolfe & Associates Ltd for Auckland Council. Auckland Council Guideline
\\NZAKL1FP002\transportation$\_PROJECTS\ATTH ACT Mill Rd Corridor 60250009\6. Draft Docs\6.1 Reports\NOR\Updated AEE September
2013\Appendix K - Air quality assessment\MillRdAQA_Issue_20130827.docx
Revision D – 27-Aug-2013
Prepared for – Auckland Transport – ABN: N/A
AECOM
Mill Road Upgrade
16
Air Quality Assessment
Table 7: Non-Continuous Ambient Air Quality Monitoring Data – Nitrogen Dioxide Annual Average
Monitoring
Site ID
Location
UTM Zone
Pollutants
Site Type
Receptor
State
Local
Distance
Auckland Air Quality Target = 40 µg/m3
Zone
60S
Distance
Highway
Road
to Site
2008
2009
2010
2011
Coordinates
(m)
Distance
Distance
(m)
(m)
(m)
Auckland -
AUC018
Southern
305434,
NO2
State
20
60
250
1800
26
30.7
30.2
33.1
Southern
Motorway
5905351
diffusion
Highway
/ Waimate
tubes
Street
AUC019
Southern
311774,
NO2
State
10
100
60
750
21.2
19.6
23.0
24.1
Motorway
5903372
diffusion
Highway
/ Liggitt
tubes
Drive
AUC072
Bell
312047,
NO2
Local
5
4320
3
9000
n/a
24.7
24.0
26.1
Reserve /
5913532
diffusion
Pakuranga
tubes
Road
AUC073
Botany
315069,
NO2
Background
10
7040
250
6500
n/a
17.9
13.8
16.5
Downs /
5912074
diffusion
Oakridge
tubes
Way
Table 8: Continuous Monitoring Site Locations in Vicinity of Mill Road
Distance to Site (km)
Monitoring Site
Pollutants Monitored
Site Type
UTM Zone 60S Coordinates
Penrose
NOx, PM10, PM2.5, PM1, TSP/Lead, SO2
State Highway
305381, 5913487
11
Pakuranga
CO, PM10
Local
312042, 5913534
9
Botany Downs
PM10
Background
315062, 5912066
6.5
\\NZAKL1FP002\transportation$\_PROJECTS\ATTH ACT Mill Rd Corridor 60250009\6. Draft Docs\6.1 Reports\NOR\Updated AEE September 2013\Appendix K - Air quality
assessment\MillRdAQA_Issue_20130827.docx
Revision D – 27-Aug-2013
Prepared for – Auckland Transport – ABN: N/A
AECOM
Mill Road Upgrade
17
Air Quality Assessment
Table 9: Continuous Ambient Air Quality Monitoring Concentrations
Pollutant
Averaging Period
2012
Auckland Regional Air
National
Quality Targets
Environmental
Standards for
Ambient Air Quality
Penrose (305381, 5913487)
Nitrogen dioxide (NO2)
1-hour (Maximum)
92.3 µg/m3
1-hour (75h %ile)
28.3 µg/m3
200 µg/m3
1-hour (50th %ile)
16.0 µg/m3
24-hour (Maximum)
49.6 µg/m3
24-hour (75th %ile)
26.0 µg/m3
100 µg/m3
24-hour (50th %ile)
16.7 µg/m3
Annual mean
18.8 µg/m3
40 µg/m3
Fine particulate matter
24-hour (Maximum)
42.8 µg/m3
(PM10)
24-hour (75th %ile)
18.1 µg/m3
50 µg/m3
24-hour (50th %ile)
13.7 µg/m3
Annual mean
14.6 µg/m3
20 µg/m3
Fine particulate matter
24-hour (Maximum)
27.9 µg/m3
(PM2.5)
24-hour (75th %ile)
7.4 µg/m3
25 µg/m3
24-hour (50th %ile)
5.9 µg/m3
Annual mean
6.6 µg/m3
10 µg/m3
Pakuranga (312042, 5913534)
Fine particulate matter
24-hour (Maximum)
57.1 µg/m3
(PM10)
24-hour (75th %ile)
18.8 µg/m3
50 µg/m3
24-hour (50th %ile)
13.8 µg/m3
Annual mean
15.1 µg/m3
20 µg/m3
Carbon monoxide(CO)
8-hour (Maximum)
3.9 mg/m3
8-hour (75th %ile)
0.5 mg/m3
10 mg/m3
8-hour (50th %ile)
0.3 mg/m3
Botany Downs (315062, 5912066)
Fine particulate matter
24-hour (Maximum)
25.1 µg/m3
(PM
50 µg/m3
10)
24-hour (75th %ile)
14.6 µg/m3
24-hour (50th %ile)
10.8 µg/m3
Annual mean
11.4 µg/m3
20 µg/m3
\\NZAKL1FP002\transportation$\_PROJECTS\ATTH ACT Mill Rd Corridor 60250009\6. Draft Docs\6.1 Reports\NOR\Updated AEE September
2013\Appendix K - Air quality assessment\MillRdAQA_Issue_20130827.docx
Revision D – 27-Aug-2013
Prepared for – Auckland Transport – ABN: N/A
AECOM
Mill Road Upgrade
18
Air Quality Assessment
6.0
Traffic Data and Emission Rates
6.1
Traffic Modelling and Data
Traffic data for the corridor upgrade were obtained from AECOM transport for the forecast years of 2026 and
2041, as detailed earlier in
Section 3.1.5. The data consisted of total Annual Average Daily Traffic (AADT) flow
data together with the percentage of heavy duty vehicle (HDV) classes on the local road network. Vehicle speeds
used in the model were also provided by the AECOM Transport team, however professional judgement was also
made with regards to speeds at junctions.
Traffic data were supplied for use into the air dispersion model for the following scenarios: -
-
The baseline (existing) traffic scenario of 2011;
-
The 2026 ‘Do Minimum’ scenario (DM2026) in the modelled year of opening without the complete
upgrade in place;
-
The 2026 ‘Do Something’ option scenario (DS2026) in the model ed year of opening with the complete
operational upgrade;
-
The 2041 ‘Do Minimum’ scenario (DM2041) 15 years after the modelled year of opening without the
complete upgrade in place; and,
-
The 2041 ‘Do Something’ option scenario (DS2041) 15 years after the model ed year of opening with the
complete operational upgrade in place.
It is understood that the western urban section of the corridor may be constructed and in operation by 2020,
however with the remaining entire corridor unlikely to be operational until 2034. Since the traffic model ing and air
quality assessment have been based on a fully operational corridor by 2026, whilst six years later than the
potential initial section opening year, it is considered that the increase in vehicle numbers used in the assessment
based on the complete corridor upgrade stil represents a worst-case assessment of the potential impacts to air
quality, when compared to the reduction in vehicle emission factors in later years.
A total of 20 surrounding roads were modelled in the assessment. A link is a straight-line segment that may
represent an entire road, or a portion of the road that has a break in it (thereby defining a new link segment) due
to the presence of a stoplight, an intersection, a bend in the road, or a significant change in the road gradient. Link
geometry for the existing traffic network and proposed road realignment were also provided by AECOM transport
team for input to the air quality dispersion model.
All future year traffic modelling data is inclusive of predicted growth in the Auckland Plan, draft Unitary Plan,
Drury, Takanini and Flatbush plan changes, in terms of cumulative impacts.
The traffic data used within the assessment are detailed in
Appendix A.
The data assumes that 10% HGVs are present on the State Highway only, with the remaining roads comprising
5% heavy vehicles. Using these values provided by AECOM transport, the vehicle fleet mix has been amended,
taking into account the default fleet composition contained within the NZTA’s emission factor database (discussed
in
Section 6.2).
6.2
Emission Modelling and Rates
In order to assess the potential impact of the corridor upgrade on local air quality, estimated emissions of the
pollutants are required. The pollutants of primary concern for motor vehicles are CO, NOx, VOCs and PM10 and
predicted concentrations of these pollutants, in identified areas will be compared with the National air quality
Standards and Regional Targets. The primary factors that influence emissions from vehicles include the mode
and speed of travel, the grade of the road and the mix, type and age of the vehicles.
Emission factors for this project have been derived based upon the emissions and fleet data within the Vehicle
Emissions Prediction Model (VEPM version 5.1). The Toolkit has been developed by the NZTA and Auckland
Council and comprehensively incorporates updated vehicle exhaust emissions factors for the current New
Zealand vehicle fleet and forecasts emissions up to the year 2040. It is important to ensure the correct
assessment year is selected when calculating emission rates, as emissions are forecast to reduce with time, due
to improvements in vehicle emission control technologies and legislative requirements.
\\NZAKL1FP002\transportation$\_PROJECTS\ATTH ACT Mill Rd Corridor 60250009\6. Draft Docs\6.1 Reports\NOR\Updated AEE September
2013\Appendix K - Air quality assessment\MillRdAQA_Issue_20130827.docx
Revision D – 27-Aug-2013
Prepared for – Auckland Transport – ABN: N/A
AECOM
Mill Road Upgrade
19
Air Quality Assessment
The VEPM database also includes the consideration for brake and tyre wear for PM10 and PM2.5, cold-start
emissions and the effects of catalytic converters; all of which have been included within the emissions modelling
and assessment. In addition, road gradients are also accounted for within the VEPM and their effects have been
included in the assessment through the generated emission factors. Using the assumed composition of heavy
vehicles on each of the provided roads, the vehicle fleet mix has been amended taking into account the default
fleet composition contained within the VEPM 5.1 database.
The output of the VEPM database provided a series of pollutant emission rates in grams per vehicle kilometre for
each assessment year based on vehicle speed and link composition, for input into the dispersion model.
\\NZAKL1FP002\transportation$\_PROJECTS\ATTH ACT Mill Rd Corridor 60250009\6. Draft Docs\6.1 Reports\NOR\Updated AEE September
2013\Appendix K - Air quality assessment\MillRdAQA_Issue_20130827.docx
Revision D – 27-Aug-2013
Prepared for – Auckland Transport – ABN: N/A
AECOM
Mill Road Upgrade
20
Air Quality Assessment
7.0
Dispersion Modelling
The air dispersion modelling conducted for this Tier 3 assessment has been based on the modelling approach
using the air dispersion model, AUSROADS, together with observed meteorological data provided by Auckland
Council. The data that was available for this project and a discussion of the data processing methodologies that
were required in order to implement AUSROADS will be discussed in the fol owing sections.
7.1
Modelling Approach
Ministry for the Environment guidance11 advocates the use of the simple Gaussian line source AUSROADS model
for the assessment of roadways, released by the Environment Protection Authority (EPA) Victoria in Australia.
The model uses the same algorithms as those within the commonly used CALINE4 line-source model, however
with increased functionality. Its use was agreed in principle with Auckland Council5.
7.2
Modelling Input Data
The AUSROADS model requires the following input data to perform an assessment.
7.2.1
Emissions Inventory
For the Tier 3 detailed modelling, the details of the affected roads provided by AECOM transport team have been
split into a series of links, which represent sections where traffic conditions have reasonably homogenous flow
and average speed, to al ow emission estimations to be estimated.
Pollutant emission rates from vehicles were calculated using the Vehicle Emission Prediction Model (VEPM
version 5.1) published in 2012, as detailed previously in
Section 6.2 for the pollutants carbon monoxide (CO),
nitrogen dioxide (NO2) as oxides of nitrogen dioxide (NOx), fine particulate matter (PM10 and PM2.5) and benzene
as volatile organic compounds (VOC).
7.2.2
Meteorological Data
Meteorological data are required to assess the pollutant concentrations over the various time periods defined by
the air quality objectives (i.e. 1 hour, 24 hour and annual means).
Hourly sequential observation data for the Auckland region for 2005 and 2007 were provided by Auckland Council
for use in the model ing assessment in an AUSPLUME format. Wind speed, wind direction, temperature, stability
class and mixing height observations made at Wiri meteorological station (operated by NIWA as part of a national
network of sites) 2 km west of the study area were included in the modelling. This meteorological station was
used in the assessment after it was identified to be the closest site for the area. The AUSPLUME format data set
was provided by Auckland Council after its use was recommended for within the study.
Figure 6 below illustrates the 2007 wind roses for the meteorological data, which were used within the
assessment for the baseline traffic year of 2011 and al future scenarios. The data from 2007 were used instead of
the 2005 data in the assessment, as the data were found to result in greater predicted pollutant concentrations in
the initial modelling carried out for the project, therefore representing a worst case assessment.
Figure 7 below also illustrates the additional meteorological data recorded for 2005 from Wiri meteorological
station to confirm the predominant south westerly wind patterns used in the assessment.
11 MfE, 2004.
Good Practice Guide for Atmospheric Dispersion Modelling. New Zealand Ministry for the Environment, June
2004.
\\NZAKL1FP002\transportation$\_PROJECTS\ATTH ACT Mill Rd Corridor 60250009\6. Draft Docs\6.1 Reports\NOR\Updated AEE September
2013\Appendix K - Air quality assessment\MillRdAQA_Issue_20130827.docx
Revision D – 27-Aug-2013
Prepared for – Auckland Transport – ABN: N/A
 AECOM
AECOM
Mill Road Upgrade
21
Air Quality Assessment
Figure 6: Wiri Meteorological Station 2007 AUSPLUME Wind Roses used in Assessment
Figure 7: Wiri Meteorological Station 2005 AUSPLUME Wind Roses
7.2.3
Background Pollutant Concentrations
In the absence on a representative urban background continuous monitoring station in the vicinity of the corridor,
background concentrations have been used in the modelling to provide an assessment of the cumulative impacts,
in-line with documentation prepared for Auckland Council12. Discussed earlier in
Section 5.4, the guidance
document (whilst industry focussed) does detail how to use background concentrations appropriately for transport
projects.
Accounting for background concentrations is difficult because the listed monitoring stations are affected to varying
degrees by emissions from local sources and, consequently, may provide an overestimate of background
pollutant levels.
‘Auckland Urban’ data were used in the assessment, in-line with the guidance to avoid the double
12 Metcalfe, J. Wickham, L. and Rolfe, K. (2012).
Draft - Use of Background Air Quality Data in Resource Consent Applications.
Prepared by Emission Impossible Ltd and Kevin Rolfe & Associates Ltd for Auckland Council. Auckland Council Guideline
\\NZAKL1FP002\transportation$\_PROJECTS\ATTH ACT Mill Rd Corridor 60250009\6. Draft Docs\6.1 Reports\NOR\Updated AEE September
2013\Appendix K - Air quality assessment\MillRdAQA_Issue_20130827.docx
Revision D – 27-Aug-2013
Prepared for – Auckland Transport – ABN: N/A
AECOM
Mill Road Upgrade
22
Air Quality Assessment
counting of vehicle emissions and potential over-estimation of predicted pollutant concentrations at identified
sensitive receptors and are detailed in
Table 10 below. The table shows that all background pol utant
concentrations directly relevant to this study are below the relevant national standard or regional target, with the
exception of fine particulate matter as PM2.5. Given the mixed residential / rural land use along the corridor, the
use of the data is considered to be a conservative assumption.
All future year modelling was also conducted using the same background concentrations used for the baseline
year, i.e. it would not be assumed that background air quality would improve in coming years as is generally
expected through legislation and tighter controls on emissions. The approach used in this assessment is therefore
considered to be a conservative assumption.
Table 10: Background Concentrations used in Assessment
Pollutant
Averaging
Air Quality
Concentration
Source
Period
Standard /
Target
Nitrogen
1-hour mean
200 µg/m3
80 µg/m3
Table 3.1 - Auckland Urban Airshed values
dioxide (NO2)
24-hour mean
100 µg/m3
41 µg/m3
Table 3.1 - Auckland Urban Airshed values
Annual mean
40 µg/m3
14 µg/m3
Table 3.1 - Auckland Urban Airshed values
Fine
24-hour mean
50 µg/m3
40.1 µg/m3
Table A3-2 Average of Auckland Urban Airshed
Particulate
Concentrations
matter (PM10)
Annual mean
20 µg/m3
16.6 µg/m3
Table A3-2 Average of Auckland Urban Airshed
Concentrations
Fine
24-hour mean
25 µg/m3
29.8 µg/m3
Table A3-3 Average of Auckland Urban Airshed
Particulate
Concentrations
matter (PM2.5)
Annual mean
10 µg/m3
8.0 µg/m3
Table A3-3 Average of Auckland Urban Airshed
Concentrations
Carbon
1-hour mean
30 mg/m3
5 mg/m3
Table 3.1 - Auckland Urban Airshed values
monoxide
8-hour mean
10 mg/m3
2.5 mg/m3
Table 3.1 - Auckland Urban Airshed values
(CO)
Benzene
Annual mean
3.6 µg/m3
1 µg/m3
Table 3.1 - Auckland Urban Airshed values
7.2.4
Receptor Locations
A series of discrete sensitive receptors were identified within close proximity to the corridor upgrade, which may
be affected by the changes in vehicle patterns and road alignment. A total of 22 discrete receptors, detailed in
Section 5.2, were entered into the model. The receptors were considered to be representative of the worst case
exposure in those particular locations, at distances up to 200 metres from the centre line of the affected roads.
The predicted concentrations for the existing baseline year and future year scenarios, both with and without the
proposed upgrade, at the identified sensitive receptors are detailed in
Section 8.2.
\\NZAKL1FP002\transportation$\_PROJECTS\ATTH ACT Mill Rd Corridor 60250009\6. Draft Docs\6.1 Reports\NOR\Updated AEE September
2013\Appendix K - Air quality assessment\MillRdAQA_Issue_20130827.docx
Revision D – 27-Aug-2013
Prepared for – Auckland Transport – ABN: N/A
AECOM
Mill Road Upgrade
23
Air Quality Assessment
7.2.5
Additional Model Parameters
Table 11 below lists the other parameters that were used as input into the AUSROADS model.
Table 11: Additional Parameters used in the Model
Parameter
Value
Surface Roughness (m)
0.4
Urban/rural setting
Rural
Dispersion profile
Pasquill-Gifford
Receptor height (m)
0 (ground level)
Source height (m)
0 (ground level)
7.3
Conversion of NOx to NO2
The oxidation of NO to form NO2 is a complex process that is dependent on several factors, including the relative
availability of these two gases as well as of ozone, volatile organic compounds, carbon monoxide, sunlight,
temperature and residence time.
AUSROADS assumes that the pollutants are inert gases i.e. the model does not account for any chemical
transformations and therefore the transformation of NOx to NO2 needs to be done in the post-processing stage.
The Ministry for the Environment (MfE)
Good Practice Guide for Assessing Discharges to Air from Land
Transport13 , details a methodology to calculate the effects of NO to NO2 pollutant transformation based on
measured data within New Zealand together with wider international documentation from Australia and the UK.
A ratio of 0.2 or conversion rate of 20% is summarised within the guide as being appropriate and therefore this
has been used within this assessment for all receptor locations. The effects of this assumption however will be
discussed in the results section, where applicable
7.4
Assumptions and Limitations
Traffic data used within the assessment was provided in 24-hour annual average daily traffic (AADT)
format and therefore the potential effects of diurnal traffic have not been included in the assessment.
The potential effects of terrain on pollutant concentrations through an external terrain data file have not
been assessed, as the AUSROADS model does not include this feature. Its exclusion is not considered
to be significant given the local topography and land use. The effect of gradients on the calculation of
vehicle emissions however has been taken into account.
Model verification has not been possible due to the absence of continuous air quality monitoring stations
in the vicinity of the modelled road network.
PM2.5 concentrations have been assumed to be 75% of the model ed PM10 concentrations, in-line with
previous studies conducted for the New Zealand Transport Agency14.
Emissions of volatile organic compounds (VOC) have been assumed to be 100% benzene, for
comparison against the Regional Standard. In reality, the fraction of benzene within the total VOC
emissions will be small and therefore the assessment represents a worst case approach.
13 MfE, 2008.
Good Practice Guide for Assessing Discharges to Air from Land Transport. New Zealand Ministry for the
Environment, June 2008.
14 NZTA, 2010.
Western Ring Route: SH16 Henderson Creek to Huruhuru Road Bridge – Air Quality Assessment. Prepared by
BECA for New Zealand Transport Agency. May 2010
\\NZAKL1FP002\transportation$\_PROJECTS\ATTH ACT Mill Rd Corridor 60250009\6. Draft Docs\6.1 Reports\NOR\Updated AEE September
2013\Appendix K - Air quality assessment\MillRdAQA_Issue_20130827.docx
Revision D – 27-Aug-2013
Prepared for – Auckland Transport – ABN: N/A
AECOM
Mill Road Upgrade
24
Air Quality Assessment
8.0
Assessment of Effects
The potential effects of the proposed upgrade upon local air quality have been assessed during both the
construction and operational phases using the methodology detailed in
Section 3.1.
8.1
Construction Activities
Atmospheric emissions from construction activities typical y depend on a combination of the potential for emission
(the type of activities) and the effectiveness of control measures. There are in general terms, two sources of
emissions that need to be controlled to minimise the potential for adverse environmental effects. These include:
-
exhaust emissions from site plant, equipment and vehicles
-
fugitive dust emissions from site activities.
Given the inherent uncertainty surrounding potential construction impacts, due to the temporal nature and
duration of works and opportunities for a contractor to refine design and construction methods, the construction
effects have been assessed through a qualitative review of potential sources of air emissions. This has been
based on the project description, detailed alignment plans and understood best practice construction methods. No
main construction lay down areas or compounds had been identified at the time of writing the assessment report.
Exhaust emission impacts
The operation of vehicles and equipment powered by internal combustion engines results in the emission of waste
exhaust gases containing the pollutants NOx, PM10, VOCs, and CO. The quantities emitted depend on factors
such as engine type, service history, pattern of usage and composition of fuel. The operation of site equipment,
vehicles and machinery would result in emission to the atmosphere of un-quantified levels of waste exhaust gases
but such emissions are unlikely to be significant, particularly in comparison to levels of similar emissions from
road traffic. The traffic effects of construction for the project would primarily be along the traffic routes employed
by haulage vehicles, construction vehicles and employees.
The principal construction activities with transportation implications are:
-
removal of materials from any demolition work and excavated tunnel or station material/spoil
-
delivery of materials
-
movement of heavy plant
-
diversions of existing traffic.
Entry to the main construction site for labour and vehicles will be via dedicated access points only. Construction
traffic could have an adverse impact on the air quality at adjoining occupiers if not properly controlled however
introduced mitigation measures would be able to reduce these impacts. It would be expected that a Construction
Environmental Management Plan (CEMP) would be prepared at a later date once detailed site information was
available, which would detail the identified traffic haulage corridors and site operation hours.
Indirect impacts would also be likely to occur across the study area due to the effects of traffic management and
road diversions/the use of alternative routes. The impacts of traffic management will vary depending on the
particular precinct however this too is expected to be contained with an approved CEMP.
Fugitive dust impacts
Fugitive dust emissions from earthworks and construction activities are likely to be variable and would depend
upon type and extent of the activity, soil conditions (soil type and moisture) road surface condition and weather
conditions. Soils are inevitably drier during the summer period and periods of dry weather combined with higher
than average winds have the potential to generate the most dust. Due to the expected construction duration, a
consistent level of attention to manage dust impacts would be required. The construction activities that are the
most significant potential sources of fugitive emissions are:
-
piling, rock breaking and open excavation activities
-
earth moving: due to the excavation, handling and disposal of soil and other materials
-
construction aggregate usage: due to the transport, unloading, storage and use of dry and dusty materials
(such as cement powder and sand)
\\NZAKL1FP002\transportation$\_PROJECTS\ATTH ACT Mill Rd Corridor 60250009\6. Draft Docs\6.1 Reports\NOR\Updated AEE September
2013\Appendix K - Air quality assessment\MillRdAQA_Issue_20130827.docx
Revision D – 27-Aug-2013
Prepared for – Auckland Transport – ABN: N/A
AECOM
Mill Road Upgrade
25
Air Quality Assessment
-
movement of heavy site vehicles on dry untreated or hard surfaces
-
movement of vehicles over surfaces contaminated by muddy materials brought off the site.
Fugitive emissions from construction sites are also commonly associated with the storage of spoil and stockpiles
however best practice techniques of minimum storage, covering spoil and the use of water as a dust suppressant
where necessary should largely eliminate this potential emissions source.
Fugitive dust arising from construction activities is generally of particle size greater than the human health-based
PM10 fraction. In assessing the impact of fugitive dust there are two different effects that need to be considered:
-
the effects on human health
-
dust nuisance.
The former relates to the concentration of dust in suspension in the atmosphere which can be inhaled (respirable)
and the latter relates to the amount of dust falling onto and soiling surfaces (referred to as the rate of dust
deposition). If not effectively control ed, fugitive dust emissions can lead to dust nuisance. Most of the dust
emitting activities outlined above respond well to appropriate dust control/mitigation measures and adverse effects
can be greatly reduced or eliminated.
The sensitivity of different land uses and facilities to dust can be categorised from low to high, examples of which
are listed in
Table 12 below15. Facilities within the corridor range from high sensitivity to low sensitivity
classifications, as they comprise residential and open space recreation/conservation to rural areas.
Table 12: Sensitivity of Differing Types of Land Use
Land use
Rating
Hospitals, schools, childcare facilities, rest homes
High
Residential
High
Open space recreational
High
Tourist, cultural, conservation
High
Commercial, retail, business
Medium to High
Rural residential / countryside living
Medium to High
Rural
Low
Heavy industrial
Low
Light industrial
Low
Dust has a limited ability to remain airborne and readily drops from suspension as a deposit. Research
undertaken for the United States Environmental Protection Agency16 concluded that large particulate matter
(particles over 30 micrometres in diameter), return to the surface quite rapidly after suspension and the majority of
this particulate matter (60 – 90 per cent) stays between one to two metres above the ground. Under average wind
conditions (mean wind speed of 2 - 6 metres per second), these particles, which comprise around 95 per cent of
total dust emissions were found to return to the surface within 60 - 90 metres of the emission source.17
Actual deposition rates and dust dispersion patterns will vary depending on the amount of material released, the
proximity of sensitive receptors and also the local meteorological conditions. The greatest dust impacts can
therefore be experienced at distances of up to 60 – 90 metres away from the source, however wind speeds at the
site may cause nuisance impacts at up to 350 metres away. Residential receptors along Redoubt Road are
located within 10 metres from the existing roadside and it is likely that the construction footprint may extend even
15 MfE, 2008.
Good Practice Guide for Assessing Discharges to Air from Land Transport. New Zealand Ministry for the
Environment, June 2008.
16 JG Watson and JC Chow,
Reconciling Urban Fugitive Dust Emissions Inventory and Ambient Source
Contribution Estimates: Summary of Current Knowledge and Needed Research. Desert Research Institute, DRI Document No.
6110.4F, May, 2000.
17C Cowherd, P Englehart, GE Muleski, JS Kinesy and KD Rosbury;
Control of Fugitive and Hazardous Dusts, Noyes Data
Corp, Park Ridge, NJ (1990), pp. 261–321
\\NZAKL1FP002\transportation$\_PROJECTS\ATTH ACT Mill Rd Corridor 60250009\6. Draft Docs\6.1 Reports\NOR\Updated AEE September
2013\Appendix K - Air quality assessment\MillRdAQA_Issue_20130827.docx
Revision D – 27-Aug-2013
Prepared for – Auckland Transport – ABN: N/A
AECOM
Mill Road Upgrade
26
Air Quality Assessment
closer to properties. Given the predominant south westerly wind direction in the Auckland area however, it is
considered locations to the north east of any construction activities are potential y the most susceptible to dust
nuisance during the construction period and therefore a significant level of care should be maintained throughout
the construction phase to minimise potential impacts along the corridor.
The Preliminary Site Investigation (PSI) carried out as part of the study18 also identified a number of locations
where potential ground contamination may exist and affect local air quality if disturbed. Sites identified include
asbestos contamination within the roadside verge adjacent to Redoubt Road, together with asbestos containing
material (ACM) within five properties in the Flat Bush area. As a result, the presence of further ground
contamination at potential y additional unidentified locations along the corridor should therefore be considered
throughout the construction period in relation to the potential impact to human health and air quality. Should ACM
be found within the verges, specialist service contractors would need to be appointed to ensure the health and
well-being of workers and non-workers alike is not affected during construction. Potential y odorous ground
material has not been identified.
Mitigation measures to be employed to minimise any impacts are consistent across the corridor and are
discussed in
Section 9.1.
8.2
Operational Effects
The potential effects of the corridor upgrade upon local air quality have been assessed and summarised during
the operational phase using the methodology detailed in
Section 7.1. Results are expressed as the maximum
ground level concentrations and include the relevant background concentrations, for comparison to the National
Environmental Standards for Ambient Air Quality and Auckland Regional Air Quality Targets.
The potential level of impact from the upgrade can be determined by comparing the predicted impact in the future
year with the upgrade in place against the same year without the upgrade. Full details of the predicted pollutant
concentrations for each of the modelled receptors and scenarios are contained in
Appendix B, with the predicted
changes in concentrations detailed in
Appendix C.
8.2.1
Carbon monoxide (CO)
The potential changes in the 8-hour and 1-hour mean CO concentrations, resulting from the change in vehicle
emissions and road alignment on the Mill Road corridor, at the identified worst-case sensitive receptors are
summarised below.
The predictive modelling inclusive of default background concentrations, indicates that there will be no
ground level exceedances of the 8-hour mean CO National Ambient Air Quality Standard (10 mg/m3), or
the 1-hour CO Auckland Regional Target (30 mg/m3) in any of the assessment years with or without the
corridor upgrade in place.
The maximum predicted 8-hour CO mean concentration of 2.7 mg/m3 in the proposed opening year is
predicted to occur at six receptors (Receptors 16, 17, 19 – 22) and is well below the National Standard.
The greatest predicted increase in the 8-hour CO mean with the Mill Road Upgrade in place, is forecast
to occur at eight receptors, with all predicted to experience an increase in concentrations of 0.1 mg/m3.
The maximum predicted 1-hour CO mean concentration in the proposed opening year is forecast to
occur at Receptor 16: 141 Redoubt Road, with a concentration of 5.5 mg/m3, which is well below the
Regional Target. The greatest predicted increases in the 8-hour CO mean with the Mill Road Upgrade in
place are forecast to occur at Receptor 16, with predicted increases in concentrations of 0.3 and 0.2
mg/m3, in the proposed opening year and 15 years after opening, respectively.
Five of the identified worst-case receptors are predicted to experience either an improvement or no
change in CO pol utant concentrations across both 1-hour and 8-hour mean averaging periods and in
both future years as a result of the Mill Road upgrade. The greatest predicted improvements in CO
concentrations at the identified modelled receptors are forecast to occur at Receptor 1: Cnr of Mill Road
and Alfriston Road
and Receptor 4: 5 Polo Prince Drive.
The predicted CO concentrations and incremental changes in CO concentrations at the modelled receptors are
detailed in
Appendix B and
Appendix C. The results indicate that, taking into account the default urban
18 AECOM, 2013.
Preliminary Site Investigation, Redoubt Road/Mil Road Corridor – Contaminated Lane Assessment. Prepared
for Auckland Transport. July 2013
\\NZAKL1FP002\transportation$\_PROJECTS\ATTH ACT Mill Rd Corridor 60250009\6. Draft Docs\6.1 Reports\NOR\Updated AEE September
2013\Appendix K - Air quality assessment\MillRdAQA_Issue_20130827.docx
Revision D – 27-Aug-2013
Prepared for – Auckland Transport – ABN: N/A
AECOM
Mill Road Upgrade
27
Air Quality Assessment
background concentrations, there are no predicted CO exceedances of either the National Standards or Regional
Targets at any of the selected worst-case locations. A health risk assessment for CO is therefore not considered
to be necessary as part of the assessment and the potential impact on CO concentrations is considered to be less
than minor.
8.2.2
Nitrogen dioxide (NO2)
The potential changes in the 1-hour, 24-hour and annual mean NO2 concentrations, resulting from the change in
vehicle emissions and road alignment on the Mill Road corridor, at the identified worst-case sensitive receptors
are summarised below
. A NOx to NO2 ratio of 0.2 (or NOx conversion rate of 20%) has been used within this
assessment for al receptor locations as detailed in
Section 7.3, in-line with MfE guidance19.
The predictive modelling inclusive of default background concentrations, based on a 20% NOx to NO2
conversion, indicates that there will be no ground level exceedances of the 1-hour mean NO2 National
Ambient Air Quality Standard (200 µg/m3), or the 24-hour or annual mean NO2 Auckland Regional
Targets (100 µg/m3 and 40 µg/m3, respectively) in any of the assessment years with or without the
corridor upgrade in place.
The maximum predicted NO2 1-hour mean concentration in the proposed opening year is forecast to
occur at Receptor 16: 141 Redoubt Road, with a concentration of 101.2 µg/m3, and is well below the
National Standard. The greatest predicted increase in the NO2 1-hour mean with the Mill Road Upgrade
in place is also forecast to occur at Receptor 16 in the proposed opening year, with a predicted increase
in concentrations of 10.7 µg/m3. This increase equates to 5% of the National Standard.
The maximum predicted NO2 24-hour mean concentration in the proposed opening year is forecast to
occur at Receptor 22: 12 Redoubt Road, with a concentration of 47.7 µg/m3, and is well below the
Regional Target. The greatest predicted increases in the NO2 24-hour mean with the Mill Road upgrade
in place, are forecast to occur at Receptor 16, with predicted increases in concentrations of 2.6 and 2.7
µg/m3, in the proposed opening year and 15 years after opening, respectively. These increases equate
to less than 3% of the Regional Target.
The maximum predicted NO2 annual mean concentration in the proposed opening year is forecast to
occur at Receptor 22: 12 Redoubt Road, with a concentration of 16.3 µg/m3, and is well below the
Regional Target. The greatest predicted increases in the NO2 annual mean with the Mill Road Upgrade in
place, are forecast to occur at Receptor 16, with predicted increases in concentrations of 0.7 µg/m3 in
both the proposed opening year and 15 years after opening. These increases equate to less than 2% of
the Regional Target.
Assuming a worst-case100% NOx as NO2 conversion, the National 1-hour mean NO2 Standard is
predicted to be marginal y exceeded at two identified sensitive receptor locations in the baseline year of
2011 (Receptor 1 - 202 µg/m3 and Receptor 4 – 205 µg/m3). No future exceedances however are
predicted in either the proposed 2026 opening year or 15 years fol owing scheme opening, both with or
without the upgrade in place.
Six of the identified worst-case receptors are predicted to experience an improvement in pol utant
concentrations across al 1-hour, 24-hour and annual mean averaging periods and in both future years
as a result of the Mill Road upgrade. The greatest predicted improvement in NO2 concentrations at the
identified modelled receptors is forecast to occur at Receptor 4: 5 Polo Prince Drive.
The predicted NO2 concentrations and incremental changes in NO2 concentrations at the model ed receptors are
detailed in
Appendix B and
Appendix C. The results indicate that, taking into account the default urban
background concentrations, there are no predicted NO2 exceedances of either the National Standards or Regional
Targets at any of the selected worst-case locations. A health risk assessment for NO2 is therefore not considered
to be necessary as part of the assessment and the potential impact on NO2 concentrations is considered to be
less than minor.
19 MfE, 2008.
Good Practice Guide for Assessing Discharges to Air from Land Transport. New Zealand Ministry for the
Environment, June 2008.
\\NZAKL1FP002\transportation$\_PROJECTS\ATTH ACT Mill Rd Corridor 60250009\6. Draft Docs\6.1 Reports\NOR\Updated AEE September
2013\Appendix K - Air quality assessment\MillRdAQA_Issue_20130827.docx
Revision D – 27-Aug-2013
Prepared for – Auckland Transport – ABN: N/A
AECOM
Mill Road Upgrade
28
Air Quality Assessment
8.2.3
Fine particulate matter (PM10)
The potential changes in the 24-hour and annual mean PM10 concentrations, resulting from the change in vehicle
emissions and road alignment on the Mill Road corridor, at the identified worst-case sensitive receptors are
summarised below
.
The predictive modelling inclusive of default background concentrations, indicates that there will be no
ground level exceedances of the 24-hour mean PM10 National Ambient Air Quality Standard (50 µg/m3),
or the annual mean PM10 Auckland Regional Target (20 µg/m3) in any of the assessment years with or
without the corridor upgrade in place.
The maximum predicted PM10 24-hour mean concentration of 42.5 µg/m3 is predicted to occur in the
scenario 15 years after opening (DS2041) at both Receptors 21 and 22 (22 and 12 Redoubt Road,
respectively). The greatest predicted increase in the 24-hour PM10 mean with the Mill Road Upgrade in
place, is forecast to occur at Receptor 16: 141 Redoubt Road, with a predicted increase in
concentrations of 1.0 µg/m3. This increase equates to 2% of the National Standard.
The maximum predicted PM10 annual mean concentration of 17.4 µg/m3 is also predicted to occur in the
scenario 15 years after opening (DS2041), however at Receptors 20 – 22 and both with and without the
Mill Road upgrade in place. The greatest predicted increases in the annual mean with the Mill Road
Upgrade in place, are forecast to occur at Receptor 16, with predicted increases in concentrations of 0.2
and 0.3 µg/m3, in the proposed opening year and 15 years after opening, respectively. These increases
equate to less than 1% of the Regional Target.
Nine of the identified worst-case receptors are predicted to experience either an improvement or no
change in PM10 pollutant concentrations across both 24-hour and annual mean averaging periods and in
both future years as a result of the Mill Road upgrade. The greatest predicted improvements in PM10
concentrations at the identified modelled receptors are forecast to occur at Receptor 1: Cnr of Mill Road
and Alfriston Road, Receptor 2: Alfriston School and Receptor 4: 5 Polo Prince Drive.
The predicted PM10 concentrations and incremental changes in PM10 concentrations at the modelled receptors
are detailed in
Appendix B and
Appendix C. The results indicate that, taking into account the default urban
background concentrations, there are no predicted PM10 exceedances of either the National Standards or
Regional Targets at any of the selected worst-case locations. A health risk assessment for PM10 is therefore not
considered to be necessary as part of the assessment and the potential impact on PM10 concentrations is
considered to be less than minor.
8.2.4
Fine particulate matter (PM2.5)
The potential changes in the 24-hour and annual mean PM2 5 concentrations, resulting from the change in vehicle
emissions and road alignment on the Mill Road corridor, at the identified sensitive receptors are summarised
below.
The predictive modelling inclusive of default background concentrations, indicates that the 24-hour mean
PM2.5 Auckland Regional Target (25 µg/m3) will be exceeded at al identified receptors and in all
modelled scenarios. This is due to the default urban background concentration used within the
assessment (29.8µg/m3) already exceeding the Target. The annual mean PM2 5 Regional Target (20
µg/m3) however is predicted to be met in all of the assessment years with or without the corridor upgrade
in place.
The maximum predicted PM2.5 24-hour mean concentration of 31.6 µg/m3 is predicted to occur in the
scenario 15 years after opening (DS2041) at both Receptors 21 and 22 (22 and 12 Redoubt Road,
respectively). The greatest predicted increase in the 24-hour PM2.5 mean with the Mill Road Upgrade in
place is forecast to occur at Receptor 16: 141 Redoubt Road, with a predicted increase in concentrations
of 0.7 µg/m3 in the 2041 future scenario. This increase equate to less than 3% of the Regional Target.
The maximum predicted PM2.5 annual mean concentration of 8.6 µg/m3 is also predicted to occur in the
scenario 15 years after opening, however at Receptors 20 – 22 and both with and without the Mill Road
upgrade in place. The greatest predicted increases in the annual mean with the Mill Road Upgrade in
place are forecast to occur at Receptors 7, 14 and 16, with predicted increases in concentrations of
0.2µg/m3, 15 years after opening. These increases equate to less than 1% of the Regional Target.
Nine of the identified worst-case receptors are predicted to experience either an improvement or no
change in PM2.5 pollutant concentrations across both 24-hour and annual mean averaging periods and in
\\NZAKL1FP002\transportation$\_PROJECTS\ATTH ACT Mill Rd Corridor 60250009\6. Draft Docs\6.1 Reports\NOR\Updated AEE September
2013\Appendix K - Air quality assessment\MillRdAQA_Issue_20130827.docx
Revision D – 27-Aug-2013
Prepared for – Auckland Transport – ABN: N/A
AECOM
Mill Road Upgrade
29
Air Quality Assessment
both future years as a result of the Mill Road upgrade. The greatest predicted improvements in PM2 5
concentrations at the identified modelled receptors are forecast to occur at Receptor 1: Cnr of Mill Road
and Alfriston Road, Receptor 2: Alfriston School and Receptor 4: 5 Polo Prince Drive.
The predicted PM2.5 concentrations and incremental changes in PM2.5 concentrations at the modelled receptors
are detailed in
Appendix B and
Appendix C. The results indicate that, taking into account the default urban
background concentrations, the PM2.5 24-hour mean Auckland Regional Target of 25 µg/m3 will be exceeded at all
modelled receptors in all scenarios, due to the background concentration used in the assessment already
exceeding the Target. The PM2.5 annual mean Regional Target is however predicted to be met at al of the
selected worst-case locations. Whilst exceedances of the PM2.5 24-hour mean are predicted, as these
exceedances are not as a result of the proposed upgrade. A health risk assessment for PM2.5 is therefore not
considered to be necessary as part of the assessment and the potential impact on PM2.5 concentrations is
considered to be less than minor.
8.2.5
Benzene (as Volatile Organic Compounds)
The potential changes in the annual mean benzene concentrations, modelled as volatile organic compounds
(VOCs), resulting from the change in vehicle emissions and road alignment on the Mill Road corridor, at the
identified sensitive receptors are summarised below.
The predictive modelling inclusive of default background concentrations, indicates that the benzene
annual mean (model ed as VOCs) Auckland Regional Target (3.6 µg/m3) will be met at all identified
receptors and in all modelled scenarios with and without the corridor upgrade in place.
The maximum predicted benzene annual mean concentration of 3.2 µg/m3 is predicted to occur in the
scenario 15 years after opening (DS2041) at Receptor 21 (22 Redoubt Road). The greatest predicted
increases in the benzene annual mean with the Mill Road Upgrade in place are forecast to occur at
Receptors 14 and 16 (189 and 141 Redoubt Road, respectively) with a predicted increase in
concentrations of 0.6 µg/m3 in both the 2026 opening year and 2041 future year scenario.
Nine of the identified worst-case receptors are predicted to experience either an improvement or no
change in annual mean benzene pollutant concentrations in both future years as a result of the Mill Road
upgrade. The greatest predicted improvements in benzene concentrations at the identified modelled
receptors are forecast to occur at Receptor 1: Cnr of Mill Road and Alfriston Road, and Receptor 4: 5
Polo Prince Drive, with predicted concentration reductions of 0.7 and 0.9 µg/m3 in 2026 and 2041,
respectively.
The predicted benzene concentrations and predicted incremental changes at the model ed receptors are detailed
in
Appendix B and
Appendix C. The results indicate that, taking into account the default urban background
concentrations and assuming 100% VOCs as benzene, there are no predicted exceedances of the benzene
Regional Target at any of the selected worst-case locations. A health risk assessment for benzene is therefore not
considered to be necessary as part of the assessment and the potential impact on benzene concentrations is
considered to be less than minor.
\\NZAKL1FP002\transportation$\_PROJECTS\ATTH ACT Mill Rd Corridor 60250009\6. Draft Docs\6.1 Reports\NOR\Updated AEE September
2013\Appendix K - Air quality assessment\MillRdAQA_Issue_20130827.docx
Revision D – 27-Aug-2013
Prepared for – Auckland Transport – ABN: N/A
AECOM
Mill Road Upgrade
30
Air Quality Assessment
9.0
Mitigation of Effects
9.1
Construction Effects
Given the corridor construction length as well as the proximity of sensitive receptors to the activities, there is the
potential for the project to create significant emissions and dust nuisance across the project area if not properly
managed.
Potential air quality impacts arising from construction activities would be mitigated using best practice
management measures. The appointed contractors would be required to produce a Construction Environmental
Management Plan (CEMP), together with a Construction Dust Management Plan (CDMP) or Construction Air
Quality Management Plan (CAQMP), which would set out all of the steps to be taken to control and mitigate the
effects of construction dust. Most of the identified dust emitting activities respond well to appropriate dust
control/mitigation measures and adverse effects would be greatly reduced. These measures typically involve
water suppression and reducing surface wind speeds using windbreaks/enclosures. Effective dust mitigation
measures prevent dust becoming airborne or contain dust within enclosures to prevent dispersion beyond the
emission source. The CEMP would also include likely traffic routing, site access points and hours of operation, to
ensure the potential for adverse environmental effects on local receptors is avoided.
The Ministry for the Environment good practice guide for assessing and managing dust emissions20 outlines a
series of dust control methods and technologies as key considerations. It is therefore expected that the following
measures from the guide would be incorporated into the approved CEMP.
Site Planning
Erection of solid barriers to site boundary, where appropriate.
Plan site layout – machinery and dust causing activities will be located away from sensitive receptors.
All site personnel to be fully trained.
Trained and responsible manager on site during working times to maintain logbook and carry out daily
vidual inspections.
Regular liaison with local communities.
Complaints register to monitoring nuisance and mitigation effectiveness.
Consider the placement of real-time dust monitoring at the site boundary, with trigger levels set.
Construction traffic
All vehicles will switch off engines when not in use – no idling vehicles.
Effective vehicle cleaning and specific fixed wheel washing on leaving site and damping of haul routes.
All loads entering and leaving site to be covered.
No site run-off of water or mud.
On-road vehicles to comply to set emission standards.
Minimise movement of construction traffic around site.
Demolition Activities
Use water as a dust suppressant.
Cutting equipment to use water as suppressant or local extract ventilation.
Use covered skips.
Limit drop heights.
Wrap building(s) to be demolished – where applicable.
20 MfE, 2001.
Good Practice guide for assessing and managing the environmental effects of dust emissions. New Zealand
Ministry for the Environment, September 2001.
\\NZAKL1FP002\transportation$\_PROJECTS\ATTH ACT Mill Rd Corridor 60250009\6. Draft Docs\6.1 Reports\NOR\Updated AEE September
2013\Appendix K - Air quality assessment\MillRdAQA_Issue_20130827.docx
Revision D – 27-Aug-2013
Prepared for – Auckland Transport – ABN: N/A
AECOM
Mill Road Upgrade
31
Air Quality Assessment
Site Activities
Minimise dust generating activities.
Use water as dust suppressant where applicable.
Reduce work during periods of increased wind or when blowing toward sensitive areas.
Cover, seed or fence stockpiles to prevent wind whipping.
In addition, whilst the project is not controlled by the New Zealand Transport Agency (NZTA), the NZTA has
prepared guidance which outlines suggested conditions to be placed within a Construction Air Quality
Management Plan (CAQMP)21 that could be incorporated for the construction phase of the upgrade. As the
project is classified as a ‘
high risk’ project (see
Section 3.1.1), the following example conditions have been listed
that are considered to be appropriate in relation to the upgrade, to be contained within a CAQMP.
“
Condition CAQ1
The CAQMP shall describe the measures to be adopted that, so far as practicable, seek to:
a) Reduce the odour, dust or fumes arising as a result of the project at any point within 100 m that
borders a highly sensitive air pollution land use;
b) Ensure that the 24-hour average concentration, measured midnight to midnight, of Total
Suspended Particulate (TSP) at any point within 100 m of the designation boundary that borders
a highly sensitive air pollution land use does not exceed 80 micrograms per cubic metre (μg/m³).
The CAQMP shall, as a minimum, address the following:
I. Description of the works, anticipated equipment/processes and durations;
II. Periods of time when emissions of odour, dust or fumes might arise from construction activities;
III. Identification of highly sensitive air pollution land uses likely to be adversely affected by
emissions of odour, dust or fumes from construction activities;
IV. Methods for mitigating dust emitted from construction yards, haul roads, stock-piles and
construction site exits used by trucks, potentially including the use of vacuum sweeping, water
sprays or wheel washes for trucks;
V. Methods for mitigating odour that may arise from ground disturbing construction activities;
VI. Methods for maintaining and operating construction equipment and vehicles in order to seek to
minimise visual emissions of smoke from exhaust tailpipes;
VII. Methods for undertaking and reporting (to council) on the results of daily inspections of
construction activities that might give rise to odour, dust or fumes;
VIII. Methods for monitoring and reporting (to council) on the state of air quality during
construction, including Total Suspended Particulate, wind speed, wind direction, air temperature
and rainfall;
IX. Procedures for maintaining contact with stakeholders, notifying of proposed construction
activities and handling complaints about odour, dust or fumes;
X. Construction operator training procedures on mitigation odour, dust or fumes;
XI. Contact numbers for key construction staff, staff responsible for managing air quality during
construction and council officers.
Condition CAQ2
Monitoring of Total Suspended Particulate (TSP) shall be undertaken;
a) using a continuous or gravimetric monitor with a maximum measurement time resolution of 24
hours;
21 NZTA, 2012.
Draft Guide to assessing air quality effects for state highway asset improvement projects. Version 0.6, New
Zealand Transport Agency, September 2012
\\NZAKL1FP002\transportation$\_PROJECTS\ATTH ACT Mill Rd Corridor 60250009\6. Draft Docs\6.1 Reports\NOR\Updated AEE September
2013\Appendix K - Air quality assessment\MillRdAQA_Issue_20130827.docx
Revision D – 27-Aug-2013
Prepared for – Auckland Transport – ABN: N/A
AECOM
Mill Road Upgrade
32
Air Quality Assessment
b) in general accordance with the Good Practice Guide for air quality monitoring and data
management, Ministry for Environment, 2009;
c) at a minimum of [one] site within 100 m of the designation boundary that borders an
appropriate number of highly sensitive air pollution land uses and that, so far as practicable,
comply with the requirements of AS/NZ 3580.1.1:2007 Method for sampling and analysis of
ambient air – guide to siting air monitoring equipment;
d) for a minimum of one week at each monitoring site;
e) between October and April inclusive during the construction phase of the project.”
It is expected that the air quality monitoring program to be implemented during the construction phase will be
designed by the appointed contractors, once a detailed understanding of the schedule of site activities and
construction methods is available. The exact frequency and extent of the monitoring program, together with
timings of when reviews of the monitoring effectiveness will be conducted are also expected to be contained in the
document. Trigger levels to measure the effectiveness of mitigation measures against should also be detailed, as
outlined in
Section 4.1.3.
The monitoring program should however be fully operational during the initial site clearance and earthworks
phases, as these phases inherently involve dust generating activities and may therefore cause nuisance impacts
at adjacent receptors. It would be reasonable to expect the need for ongoing air quality / dust monitoring to be
reviewed after the initial six months of site works based on site management and operations.
Incorporating all of the measures outlined above into the CEMP and CDMP / CAQMP would ensure that potential
air quality impacts would be reduced as far as possible, maintaining fugitive dust levels and fine particulate matter
concentrations (PM10 and PM2.5) within the respective thresholds; thus limiting any residual impacts.
9.2
Operational Effects
No exceedances of the National Environmental Standards for Ambient Air Quality are predicted to occur at any of
the modelled worst-case receptor locations in any of the future assessment scenarios, along the Mill Road
upgrade corridor, based on the assessment methodology and assumptions.
The PM2.5 24-hour mean Auckland Regional Air Quality Target (25 µg/m3) is predicted to be exceeded at all
modelled worst-case receptors and in all assessment scenarios, however this is due to the default urban
background concentration used in the assessment (29.8 µg/m3). All other Regional Air Quality Targets are
predicted to be met in al scenarios and at all identified worst-case receptors.
As the predicted impacts at all identified worst case receptors and for al modelled pollutants are considered to be
less than minor, no mitigation measures are suggested in relation to the operation of the Mill Road upgrade.
\\NZAKL1FP002\transportation$\_PROJECTS\ATTH ACT Mill Rd Corridor 60250009\6. Draft Docs\6.1 Reports\NOR\Updated AEE September
2013\Appendix K - Air quality assessment\MillRdAQA_Issue_20130827.docx
Revision D – 27-Aug-2013
Prepared for – Auckland Transport – ABN: N/A
AECOM
Mill Road Upgrade
33
Air Quality Assessment
10.0 Summary and conclusion
An assessment has been carried out to determine the potential air quality impact of the proposed Redoubt Road
to Mill Road corridor upgrade, Auckland, in relation to the National Environmental Standards for Ambient Air
Quality and Auckland Regional Air Quality Targets.
The assessment examines the existing air quality in the area, the local meteorology and terrain and then
considers the likely effect on air quality as a result of emissions during the construction and operational phases of
the upgrade. Potential odour impacts have also been considered.
Non-continuous local air quality monitoring data collected by New Zealand Transport Agency indicate that NO2
annual mean pol utant concentrations in the vicinity of the corridor are below the Auckland Regional Target. The
continuous monitoring of pollutants however is not conducted in the vicinity of the corridor and therefore the
assessment has utilised published Auckland urban default background concentrations. All of the background
concentrations used in the assessment are below the relevant National Standards and Regional Targets, with the
exception of the default Auckland urban background 24-hour PM2.5 mean used, which does exceed the Auckland
Regional Standard.
The main potential air quality impact during the construction of the corridor upgrade would be expected to be from
emissions of dust. If released in sufficient quantities, given the proximity of existing sensitive residential receptors
to the Redoubt Road – Mill Road corridor, this could result in a nuisance from soiling and also have potential
health implications if not properly managed. Construction-related plant and vehicle emissions associated with
direct truck movements and in-direct wider diversions / congestion are also likely to occur, however these impacts
will be temporary. In addition, the Preliminary Site Investigation report conducted for the upgrade study, identified
the potential for asbestos containing materials (ACM) within the roadside verges, which should be taken into
consideration. Should ACM be found within the verges, specialist service contractors would need to be appointed
to ensure the health and well-being of workers and non-workers alike is not affected during construction.
Atmospheric dispersion model ing has been undertaken using AUSROADS, to assess the impact of the
operational changes in vehicle emissions both with and without the upgrade in place, in the modelled opening
year of 2026 and 15 years from opening (2041). The pol utants assessed were carbon monoxide, nitrogen
dioxide, fine particulate matter (PM10 and PM2.5) and benzene and have been forecast at identified worst-case
receptor locations along the existing and proposed corridor. In addition, no future improvement in background
pollutant concentrations was assumed within the study and the meteorological data were supplied by Auckland
Council for the worst-case years of 2005 and 2007.
The forecast concentrations indicate that all National Environmental Standards for Ambient Air Quality for the
modelled pollutants will not be exceeded at all worst-case receptor locations and in all future assessment years,
both with and without the corridor upgrade in place. In addition, all Auckland Regional Air Quality Targets with the
exception of 24-hour mean PM2.5 concentrations are also predicted to not be exceeded at all locations and in all
assessment years. The predicted PM2.5 exceedances are due to the use of the Auckland urban default
background concentrations, which already exceed the Regional Target.
Construction effects on air quality would be control ed as far as possible through the implementation of best
practise construction methods and the adoption of mitigation measures through a contractor’s Construction
Environmental Management Plan (CEMP), together with a Construction Dust Management Plan (CDMP) /
Construction Air Quality Management Plan (CAQMP), during the construction phase of the Mill Road. The
CAQMP would include specific objectives and measures developed by Ministry for the Environment and the New
Zealand Transport Agency for managing construction impacts; thus ensuring that potential adverse impacts are
minimised or avoided, ensuring compliance with the relevant National Standards, Regional Targets and industry
recommended guidelines and therefore limiting any potential residual impacts.
No mitigation measures have been recommended with regards to the operation of the Mill Road upgrade.
Overall, with appropriate mitigation for construction impact in place, the impacts on local air quality as a result of
the Mill Road upgrade, during both the construction and operational phases, are considered to be less than minor.
\\NZAKL1FP002\transportation$\_PROJECTS\ATTH ACT Mill Rd Corridor 60250009\6. Draft Docs\6.1 Reports\NOR\Updated AEE September
2013\Appendix K - Air quality assessment\MillRdAQA_Issue_20130827.docx
Revision D – 27-Aug-2013
Prepared for – Auckland Transport – ABN: N/A
AECOM
Mill Road Upgrade
Air Quality Assessment
Appendix A
Traffic data for Air Quality
Assessment
AECOM
Mill Road Upgrade
A-1
Air Quality Assessment
Appendix A
Traffic data for Air Quality Assessment
Scenario
Annual Average Daily
% Heavy Goods
Posted Speed (kph)
Typical Peak Hour
Traffic Flow (AADT)
Vehicle
Traffic Flow
Link 1) State Highway - North of Redoubt Road
Existing 2011
60000
10
100
6000
Do Minimum 2026
80000
10
100
8000
Do Something 2026
90000
10
100
9000
Do Minimum 2041
90000
10
100
9000
Do Something 2041
94000
10
100
9400
Link 2) State Highway 2 - South of Redoubt Road
Existing 2011
80000
10
100
8000
Do Minimum 2026
100000
10
100
10000
Do Something 2026
100000
10
100
10000
Do Minimum 2041
108000
10
100
10800
Do Something 2041
110000
10
100
11000
Link 3) Diorella Drive
Existing 2011
2500
5
45
250
Do Minimum 2026
3000
5
45
300
Do Something 2026
4000
5
45
400
Do Minimum 2041
3000
5
45
300
Do Something 2041
4000
5
45
400
Link 4) Everglade Drive
Existing 2011
10000
5
50
1000
Do Minimum 2026
11000
5
50
1100
Do Something 2026
13000
5
50
1300
Do Minimum 2041
12000
5
50
1200
Do Something 2041
13000
5
50
1300
Link 5) Hollyford Drive
Existing 2011
15000
5
50
1500
Do Minimum 2026
17000
5
50
1700
Do Something 2026
20000
5
50
2000
Do Minimum 2041
19500
5
50
1950
Do Something 2041
20000
5
50
2000
Link 6) Goodwood Drive
Existing 2011
4500
5
50
450
Do Minimum 2026
6000
5
50
600
Do Something 2026
6000
5
50
600
\\NZAKL1FP002\transportation$\_PROJECTS\ATTH ACT Mill Rd Corridor 60250009\6. Draft Docs\6.1 Reports\NOR\Updated AEE September
2013\Appendix K - Air quality assessment\MillRdAQA_Issue_20130827.docx
Revision D – 27-Aug-2013
Prepared for – Auckland Transport – ABN: N/A
AECOM
Mill Road Upgrade
A-2
Air Quality Assessment
Scenario
Annual Average Daily
% Heavy Goods
Posted Speed (kph)
Typical Peak Hour
Traffic Flow (AADT)
Vehicle
Traffic Flow
Do Minimum 2041
6000
5
50
600
Do Something 2041
6500
5
50
650
Link 7) Hilltop Road
Existing 2011
3500
5
45
350
Do Minimum 2026
5500
5
45
550
Do Something 2026
5500
5
45
550
Do Minimum 2041
5500
5
45
550
Do Something 2041
5500
5
45
550
Link 8) Murphys Road
Existing 2011
10000
5
50
1000
Do Minimum 2026
17500
5
50
1750
Do Something 2026
20000
5
50
2000
Do Minimum 2041
18000
5
50
1800
Do Something 2041
24000
5
50
2400
Link 9) Redoubt Road – Between Murphys Road and Mill Road
Existing 2011
14000
5
65
1400
Do Minimum 2026
21000
5
65
2100
Option 2026
26000
5
65
2600
Do Minimum 2041
22500
5
65
2250
Option 2041
29500
5
65
2950
Link 10) Redoubt Road - East of Mill Road
Existing 2011
3000
5
45
300
Do Minimum 2026
5000
5
45
500
Do Something 2026
5500
5
45
550
Do Minimum 2041
7000
5
45
700
Do Something 2041
7000
5
45
700
Link 11) Mill Road – South of Redoubt Road
Existing 2011
13500
5
65
1350
Do Minimum 2026
23000
5
65
2300
Do Something 2026
24500
5
65
2450
Do Minimum 2041
27000
5
65
2700
Do Something 2041
28500
5
65
2850
Link 12) Polo Prince Drive
Existing 2011
1100
5
35
110
Do Minimum 2026
1300
5
35
130
\\NZAKL1FP002\transportation$\_PROJECTS\ATTH ACT Mill Rd Corridor 60250009\6. Draft Docs\6.1 Reports\NOR\Updated AEE September
2013\Appendix K - Air quality assessment\MillRdAQA_Issue_20130827.docx
Revision D – 27-Aug-2013
Prepared for – Auckland Transport – ABN: N/A
AECOM
Mill Road Upgrade
A-3
Air Quality Assessment
Scenario
Annual Average Daily
% Heavy Goods
Posted Speed (kph)
Typical Peak Hour
Traffic Flow (AADT)
Vehicle
Traffic Flow
Do Something 2026
1350
5
35
135
Do Minimum 2041
1500
5
35
150
Do Something 2041
1500
5
35
150
Link 13) Mill Road – South of Polo Prince Drive
Existing 2011
14000
5
85
1400
Do Minimum 2026
21000
5
85
2100
Do Something 2026
25000
5
85
2500
Do Minimum 2041
25000
5
85
2500
Do Something 2041
30000
5
85
3000
Link 14) Ranfurly Road
Existing 2011
4000
5
80
400
Do Minimum 2026
10500
5
80
1000
Do Something 2026
13000
5
80
1300
Do Minimum 2041
11000
5
80
1050
Do Something 2041
15000
5
80
1500
Link 15) Alfriston Road – East of Mill Road
Existing 2011
6000
5
80
600
Do Minimum 2026
10000
5
80
1000
Do Something 2026
11000
5
80
1100
Do Minimum 2041
10500
5
80
1050
Do Something 2041
11000
5
80
1100
Link 16) Alfriston Road – West of Mill Road
Existing 2011
6000
5
80
600
Do Minimum 2026
9500
5
80
950
Do Something 2026
9500
5
80
950
Do Minimum 2041
9500
5
80
950
Do Something 2041
9500
5
80
350
Link 17) Phillip Road
Existing 2011
700
5
35
70
Do Minimum 2026
900
5
35
90
Do Something 2026
900
5
35
90
Do Minimum 2041
1300
5
35
130
Do Something 2041
1300
5
35
130
Link 18) Popes Road
Existing 2011
3200
5
80
500
\\NZAKL1FP002\transportation$\_PROJECTS\ATTH ACT Mill Rd Corridor 60250009\6. Draft Docs\6.1 Reports\NOR\Updated AEE September
2013\Appendix K - Air quality assessment\MillRdAQA_Issue_20130827.docx
Revision D – 27-Aug-2013
Prepared for – Auckland Transport – ABN: N/A
AECOM
Mill Road Upgrade
A-4
Air Quality Assessment
Scenario
Annual Average Daily
% Heavy Goods
Posted Speed (kph)
Typical Peak Hour
Traffic Flow (AADT)
Vehicle
Traffic Flow
Do Minimum 2026
5000
5
80
500
Do Something 2026
8000
5
80
800
Do Minimum 2041
7500
5
80
750
Do Something 2041
9000
5
80
900
Link 19) Redoubt Road between State Highway 1 and Hollyford Road
Existing 2011
20000
5
55
2000
Do Minimum 2026
24000
5
55
2400
Do Something 2026
33000
5
55
3300
Do Minimum 2041
26500
5
55
2650
Do Something 2041
35000
5
55
3500
Link 20) Redoubt Road between Hollyford Road and Murphys Road
Existing 2011
12000
5
55
1200
Do Minimum 2026
14000
5
55
1400
Do Something 2026
22000
5
55
2200
Do Minimum 2041
17000
5
55
1700
Do Something 2041
25000
5
55
2500
\\NZAKL1FP002\transportation$\_PROJECTS\ATTH ACT Mill Rd Corridor 60250009\6. Draft Docs\6.1 Reports\NOR\Updated AEE September
2013\Appendix K - Air quality assessment\MillRdAQA_Issue_20130827.docx
Revision D – 27-Aug-2013
Prepared for – Auckland Transport – ABN: N/A
AECOM
Mill Road Upgrade
Air Quality Assessment
Appendix B
Modelling Results
AECOM
Mill Road Upgrade
B-1
Air Quality Assessment
Appendix B
Modelling Results
Pollutant
Carbon monoxide
Nitrogen dioxide
Particles as PM10
Particles as PM2.5
Benzene
Averaging
1-hour
8-hour
1-hour
24-hour
Annual
24-hour
Annual
24-hour
Annual
Annual
Period
mean
mean
mean
mean
mean
mean
mean
mean
mean
mean
National
10mg/m3
200µg/m3
50µg/m3
Standards
Auckland
30mg/m3
100µg/m3
40µg/m3
20µg/m3
25µg/m3
10µg/m3
3.6µg/m3
Targets
Receptor 1: Cnr of Mill Road and Alfriston Road (316710, 5901280)
2011
5.6
2.8
104.4
46.9
16.0
41.7
17.2
31.0
8.4
2.8
DM2026
5.3
2.6
96.4
45.0
15.4
41.0
16.9
30.5
8.2
2.2
DS2026
5.1
2.6
86.7
42.6
14.5
40.5
16.7
30.1
8.1
1.5
DM2041
5.4
2.7
96.5
45.1
15.1
41.6
17.1
31.0
8.4
2.3
DS2041
5.1
2.6
86.4
42.5
14.5
40.7
16.8
30.2
8.1
1.4
Receptor 2: Alfriston School, Mill Road (316672, 5901250)
2011
5.4
2.7
94.5
46.8
16.1
41.7
17.2
31.0
8.4
2.8
DM2026
5.2
2.6
89.8
45.0
15.5
41.0
16.9
30.5
8.2
2.3
DS2026
5.2
2.6
88.7
42.9
14.7
40.5
16.8
30.1
8.1
1.6
DM2041
5.2
2.6
89.8
45.1
15.1
41.6
17.2
31.0
8.4
2.3
DS2041
5.2
2.6
88.5
42.8
14.6
40.8
16.8
30.3
8.2
1.6
Receptor 3: Cnr of Mill Road and Ranfurly Road (316319, 5901996)
2011
5.3
2.7
94.3
44.6
15.4
41.1
17.0
30.5
8.3
2.2
DM2026
5.1
2.6
89.6
43.7
15.0
40.7
16.8
30.3
8.2
1.9
DS2026
5.2
2.6
88.4
43.0
14.7
40.6
16.8
30.1
8.1
1.6
DM2041
5.2
2.6
89.8
43.7
14.8
41.1
17.0
30.6
8.3
1.9
DS2041
5.2
2.6
88.5
43.1
14.7
40.9
16.9
30.4
8.2
1.6
Receptor 4: 5 Polo Prince Road (315857, 5902596)
2011
5.6
2.8
105.0
46.3
15.8
41.5
17.1
30.9
8.4
2.5
DM2026
5.3
2.6
98.6
44.7
15.2
40.9
16.9
30.4
8.2
2.0
DS2026
5.1
2.5
84.0
41.9
14.3
40.3
16.7
30.0
8.1
1.3
DM2041
5.4
2.7
98.2
44.9
15.0
41.6
17.1
30.9
8.4
2.2
DS2041
5.1
2.5
83.9
41.9
14.3
40.4
16.7
30.0
8.1
1.3
Receptor 5: 182 Mill Road (316324, 5902462)
2011
5.1
2.5
84.9
42.0
14.3
40.4
16.7
30.0
8.1
1.3
DM2026
5.1
2.5
83.3
41.7
14.2
40.3
16.6
29.9
8.0
1.2
DS2026
5.2
2.5
87.4
42.0
14.3
40.3
16.7
30.0
8.1
1.3
DM2041
5.1
2.5
83.2
41.7
14.2
40.4
16.7
30.0
8.1
1.2
\\NZAKL1FP002\transportation$\_PROJECTS\ATTH ACT Mill Rd Corridor 60250009\6. Draft Docs\6.1 Reports\NOR\Updated AEE September
2013\Appendix K - Air quality assessment\MillRdAQA_Issue_20130827.docx
Revision D – 27-Aug-2013
Prepared for – Auckland Transport – ABN: N/A
AECOM
Mill Road Upgrade
B-2
Air Quality Assessment
Pollutant
Carbon monoxide
Nitrogen dioxide
Particles as PM10
Particles as PM2.5
Benzene
Averaging
1-hour
8-hour
1-hour
24-hour
Annual
24-hour
Annual
24-hour
Annual
Annual
Period
mean
mean
mean
mean
mean
mean
mean
mean
mean
mean
National
10mg/m3
200µg/m3
50µg/m3
Standards
Auckland
30mg/m3
100µg/m3
40µg/m3
20µg/m3
25µg/m3
10µg/m3
3.6µg/m3
Targets
DS2041
5.2
2.5
87.3
42.0
14.3
40.5
16.7
30.1
8.1
1.3
Receptor 6: 361 Redoubt Road (315301, 5903466)
2011
5.2
2.6
88.4
42.7
14.6
40.6
16.8
30.2
8.1
1.6
DM2026
5.1
2.5
85.8
42.2
14.4
40.4
16.7
30.0
8.1
1.4
DS2026
5.2
2.6
91.5
43.6
14.9
40.7
16.8
30.3
8.2
1.8
DM2041
5.1
2.5
85.6
42.2
14.4
40.6
16.8
30.2
8.1
1.5
DS2041
5.2
2.6
91.4
43.6
14.9
41.2
17.0
30.6
8.3
1.9
Receptor 7: 323 Redoubt Road (314850, 5903540)
2011
5.3
2.6
90.8
43.1
14.6
40.7
16.8
30.3
8.1
1.6
DM2026
5.1
2.5
87.2
42.5
14.4
40.4
16.7
30.1
8.1
1.4
DS2026
5.3
2.6
94.4
44.0
15.0
40.8
16.8
30.3
8.2
1.8
DM2041
5.1
2.6
86.4
42.4
14.3
40.7
16.8
30.2
8.1
1.4
DS2041
5.3
2.6
94.1
43.9
15.0
41.3
17.0
30.7
8.3
1.9
Receptor 8: 280 Redoubt Road (314764, 5903732)
2011
5.4
2.7
94.8
46.3
16.0
41.6
17.2
30.9
8.4
2.9
DM2026
5.2
2.6
90.0
44.7
15.4
41.0
16.9
30.5
8.2
2.2
DS2026
5.1
2.6
86.0
42.9
14.7
40.6
16.8
30.1
8.1
1.6
DM2041
5.2
2.6
89.4
44.5
15.0
41.5
17.1
30.9
8.4
2.3
DS2041
5.1
2.6
85.8
42.9
14.7
40.9
16.9
30.4
8.2
1.7
Receptor 9: 246 Redoubt Road (314715, 5904140)
2011
5.2
2.6
88.4
42.9
14.7
40.6
16.8
30.2
8.2
1.7
DM2026
5.1
2.5
85.2
42.2
14.5
40.4
16.7
30.0
8.1
1.4
DS2026
5.2
2.6
87.5
42.7
14.6
40.5
16.7
30.1
8.1
1.6
DM2041
5.1
2.5
85.0
42.2
14.4
40.6
16.8
30.2
8.1
1.5
DS2041
5.2
2.6
87.6
42.7
14.6
40.8
16.8
30.3
8.2
1.7
Receptor 10: 51 Murphys Road (314801, 5904251)
2011
5.3
2.6
89.0
42.6
14.6
40.6
16.8
30.1
8.1
1.6
DM2026
5.1
2.5
86.5
42.1
14.4
40.4
16.7
30.0
8.1
1.4
DS2026
5.2
2.6
86.9
42.5
14.5
40.5
16.7
30.1
8.1
1.5
DM2041
5.1
2.6
85.8
42.0
14.3
40.5
16.8
30.1
8.1
1.4
DS2041
5.2
2.6
86.8
42.5
14.5
40.7
16.8
30.3
8.1
1.5
\\NZAKL1FP002\transportation$\_PROJECTS\ATTH ACT Mill Rd Corridor 60250009\6. Draft Docs\6.1 Reports\NOR\Updated AEE September
2013\Appendix K - Air quality assessment\MillRdAQA_Issue_20130827.docx
Revision D – 27-Aug-2013
Prepared for – Auckland Transport – ABN: N/A
AECOM
Mill Road Upgrade
B-3
Air Quality Assessment
Pollutant
Carbon monoxide
Nitrogen dioxide
Particles as PM10
Particles as PM2.5
Benzene
Averaging
1-hour
8-hour
1-hour
24-hour
Annual
24-hour
Annual
24-hour
Annual
Annual
Period
mean
mean
mean
mean
mean
mean
mean
mean
mean
mean
National
10mg/m3
200µg/m3
50µg/m3
Standards
Auckland
30mg/m3
100µg/m3
40µg/m3
20µg/m3
25µg/m3
10µg/m3
3.6µg/m3
Targets
Receptor 11: 34 Murphys Road (314722, 5904325)
2011
5.3
2.6
92.1
43.9
15.2
41.0
16.9
30.4
8.3
2.3
DM2026
5.1
2.5
87.8
43.2
14.9
40.6
16.8
30.2
8.2
1.9
DS2026
5.1
2.6
85.6
43.4
14.9
40.7
16.8
30.2
8.2
1.9
DM2041
5.2
2.6
87.5
43.0
14.6
40.9
16.9
30.4
8.3
2.0
DS2041
5.1
2.6
85.7
43.4
14.9
41.1
17.0
30.5
8.3
2.1
Receptor 12: 208 Redoubt Road (314373, 5904324)
2011
5.5
2.8
97.6
46.4
15.7
41.7
17.1
31.0
8.4
2.8
DM2026
5.2
2.6
89.6
44.2
15.0
40.9
16.8
30.4
8.2
2.0
DS2026
5.3
2.6
93.2
43.9
14.9
40.8
16.8
30.3
8.2
1.8
DM2041
5.2
2.6
89.3
44.2
14.8
41.4
17.0
30.8
8.3
2.1
DS2041
5.3
2.6
92.6
43.9
14.8
41.3
16.9
30.7
8.3
1.9
Receptor 13: 170 Redoubt Road (313917, 5904372)
2011
5.6
2.8
102.8
46.2
15.7
41.7
17.1
31.0
8.4
2.9
DM2026
5.3
2.6
92.6
44.0
15.0
40.8
16.8
30.3
8.2
2.0
DS2026
5.2
2.6
90.5
43.5
14.8
40.7
16.8
30.3
8.2
1.8
DM2041
5.3
2.6
92.4
44.1
14.8
41.4
17.0
30.8
8.3
2.1
DS2041
5.2
2.6
89.9
43.5
14.8
41.1
16.9
30.6
8.3
1.9
Receptor 14: 189 Redoubt Road (313973, 5904309)
2011
5.2
2.6
88.3
43.3
14.8
40.8
16.8
30.3
8.2
1.8
DM2026
5.1
2.5
84.6
42.3
14.5
40.4
16.7
30.0
8.1
1.4
DS2026
5.2
2.6
88.9
44.1
15.0
40.8
16.8
30.4
8.2
2.0
DM2041
5.1
2.6
84.5
42.2
14.4
40.6
16.8
30.2
8.1
1.5
DS2041
5.2
2.6
88.6
44.0
15.0
41.4
17.0
30.7
8.3
2.1
Receptor 15: 156 Redoubt Road (313640, 5904389)
2011
5.3
2.7
91.8
45.6
15.6
41.5
17.1
30.8
8.4
2.8
DM2026
5.1
2.6
86.9
43.6
15.0
40.7
16.8
30.3
8.2
2.0
DS2026
5.2
2.6
88.2
43.4
14.9
40.7
16.8
30.2
8.2
1.9
DM2041
5.2
2.6
86.7
43.6
14.7
41.2
17.0
30.6
8.3
2.1
DS2041
5.2
2.6
87.5
43.3
14.8
41.0
16.9
30.5
8.2
1.9
\\NZAKL1FP002\transportation$\_PROJECTS\ATTH ACT Mill Rd Corridor 60250009\6. Draft Docs\6.1 Reports\NOR\Updated AEE September
2013\Appendix K - Air quality assessment\MillRdAQA_Issue_20130827.docx
Revision D – 27-Aug-2013
Prepared for – Auckland Transport – ABN: N/A
AECOM
Mill Road Upgrade
B-4
Air Quality Assessment
Pollutant
Carbon monoxide
Nitrogen dioxide
Particles as PM10
Particles as PM2.5
Benzene
Averaging
1-hour
8-hour
1-hour
24-hour
Annual
24-hour
Annual
24-hour
Annual
Annual
Period
mean
mean
mean
mean
mean
mean
mean
mean
mean
mean
National
10mg/m3
200µg/m3
50µg/m3
Standards
Auckland
30mg/m3
100µg/m3
40µg/m3
20µg/m3
25µg/m3
10µg/m3
3.6µg/m3
Targets
Receptor 16: 141 Redoubt Road (313443, 5904276)
2011
5.5
2.8
98.2
46.3
15.4
41.7
17.0
31.0
8.3
2.5
DM2026
5.2
2.6
90.5
44.1
14.8
40.9
16.8
30.4
8.1
1.8
DS2026
5.5
2.7
101.2
46.7
15.5
41.5
17.0
30.8
8.3
2.4
DM2041
5.2
2.6
90.0
43.5
14.6
41.3
16.9
30.7
8.2
1.9
DS2041
5.4
2.7
99.6
46.2
15.3
42.3
17.2
31.4
8.4
2.5
Receptor 17: 1 Santa Monica Place (313107, 5904321)
2011
5.8
2.9
109.2
49.8
16.9
42.7
17.5
31.8
8.6
4.1
DM2026
5.3
2.7
96.7
46.0
15.6
41.3
17.0
30.7
8.3
2.6
DS2026
5.4
2.7
98.0
45.7
15.4
41.3
16.9
30.7
8.3
2.4
DM2041
5.4
2.7
96.0
45.8
15.3
42.1
17.3
31.3
8.5
2.8
DS2041
5.4
2.7
96.7
45.4
15.3
41.9
17.1
31.2
8.4
2.5
Receptor 18: 12 Elsted Place (313244, 5904295)
2011
5.4
2.7
94.6
44.1
15.1
41.0
16.9
30.5
8.3
2.2
DM2026
5.2
2.6
88.3
42.8
14.6
40.5
16.8
30.1
8.1
1.6
DS2026
5.3
2.6
92.0
43.9
15.1
40.8
16.9
30.3
8.2
2.0
DM2041
5.2
2.6
87.9
42.6
14.5
40.8
16.9
30.3
8.2
1.7
DS2041
5.3
2.6
91.2
43.6
15.0
41.2
17.0
30.6
8.3
2.1
Receptor 19: 2 Everglade Drive (312808, 5904147)
2011
5.6
2.8
101.0
47.9
16.5
42.2
17.4
31.4
8.6
3.8
DM2026
5.2
2.6
91.6
44.9
15.4
41.0
16.9
30.5
8.2
2.4
DS2026
5.3
2.7
94.5
45.1
15.6
41.1
17.0
30.5
8.3
2.6
DM2041
5.3
2.6
91.3
44.8
15.1
41.7
17.2
31.0
8.4
2.6
DS2041
5.3
2.6
93.3
44.8
15.5
41.6
17.2
31.0
8.4
2.7
Receptor 20: 38 Redoubt Road (312575 , 5904123)
2011
5.7
2.9
106.4
50.8
17.4
43.0
17.6
32.0
8.7
4.5
DM2026
5.3
2.7
95.0
46.4
15.9
41.4
17.0
30.8
8.3
2.8
DS2026
5.4
2.7
96.0
46.9
16.0
41.5
17.1
30.9
8.4
2.9
DM2041
5.3
2.7
94.3
46.4
15.5
42.3
17.4
31.5
8.6
3.0
DS2041
5.3
2.7
94.8
46.5
15.9
42.3
17.4
31.5
8.6
3.0
\\NZAKL1FP002\transportation$\_PROJECTS\ATTH ACT Mill Rd Corridor 60250009\6. Draft Docs\6.1 Reports\NOR\Updated AEE September
2013\Appendix K - Air quality assessment\MillRdAQA_Issue_20130827.docx
Revision D – 27-Aug-2013
Prepared for – Auckland Transport – ABN: N/A
AECOM
Mill Road Upgrade
B-5
Air Quality Assessment
Pollutant
Carbon monoxide
Nitrogen dioxide
Particles as PM10
Particles as PM2.5
Benzene
Averaging
1-hour
8-hour
1-hour
24-hour
Annual
24-hour
Annual
24-hour
Annual
Annual
Period
mean
mean
mean
mean
mean
mean
mean
mean
mean
mean
National
10mg/m3
200µg/m3
50µg/m3
Standards
Auckland
30mg/m3
100µg/m3
40µg/m3
20µg/m3
25µg/m3
10µg/m3
3.6µg/m3
Targets
Receptor 21: 22 Redoubt Road (312403, 5904067)
2011
5.8
2.9
108.4
51.6
17.7
43.2
17.7
32.1
8.8
4.8
DM2026
5.3
2.7
95.9
46.6
16.0
41.5
17.1
30.8
8.4
2.9
DS2026
5.4
2.7
96.4
47.5
16.2
41.7
17.1
31.0
8.4
3.1
DM2041
5.3
2.7
95.3
47.0
15.6
42.5
17.4
31.6
8.6
3.1
DS2041
5.3
2.7
95.8
47.0
16.0
42.5
17.4
31.6
8.6
3.2
Receptor 22: 12 Redoubt Road (312268, 5904022)
2011
5.8
2.9
107 8
51.7
17.7
43.1
17.7
32.1
8.8
4.6
DM2026
5.3
2.7
95.8
46.4
15.9
41.4
17.1
30.8
8.3
2.7
DS2026
5.4
2.7
96.5
47.7
16.3
41.7
17.2
31.0
8.4
3.0
DM2041
5.3
2.7
95.1
47.1
15.6
42.4
17.4
31.5
8.6
3.0
DS2041
5.3
2.7
96.9
47.2
16.1
42.5
17.4
31.6
8.6
3.1
\\NZAKL1FP002\transportation$\_PROJECTS\ATTH ACT Mill Rd Corridor 60250009\6. Draft Docs\6.1 Reports\NOR\Updated AEE September
2013\Appendix K - Air quality assessment\MillRdAQA_Issue_20130827.docx
Revision D – 27-Aug-2013
Prepared for – Auckland Transport – ABN: N/A
AECOM
Mill Road Upgrade
Air Quality Assessment
Appendix C
Predicted Change in
Pollutant Concentrations
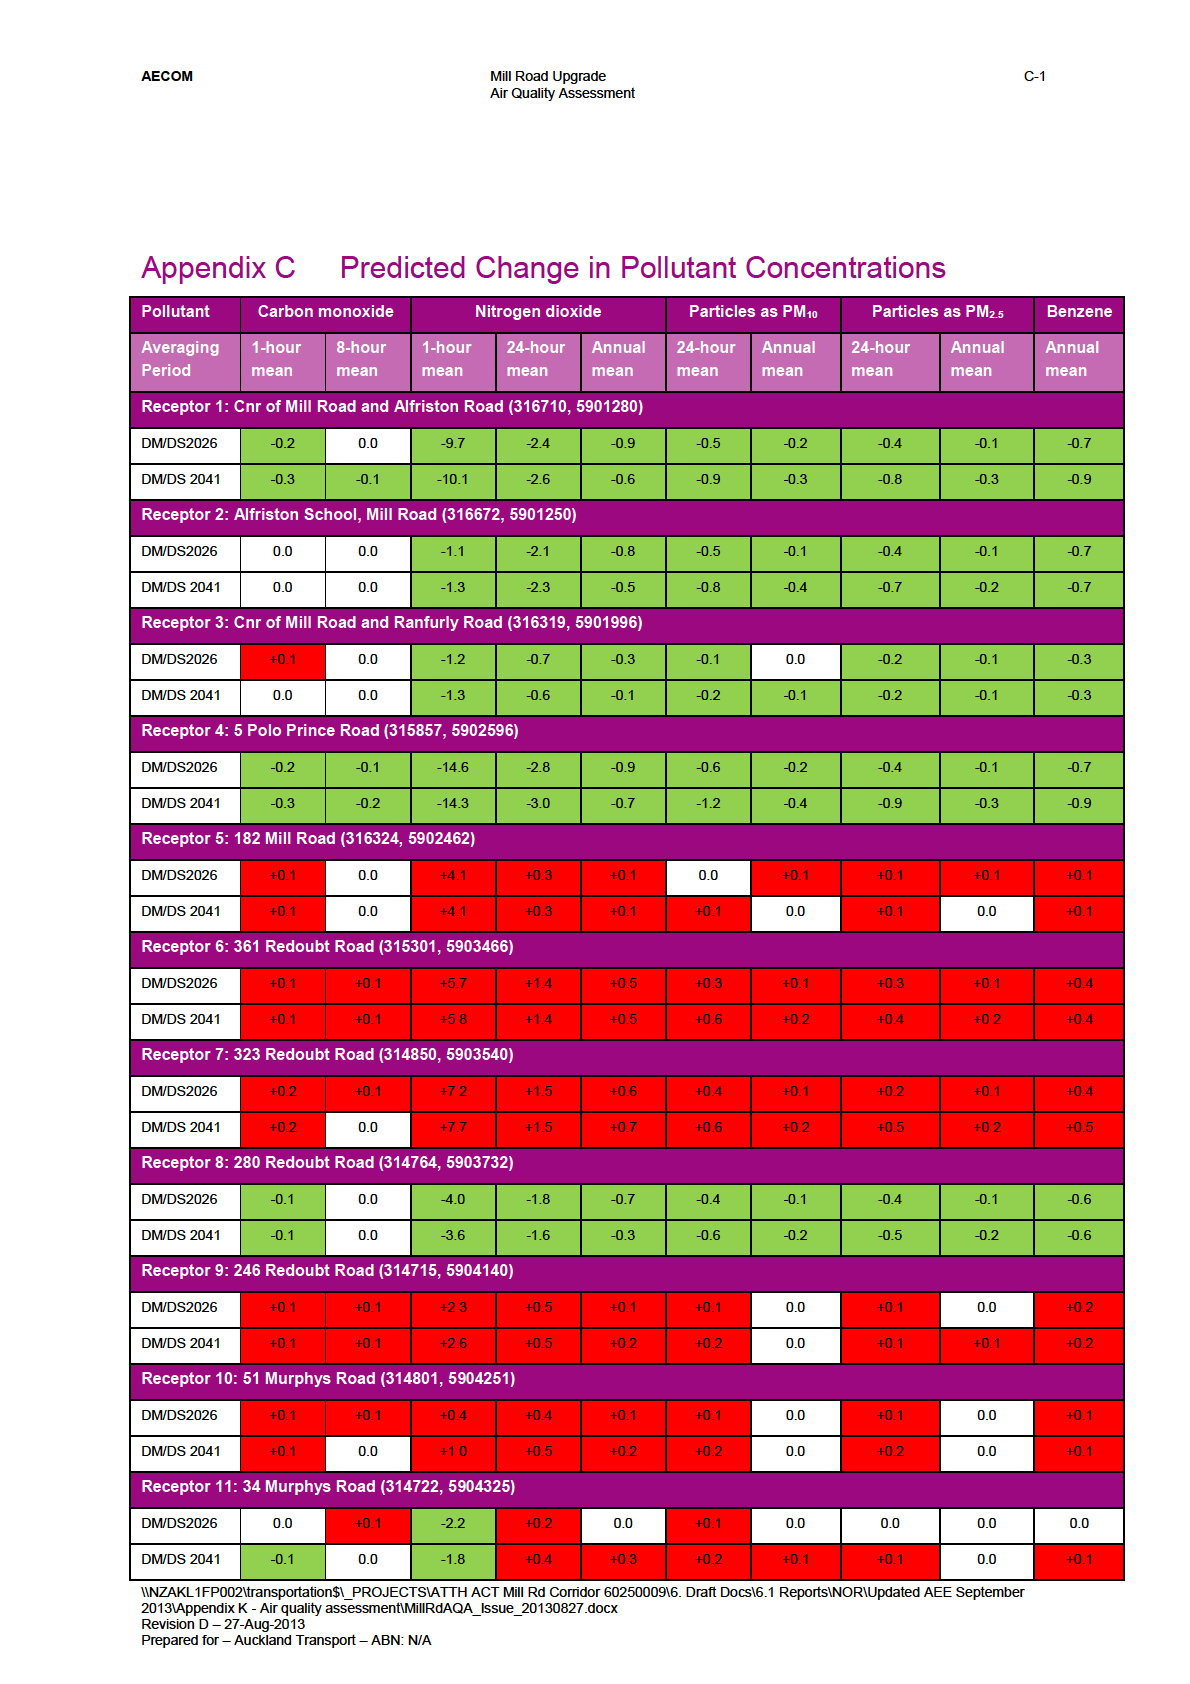
AECOM
Mill Road Upgrade
C-2
Air Quality Assessment
Pollutant
Carbon monoxide
Nitrogen dioxide
Particles as PM10
Particles as PM2.5
Benzene
Averaging
1-hour
8-hour
1-hour
24-hour
Annual
24-hour
Annual
24-hour
Annual
Annual
Period
mean
mean
mean
mean
mean
mean
mean
mean
mean
mean
Receptor 12: 208 Redoubt Road (314373, 5904324)
DM/DS2026
+0.1
0.0
+3.6
-0.3
-0.1
-0.1
0.0
-0.1
0.0
-0.2
DM/DS 2041
+0.1
0.0
+3 3
-0.3
0.0
-0.1
-0.1
-0.1
0.0
-0.2
Receptor 13: 170 Redoubt Road (313917, 5904372)
DM/DS2026
-0.1
0.0
-2.1
-0.5
-0.2
-0.1
0.0
0.0
0.0
-0.2
DM/DS 2041
-0.1
0.0
-2.5
-0.6
0.0
-0.3
-0.1
-0.2
0.0
-0.2
Receptor 14: 189 Redoubt Road (313973, 5904309)
DM/DS2026
+0.1
+0.1
+4 3
+1.8
+0.5
+0.4
+0.1
+0.4
+0.1
+0.6
DM/DS 2041
+0.1
0.0
+4.1
+1.8
+0.6
+0.8
+0.2
+0.5
+0 2
+0.6
Receptor 15: 156 Redoubt Road (313640, 5904389)
DM/DS2026
+0.1
0.0
+1 3
-0.2
-0.1
0.0
0.0
-0.1
0.0
-0.1
DM/DS 2041
0.0
0.0
+0 8
-0.3
0.1
-0.2
-0.1
-0.1
-0.1
-0.2
Receptor 16: 141 Redoubt Road (313443, 5904276)
DM/DS2026
+0.3
+0.1
+10.7
+2.6
+0.7
+0.6
+0.2
+0.4
+0 2
+0.6
DM/DS 2041
+0.2
+0.1
+9.6
+2.7
+0.7
+1.0
+0.3
+0.7
+0 2
+0.6
Receptor 17: 1 Santa Monica Place (313107, 5904321)
DM/DS2026
+0.1
0.0
+1 3
-0.3
-0.2
0.0
-0.1
0.0
0.0
-0.2
DM/DS 2041
0.0
0.0
+0.7
-0.4
0.0
-0.2
-0.2
-0.1
-0.1
-0.3
Receptor 18: 12 Elsted Place (313244, 5904295)
DM/DS2026
+0.1
0.0
+3.7
+1.1
+0.5
+0.3
+0.1
+0.2
+0.1
+0.4
DM/DS 2041
+0.1
0.0
+3 3
+1.0
+0.5
+0.4
+0.1
+0.3
+0.1
+0.4
Receptor 19: 2 Everglade Drive (312808, 5904147)
DM/DS2026
+0.1
+0.1
+2 9
+0.2
+0.2
+0.1
+0.1
0.0
+0.1
+0.2
DM/DS 2041
0.0
0.0
+2 0
0.0
+0.4
-0.1
0.0
0.0
0.0
+0.1
Receptor 20: 38 Redoubt Road (312575 , 5904123)
DM/DS2026
+0.1
0.0
+1 0
+0.5
+0.1
+0.1
+0.1
+0.1
+0.1
+0.1
DM/DS 2041
0.0
0.0
+0 5
+0.1
+0.4
0.0
0.0
0.0
0.0
0.0
Receptor 21: 22 Redoubt Road (312403, 5904067)
DM/DS2026
+0.1
0.0
+0 5
+0.9
+0.2
+0.2
0.0
+0.2
0.0
+0.2
DM/DS 2041
0.0
0.0
+0.5
0.0
+0.4
0.0
0.0
0.0
0.0
+0.1
Receptor 22: 12 Redoubt Road (312268, 5904022)
DM/DS2026
+0.1
0.0
+0.7
+1.3
+0.4
+0.3
+0.1
+0.2
+0.1
+0.3
DM/DS 2041
0.0
0.0
+1.8
+0.1
+0.5
+0.1
0.0
+0.1
0.0
+0.1
\\NZAKL1FP002\transportation$\_PROJECTS\ATTH ACT Mill Rd Corridor 60250009\6. Draft Docs\6.1 Reports\NOR\Updated AEE September
2013\Appendix K - Air quality assessment\MillRdAQA_Issue_20130827.docx
Revision D – 27-Aug-2013
Prepared for – Auckland Transport – ABN: N/A