

FINANCIAL REVIEW
For the Period Ended 31 July 2020
Executive Summary
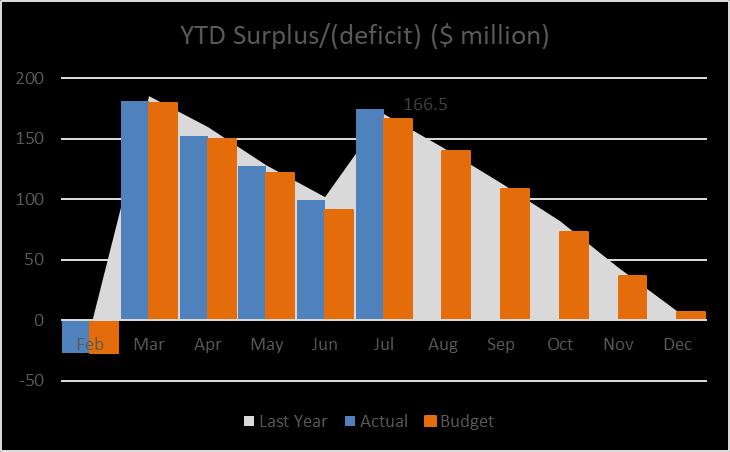
The operating surplus for the period ended 31 July 2020 was $174.0 million, which was $7.5 million
greater than the budgeted surplus of $166.5 million. This favourable variance was mainly driven by
savings caused by the COVID-related reduction of activity on campus, partly offset by reduced tuition
related-income and residential college, food outlet, dental and physiotherapy patient income.
The financial impact of COVID-19 on the remainder of the year cannot yet be reliably estimated, as a
number of factors are still uncertain and the environment continues to change. In particular, any
return to more stringent lockdown measures may adversely affect income for the remainder of the
year.
Liquidity was strong and cash reserves were sufficient to meet the planned significant expenditure on
major projects until December 2020, at which point borrowing will be required. The financial impact
of COVID-19 will put pressure on operating cash flows and ongoing savings will be required to ensure
the University is well placed for recovery.
Tuition-related income is largely recognised in March and July at the time of first and second
semester enrolments, rather than evenly throughout the year. This shows the impact of enrolment
numbers as early as possible, allowing time for decisions to be made about the consequences of
variances against income budgets. This phases the University surplus as shown in the graph above,
with income being recognised early in the year.
Year to date surplus/(deficit) by function ($ million):
Full Year
Year to Date
Last Ye
F a
ir r
st Forecast
Actu
Fia
r l
st Forecast
Var Last Year
$189.2
$188.9 Teaching
$263.0
$263.1 $(0.1)
$262.9
$19.9
$17.9 Research
$20.6
$16.6
$4.0
$15.0
$8.1
$5.6 Commercial
$0.2
$4.7 $(4.5)
$7.7
$3.9
$0.4 Treasury
$2.2
$0.4
$1.8
$2.9
$(213.5) $(206.4) Administration
$(111.9) $(118.3)
$6.3
$(118.0)
$7.6
$6.4
$174.0
$166.5
$7.5
$170.4
Divisional Operating Contribution Summary
Year to date ($ millions)
Commentary
Academic
Actual
Budget Variance
Divisions
Commerce
5.2
6.1
(1.0) Unfavourable variance mostly due to lower
student-related income
Health Sciences
35.8
33.9
1.9 Favourable variances in travel and consumable
expenditure have been partially offset by lower
income due to clinics being closed during COVID-
19 lockdown and lower student-related income.
Humanities
12.7
13.6
(0.8)
Sciences
17.9
16.2
1.8 Lower consumable and travel expenditure were
partially offset by lower student-related income.
Total Academic
71.6
69.8
1.9
Divisions
Other Divisions
Academic and
21.3
20.0
1.4 Favourable variances due to lower consumables
Student Services
and professional staff expenditure.
Campus and
3.1
7.8
(4.7) Lower income in the residential colleges due to
Collegiate Life
rebate given to students during COVID-19
Services
lockdown. Catering outlets on campus were also
closed during lockdown
Committees
10.0
7.6
2.4 Favourable variances due to postgraduate
scholarships being deferred. Income received for
the Pūtea Tautoko relief fund was higher than
distributions to date
External
9.6
7.7
2.0 Favourable variances in travel, catering,
Engagement
marketing and postage all due to COVID-19
lockdown
Corporate
10.8
8.6
2.3 Funding received from TEC for COVID-related
support and higher investment income
Financial Services
3.0
2.9
0.1
Human Resources
1.9
1.9
(0.0)
ITS
14.0
13.3
0.7 Lower use of subcontractors, due to COVID-19,
and savings in professional staff
Operations
1.0
1.7
(0.6) Higher expenditure on preparatory work for
capital project business cases than budget.
Property Services
1.7
(0.1)
1.8 Favourable variances related to energy savings
and lower use of external contractors due to
COVID-19 lockdown
Research
2.7
2.3
0.3
Shared Services
20.8
21.6
(0.7) Additional resourcing needed to support the
COVID-19 response, particularly within Ask Otago
Vice Chancellor's
2.4
1.6
0.8 Favourable variances in consumable expenditure
Office
(travel, professional consulting), and staff related
costs
Total Other
102.4
96.8
5.7
Divisions
Grand Total
174.0
166.5
7.5
(Surplus/(Deficit)
Treasury
Investment Income
Investment income was $2.2 million year to date, which was $1.8 million higher than budget as a
result of higher cash balances caused by delayed capital expenditure.
Cash balance
Cash on hand was $78.0 million greater than budget. This resulted mainly from slower spend on
capital projects and consumables and travel savings.
The anticipated date when borrowing will be required is December 2020.
Cash flow from operations was $132.2 million year to date, this was $24.0 million higher than budget
as a result of reduced consumable and travel expenditure and higher research income received in
advance, partly offset by lower tuition and commercial income. Due to forecast decreased income
related to the impact of COVID-19, cash flow from operations is expected to be significantly reduced
by the end of 2020.
Net cash outflow from investing was $75.0 million year to date. This was $30.5 million less than
budget as a result of delays in expenditure on capital projects.
Capital
Total capital expenditure year to date was $66.5 million. This was $39.2 million less than budget.
Capital Projects
Major (project budget $10 million +) capital project variances were:
Project
Full Year
Life to
Date
%
Project
Actual
Budget
Var
Actual
Budget
% spent
complete
$m
$m
$m
$m
$m
Manukau Dental Facility
5.1
5.8
0.7
23.3
28.3
82%
95%
Music and Theatre Relocation
9.4
5.4
(4.0)
30.3
30.2
100%
96%
Te Rangi Hiroa Replacement
2.6
15.9
13.3
3.5
101.7
3%
10%
Eccles Building
10.3
12.4
2.1
52.8
49.3
107%
82%
School of Dentistry Upgrade
12.5
15.7
3.2
127.1
131.7
97%
75%
Christchurch Health Precinct
2.2
5.0
2.7
7.7
178.3
4%
3%
Other projects
15.6
24.3
8.6
Total Major Projects
57.7
84.3
26.6
Annual Capital Pools
8.9
21.5
12.6
TOTAL CAPITAL
66.5
105.8
39.2
Manukau Dental Facility ($0.7 million underspend YTD)
The building has been commissioned and is operational.
The Service Level Agreement has been agreed and, along with the Deed of Lease, remains with the
DHB for final sign off. The official opening is scheduled for 1 September.
Music & Theatre Relocation ($4.0 million overspend YTD)
• Stage 2 (refurbishment) completed.
• Old Studio (180 Albany street) demolition contract tender awarded 6 July 2020.
• Demolition target completion November 2020.
Te Rangi Hiroa Replacement ($13.3 million underspend YTD)
• DCC resource consent issued.
• Fixed Price Lump Sum for construction due in September with a target (subject to
affordability) of appointing contractor in October.
• Government shovel ready funding application submitted. Outcome unknown.
Eccles Building ($2.1 million underspend YTD)
• Historical delays and budget overruns due to ground conditions, façade changes, revised
steam supply and Contractors productivity.
• Project completion forecast now November 2020.
Levels 1 and 2 near completion. Christchurch Health Precinct ($2.7 million underspend YTD)
• Council has approved in principle the UOC business case subject to appropriate stage gates
and ongoing affordability.
• Government shovel ready funding application submitted. Outcome unknown.
• Developed Design progressing in line with Master Programme.
• Market briefing session with contractors which received high interest.
School of Dentistry Upgrade ($3.2 million underspend YTD)
• Current contract completion date is January 2021 but with a target handover pre-Christmas
2020 to enable client commissioning and operational readiness for semester 1 2021.
• The project has established a worst case budget forecast of an overspend of $11.5. The
project team has explored and implemented value management options to mitigate this
overspend.
• Operational commissioning planning is well underway and commission program has been
completed.

MONTHLY FINANCIAL STATEMENTS
31 July 2020
CONTENTS
PAGE
Monthly Overview
1
Statement of Financial Performance
2
Analysis of Consumables
3
Statement of Financial Position
4
Statement of Cash Flows
5
Statement of Cost Services
Commerce
6
Health Sciences
7
Humanities
8
Sciences
9
Service Divisions
10
Statement of Capital Expenditure
11
Statement of Capital Works, Significant
12
Equipment & Other Projects
MONTHLY OVERVIEW
For the period ended 31 July 2020
Actual
Budget
Last Year
($,000's)
($,000's)
($,000's)
Surplus Year to Date
174,050
166,533
170,351
Total Cash Flow
57,225
2,736
47,516
93,736
15,737
131,941
Total Assets
2,218,895
2,290,715
2,133,851
University of Otago Actual and Budgeted Surplus
200,000
150,000
s)
100,000
$ ('000'
50,000
0
Jan
Feb
Mar
Apr
May
Jun
Jul
Aug
Sep
Oct
Nov
Dec
-50,000
-100,000
2020 Actual
2020 Budget
2019 Actual
2018 Actual
University of Otago Monthly Cash on Hand
250,000
200,000
150,000
s) 100,000
0'
50,000
($,00
0
Jan
Feb
Mar
Apr
May
Jun
Jul
Aug
Sep
Oct
Nov
Dec
-50,000
-100,000
2020 Actual
2020 Budget
2019 Actual
2018 Actual
1
University of Otago
Statement of Financial Performance
Period Ended 31 July 2020
31 July 2020
Full Year
Year to Date
Last Year
Budget
Actual
Budget
Variance
Last Year
$000's
$000's
$000's
$000's
$000's
$000's
INCOME
244,859
253,010
Vote Education
247,282
246,846
436
239,942
62,234
62,493
Performance Based Research Funding
36,539
36,454
85
37,166
2,640
2,057
Vote Health
1,321
1,095
226
1,054
116,840
120,601
Domestic Tuition Fees
117,713
118,104
(391)
114,957
48,669
51,549
International Tuition Fees
42,869
50,806
(7,937)
47,854
3,929
384
Investment Income
2,195
372
1,823
2,874
25,039
24,007
Sundry Income
17,587
18,315
(728)
19,042
137,673
144,867
External y Funded Research
86,648
84,989
1,659
79,918
10,333
11,816
Distribution from Trusts
7,467
6,460
1,007
4,455
81,549
84,328
Consulting & Commercial Income
43,167
52,473
(9,306)
49,716
1,950
193
Intel ectual Property
104
53
51
91
3,593
6,283
Capitalisation of internal costs
3,532
3,783
(251)
1,793
739,308
761,588
Total Income
606,424
619,750
(13,326)
598,862
EXPENDITURE
219,873
225,727
Salaries - Academic
134,079
132,683
(1,396)
127,830
171,189
175,906
Salaries - Professional
103,466
104,539
1,073
97,289
32,832
25,354
Staff Related Costs
15,485
16,237
752
20,382
27,498
30,341
Subcontracted Services
22,662
18,354
(4,308)
17,037
114,201
121,417
Consumables & General
49,580
70,836
21,256
61,105
45,418
44,786
Occupancy Costs
24,135
25,372
1,237
26,234
70,244
80,783
Depreciation
43,507
45,411
1,904
39,867
50,415
50,864
Scholarships
39,460
39,785
325
38,767
731,670
755,178
Total Expenditure
432,374
453,217
20,843
428,511
7,638
6,410
Operating Surplus / (Deficit)
174,050
166,533
7,517
170,351
2
University of Otago
Analysis of Consumables and General
Period Ended 31 July 2020
31 July 2020
Full Year
Year to Date
Last Year
Budget
Actual
Budget
Variance
Last Year
$000's
$000's
$000's
$000's
$000's
$000's
4,240
4,238
Administration Expenses
1,785
2,568
783
2,588
2,366
2,454
Communications Expenses
1,356
1,429
73
1,374
7,932
7,631
Equipment Expenses
4,224
4,817
593
4,515
12,453
14,842
Laboratory Expenses
6,455
8,199
1,744
6,516
10,340
11,198
Computing Expenses
10,675
9,545
(1,130)
7,629
13,825
13,917
Reference Material Costs
2,866
2,532
(334)
2,399
17,129
17,116
Travel & Accommodation Expenses
2,676
10,371
7,695
9,812
4,653
4,078
Advertising & Promotion
1,791
2,408
617
1,791
9,278
9,032
Professional, Consulting & Affiliation
5,050
5,672
622
5,464
4,179
4,942
Student Related Expenses
2,077
3,301
1,224
2,440
2,959
2,310
Corporate Expenses
606
1,149
543
1,245
11,054
10,946
Goods For Resale & Catering Expenses
4,199
6,411
2,212
6,178
13,793
18,713
Other Expenses
5,820
12,434
6,614
9,154
114,201
121,417
Total Consumables & General
49,580
70,836
21,256
61,105
3

University of Otago
Statement of Financial Position
As at 31 July 2020
31 July 2020
Full Year
Last Year
Budget
Actual
Budget
Variance
Last Year
$000's
$000's
$000's
$000's
$000's
$000's
ASSETS
CURRENT ASSETS
16,555
- Cash and Bank
6,480
5,000
1,480
8,003
20,000
- Bank Term Deposits
87,300
10,737
76,563
124,000
45,827
30,779
Accounts Receivable
132,000
127,493
4,507
128,994
12,544
12,011
Prepayments
6,275
5,967
308
5,664
1,044
1,218
Inventory
1,131
1,253
(122)
1,219
95,970
44,008
Total Current Assets
233,186
150,450
82,736
267,880
INVESTMENTS
5,354
7,566
Loans and Advances
5,298
7,833
(2,535)
5,658
32,558
33,053
Investments
33,637
33,053
584
33,024
37,912
40,619
Total Investments
38,935
40,886
(1,951)
38,682
1,924,205
2,126,228
FIXED ASSETS
1,946,774
2,099,379
(152,605)
1,827,289
2,058,087
2,210,855
TOTAL ASSETS
2,218,895
2,290,715
(71,820)
2,133,851
LIABILITIES
CURRENT LIABILITIES
31,206
45,150
Accounts Payable
22,738
29,622
(6,884)
32,373
31,626
31,827
General Accruals
22,874
30,249
(7,375)
34,792
50,686
52,600
Employee Entitlements
56,323
55,426
897
51,427
26,757
18,348
Student Fees Received in Advance
3,571
3,657
(86)
3,782
48,549
46,690
Research Funds Received in Advance
62,154
47,418
14,736
44,985
4,025
3,590
Other Income Received in Advance
11,206
9,895
1,311
10,429
192,849
198,205
Total Current Liabilities
178,866
176,267
2,599
177,788
TERM LIABILITIES
53,481
49,631
Employee Entitlements
54,215
49,631
4,584
49,631
-
58,325
Bank Loans
-
-
-
-
53,481
107,956
Total Term Liabilities
54,215
49,631
4,584
49,631
EQUITY
602,393
609,737
General Reserve
605,144
609,737
(4,593)
604,428
34,354
34,354
Capital Injections
34,354
34,354
-
34,354
108,029
108,191
Carry Forwards
112,923
108,191
4,732
104,768
1,059,343
1,146,002
Property Revaluation Reserve
1,059,343
1,146,002
(86,659)
992,531
7,638
6,410
Operating Surplus/(Deficit)
174,050
166,533
7,517
170,351
1,811,757
1,904,694
Total Equity
1,985,814
2,064,817
(79,003)
1,906,432
2,058,087
2,210,855
TOTAL LIABILITIES AND CAPITAL
2,218,895
2,290,715
(71,820)
2,133,851
4

University of Otago
Statement of Cashflows
Period Ended 31 July 2020
31 July 2020
Full Year
Year to Date
Last Year
Budget
Actual
Budget
Variance
Last Year
$000's
$000's
$000's
$000's
$000's
$000's
OPERATING ACTIVITIES
Cash was provided from:
313,462
317,560
Income from Government Grant
184,177
185,136
(959)
182,877
181,690
185,685
Income from Student Fees
159,321
164,627
(5,306)
162,695
249,603
252,732
Income from Services
166,136
156,573
9,563
152,818
4,530
604
Interest & Dividends Received
1,074
482
592
2,506
749,285
756,581
510,708
506,818
3,890
500,896
Cash was applied to:
385,600
394,777
Paid to Employees
231,917
231,376
(541)
223,673
274,975
265,733
Paid to Suppliers
146,613
167,247
20,634
157,966
660,575
660,510
378,530
398,623
20,093
381,639
88,710
96,071
Net Cash Flows from Operating Activities
132,178
108,195
23,983
119,257
INVESTING ACTIVITIES
Cash was provided from:
749
338
Investments
58
71
(14)
81
102
18
Disposal of Fixed Assets
38
-
38
43
851
356
96
71
24
124
Cash was applied to:
-
-
Investments
364
-
(364)
-
137,493
167,753
Purchase of Fixed Assets
74,685
105,530
30,845
71,865
137,493
167,753
75,049
105,530
30,481
71,865
(136,642)
(167,397)
Net Cash Flows from Investing Activities
(74,953) (105,459)
30,506
(71,741)
FINANCING ACTIVITIES
Cash was applied to:
Loans / Advances
-
-
-
-
-
-
-
-
Net Cash Flows from Financing Activities
-
-
-
-
(47,932)
(71,326)
Total Cash Flows
57,225
2,736
54,489
47,516
84,487
13,001
Opening Balance
36,555
13,001
23,554
84,487
36,555
(58,325)
Closing Balance
93,780
15,737
78,043
132,003
Represented by:
16,555
-
Cash and Bank
6,480
5,000
1,480
8,003
20,000
-
Bank Term Deposits
87,300
10,737
76,563
124,000
-
(58,325)
Bank Loans
-
-
-
-
36,555
(58,325)
93,780
15,737
78,043
132,003
5

Division of Commerce
Statement of Cost of Services
Period Ended 31 July 2020
31 July 2020
Full Year
Year to Date
Last Year
Budget
Actual
Budget
Variance
Last Year
$000's
$000's
$000's
$000's
$000's
$000's
INCOME
16,979
17,477
Vote Education
17,039
17,062
(23)
16,626
2,282
2,582
Performance Based Research Funding
1,506
1,506
-
1,372
13,196
13,688
Domestic Tuition Fees
13,088
13,054
34
12,624
8,700
9,034
International Tuition Fees
7,024
8,515
(1,491)
8,106
145
16
Sundry Income
63
11
52
61
2,068
1,329
External y Funded Research
1,095
767
328
1,520
465
413
Distribution from Trusts
212
236
(24)
242
413
543
Consulting & Commercial Income
62
269
(207)
216
3,420
2,176
Internal Income
1,758
1,189
569
1,647
47,668
47,258
Total Income
41,847
42,609
(762)
42,414
EXPENDITURE
16,551
16,765
Salaries - Academic
9,880
9,878
(2)
9,946
1,223
1,180
Salaries - Professional
763
616
(147)
719
1,281
1,242
Staff Related Costs
696
767
71
747
48
290
Subcontracted Services
2
168
166
20
4,803
3,004
Consumables & General
1,753
1,612
(141)
2,472
435
8
Occupancy Costs
9
5
(4)
252
1,450
2,976
Internal Rent
1,710
1,736
26
841
21,764
22,174
Service Division Costs
22,174
22,174
-
21,764
(3,528)
(4,629) Subventions
(4,629)
(4,629)
-
(3,528)
3,875
3,892
Interest on Capital
3,892
3,892
-
3,875
134
120
Depreciation
75
71
(4)
78
374
236
Scholarships
369
186
(183)
241
48,410
47,258
Total Expenditure
36,694
36,476
(218)
37,427
(742)
- Net Surplus / (Deficit)
5,153
6,133
(980)
4,987
6

Division of Health Sciences
Statement of Cost of Services
Period Ended 31 July 2020
31 July 2020
Full Year
Year to Date
Last Year
Budget
Actual
Budget
Variance
Last Year
$000's
$000's
$000's
$000's
$000's
$000's
INCOME
136,451
140,524
Vote Education
134,470
136,096
(1,626)
132,930
35,640
36,863
Performance Based Research Funding
21,500
21,504
(4)
21,185
2,640
2,057
Vote Health
1,321
1,095
226
1,054
53,415
55,248
Domestic Tuition Fees
52,823
53,733
(910)
52,254
21,054
22,252
International Tuition Fees
21,382
22,057
(675)
20,765
5,475
6,261
Sundry Income
2,639
3,856
(1,217)
3,392
97,517
103,390
External y Funded Research
57,425
60,314
(2,889)
56,279
5,029
5,085
Distribution from Trusts
3,376
2,466
910
2,016
14,671
17,284
Consulting & Commercial Income
7,231
10,268
(3,037)
8,578
189
184
Intel ectual Property
59
48
11
87
82,117
73,934
Internal Income
48,233
45,419
2,814
47,574
454,198
463,082
Total Income
350,459
356,856
(6,397)
346,114
EXPENDITURE
130,121
136,076
Salaries - Academic
79,473
79,986
513
75,257
28,080
27,497
Salaries - Professional
16,575
16,312
(263)
16,331
11,283
11,353
Staff Related Costs
6,126
6,917
791
6,655
15,391
17,468
Subcontracted Services
10,823
10,430
(393)
9,005
109,274
105,300
Consumables & General
55,710
63,285
7,575
62,022
6,033
784
Occupancy Costs
381
446
65
3,533
19,572
29,526
Internal Rent
16,413
16,685
272
11,413
102,093
106,046
Service Division Costs
106,046
106,046
-
102,093
(550)
(6,427) Subventions
(6,427)
(6,427)
-
(550)
19,448
19,654
Interest on Capital
19,654
19,654
-
19,448
9,542
10,030
Depreciation
5,676
5,721
45
4,865
5,971
5,775
Scholarships
4,208
3,902
(306)
4,074
456,258
463,082
Total Expenditure
314,658
322,957
8,299
314,146
(2,060)
- Net Surplus / (Deficit)
35,801
33,899
1,902
31,968
7

Division of Humanities
Statement of Cost of Services
Period Ended 31 July 2020
31 July 2020
Full Year
Year to Date
Last Year
Budget
Actual
Budget
Variance
Last Year
$000's
$000's
$000's
$000's
$000's
$000's
INCOME
36,099
37,344
Vote Education
36,807
37,033
(226)
35,722
7,694
7,016
Performance Based Research Funding
4,092
4,092
-
4,596
24,728
25,406
Domestic Tuition Fees
25,250
25,203
47
24,563
7,999
8,439
International Tuition Fees
5,395
8,425
(3,030)
7,940
559
319
Sundry Income
224
258
(34)
344
6,922
6,180
External y Funded Research
5,995
3,410
2,585
3,887
2,615
3,249
Distribution from Trusts
1,555
1,511
44
844
3,976
3,529
Consulting & Commercial Income
2,678
2,471
207
2,276
8
6
Intel ectual Property
3
3
-
2
5,814
5,676
Internal Income
3,468
3,547
(79)
3,243
96,414
97,164
Total Income
85,467
85,953
(486)
83,417
EXPENDITURE
38,432
37,339
Salaries - Academic
22,512
21,683
(829)
22,312
2,372
2,119
Salaries - Professional
1,375
1,250
(125)
1,355
2,946
2,765
Staff Related Costs
1,617
1,721
104
1,695
1,234
1,259
Subcontracted Services
2,795
747
(2,048)
856
8,311
9,705
Consumables & General
3,713
6,006
2,293
4,153
1,313
97
Occupancy Costs
36
60
24
763
3,886
5,487
Internal Rent
3,002
3,170
168
2,279
41,642
43,481
Service Division Costs
43,481
43,481
-
41,642
(11,798)
(13,957) Subventions
(13,957)
(13,957)
-
(11,798)
7,355
7,331
Interest on Capital
7,331
7,331
-
7,355
797
778
Depreciation
413
470
57
490
908
760
Scholarships
441
442
1
600
97,398
97,164
Total Expenditure
72,759
72,404
(355)
71,702
(984)
- Net Surplus / (Deficit)
12,708
13,549
(841)
11,715
8
Division of Sciences
Statement of Cost of Services
Period Ended 31 July 2020
31 July 2020
Full Year
Year to Date
Last Year
Budget
Actual
Budget
Variance
Last Year
$000's
$000's
$000's
$000's
$000's
$000's
INCOME
54,445
56,335
Vote Education
56,298
55,880
418
54,203
16,515
15,813
Performance Based Research Funding
9,224
9,224
-
9,839
25,469
26,255
Domestic Tuition Fees
26,503
26,110
393
25,486
10,907
11,824
International Tuition Fees
9,069
11,810
(2,741)
10,901
1,861
875
Sundry Income
316
534
(218)
1,386
31,033
33,845
External y Funded Research
22,021
20,403
1,618
18,166
585
598
Distribution from Trusts
397
357
40
412
1,048
901
Consulting & Commercial Income
654
626
28
674
2
3
Intel ectual Property
1
3
(2)
2
34,589
31,342
Internal Income
16,328
14,605
1,723
15,588
176,454
177,791
Total Income
140,811
139,552
1,259
136,657
EXPENDITURE
43,430
44,014
Salaries - Academic
27,458
26,216
(1,242)
25,358
9,151
8,816
Salaries - Professional
4,590
5,155
565
5,551
3,977
3,667
Staff Related Costs
2,039
2,184
145
2,344
6,903
7,339
Subcontracted Services
6,612
4,587
(2,025)
4,871
41,920
40,146
Consumables & General
17,024
19,851
2,827
19,690
3,599
181
Occupancy Costs
56
102
46
2,019
9,891
13,638
Internal Rent
7,857
7,955
98
5,825
48,912
51,516
Service Division Costs
51,516
51,516
-
48,912
(13,059)
(12,422) Subventions
(12,422)
(12,422)
-
(13,059)
14,465
14,083
Interest on Capital
14,083
14,083
-
14,465
3,598
3,609
Depreciation
2,130
2,108
(22)
2,028
3,416
3,204
Scholarships
1,922
2,044
122
2,309
176,203
177,791
Total Expenditure
122,865
123,379
514
120,313
251
- Net Surplus / (Deficit)
17,946
16,173
1,773
16,344
9

Service Divisions
Statement of Cost of Services
Period Ended 31 July 2020
31 July 2020
Full Year
Year to Date
Last Year
Budget
Actual
Budget
Variance
Last Year
$000's
$000's
$000's
$000's
$000's
$000's
INCOME
885
1,329
Vote Education
2,667
775
1,892
462
102
219
Performance Based Research Funding
216
128
88
174
32
4
Domestic Tuition Fees
49
4
45
29
9
- International Tuition Fees
-
-
-
143
3,929
384
Investment Income
2,195
372
1,823
2,874
16,999
16,535
Sundry Income
14,344
13,657
687
13,860
133
124
External y Funded Research
112
95
17
67
1,639
2,471
Distribution from Trusts
1,928
1,889
39
941
61,443
62,071
Consulting & Commercial Income
32,542
38,839
(6,297)
37,973
1,750
- Intellectual Property
41
-
41
-
107,523
133,303
Internal Income
75,489
77,568
(2,079)
62,340
194,444
216,440
Total Income
129,583
133,327
(3,744)
118,863
EXPENDITURE
3,400
3,808
Salaries - Academic
2,094
2,198
104
1,976
132,082
138,339
Salaries - Professional
81,047
82,423
1,376
74,412
14,232
7,210
Staff Related Costs
5,545
5,193
(352)
9,460
3,922
3,984
Subcontracted Services
2,430
2,423
(7)
2,284
86,233
87,205
Consumables & General
47,086
51,737
4,651
46,962
58,105
50,479
Occupancy Costs
27,335
28,746
1,411
33,751
19,996
42,615
Internal Rent
24,615
24,319
(296)
11,347
(214,411) (223,217) Service Division Costs
(223,217) (223,217)
-
(214,411)
28,935
37,435
Subventions
37,435
37,435
-
28,935
(45,142)
(44,959) Interest on Capital
(44,959)
(44,959)
-
(45,142)
56,173
66,245
Depreciation
35,213
37,042
1,829
32,405
39,746
40,888
Scholarships
32,520
33,212
692
31,543
183,271
210,032
Total Expenditure
27,144
36,552
9,408
13,522
11,173
6,408
Net Surplus / (Deficit)
102,439
96,775
5,664
105,341
Full Year
Year to Date
Last Year
Budget
Actual
Budget
Variance
Last Year
$000's
$000's
$000's
$000's
$000's
$000's
6,683
2,731
Campus & Collegiate Life Services
3,112
7,780
(4,668)
9,673
(3,435)
(3,345) Academic & Student Services
21,309
19,953
1,356
19,819
(626)
- Committees
9,962
7,598
2,364
7,499
11,753
10,823
Corporate
10,828
8,570
2,258
14,474
1,358
- External Engagement
9,642
7,662
1,980
9,853
(67)
- Financial Services
3,034
2,916
118
2,856
437
- Human Resources
1,855
1,867
(12)
2,312
2,165
- Information Technology Services
14,025
13,319
706
13,820
(1,031)
(1,706) Operations
1,042
1,656
(614)
2,498
(3,287)
(30) Property Services
1,724
(77)
1,801
(1,643)
(482)
(450) Research
2,657
2,341
316
2,333
(1,282)
- Shared Services
20,831
21,562
(731)
20,084
(1,013)
(1,615) Vice Chancellor's Office
2,418
1,628
790
1,763
11,173
6,408
Net Surplus / (Deficit)
102,439
96,775
5,664
105,341
10
University of Otago
Statement of Capital Expenditure
Period Ended 31 July 2020
31 July 2020
Full Year
Year to Date
Last Year
Budget
Actual
Budget
Variance
Last Year
$000's
$000's
$000's
$000's
$000's
$000's
LAND AND BUILDINGS
100,813
110,275
Capital Works Programme
51,262
71,760
20,497
59,519
Divisional Land & Buildings
444
-
Service Divisions
10
-
10
402
1,385
306
Campus & Collegiate Life Services
212
164
(48)
569
205
30
Division of Health Sciences
23
-
(23)
13
2
-
Division of Sciences
48
-
(48)
2
2,036
336
Total Divisional Land and Buildings
293
164
(129)
986
102,849
110,611
Total Land & Buildings
51,555
71,924
20,369
60,505
FURNITURE AND EQUIPMENT
618
1,200
Equipment Committee
151
1,200
1,049
349
3,662
6,404
Capital Works Programme
1,006
4,215
3,208
2,804
Divisional Furniture & Equipment
5,257
11,285
Service Divisions
2,129
8,546
6,417
1,590
1,184
2,752
Campus & Collegiate Life Services
607
1,018
411
620
154
160
Division of Commerce
70
100
29
79
8,141
9,324
Division of Health Sciences
2,352
4,131
1,779
4,247
578
736
Division of Humanities
213
642
429
262
3,234
3,306
Division of Sciences
1,258
2,874
1,615
1,991
22,828
35,167
Total Furniture & Equipment
7,786
22,726
14,940
11,942
SOFTWARE & SYSTEMS
6,357
12,242
Capital Works Programme
5,253
7,141
1,889
3,146
Divisional Software & Systems
2,620
6,813
Service Divisions
201
2,355
2,154
340
70
103
Division of Health Sciences
29
47
18
40
8
-
Division of Humanities
-
-
-
8
22
31
Division of Sciences
22
23
1
14
9,077
19,189
Total Software & Systems
5,505
9,566
4,061
3,548
LIBRARY BOOKS AND PERIODICALS
2,653
2,936
Academic & Student Services
1,667
1,492
(175)
1,603
75
85
Division of Health Sciences
36
59
23
39
2,728
3,021
Total Library Books & Periodicals
1,703
1,551
(152)
1,642
137,482
167,988
TOTAL CAPITAL EXPENDITURE
66,549
105,767
39,218
77,637
11
University of Otago
Statement of Capital Works, Significant Equipment and Other Projects
Period Ended 31 July 2020
31 July 2020
Full Year
Year to Date
Last Year
Budget
Actual
Budget
Variance
$000's
$000's
$000's
$000's
$000's
CDC Capex - Approved Building Projects
7
-
180 Albany St - Hazard Mitigation
-
-
-
2,659
-
Adams Building - Pharmacy Accreditation
29
-
(29)
141
-
Al Other SSR Hubs
135
-
(135)
(2)
3,000
Arana Seismic & Fire
-
210
210
16,204
5,753
Auckland Dental Facility
5,063
5,753
690
(3)
1,650
Caps / Gregory Project
-
825
825
494
-
Castle St Landscaping Projects
19
-
(19)
31
-
Centralised and Consistent Accommodation Management
357
-
(357)
2,876
12,000
Christchurch University of Otago
2,243
4,982
2,739
1,627
400
Clock Tower Refurbishment
608
400
(208)
61
-
Commerce Renovation Project
-
-
-
26
-
Generator Replacement at 444
388
-
(388)
59
1,995
H¿kitekura
471
570
99
4,211
-
Hayward Seismic / Fire
6
-
(6)
-
-
Interprofessional Learning Centre
2
-
(2)
1,148
-
Invercargill Learning Centre - Health Sciences
-
-
-
11
-
ISB Ask Otago Fitout
55
-
(55)
16,145
5,375
Music and Theatre Studies
9,362
5,375
(3,987)
-
32,000
New Col ege - Te Rangi Hiroa Replacement
2,560
15,869
13,309
175
-
ORC Leith Union St to Leith St Landscaping
-
-
-
(3)
1,500
Physical Education
-
750
750
44
-
Portobello - Aquarium
-
-
-
18,055
12,500
Research Support Facilities Stage 2 & 3
10,340
12,419
2,079
22,214
18,233
School of Dentistry Upgrade & Extension
12,458
15,650
3,192
-
1,936
Science III Fire
22
1,129
1,107
3,789
-
Science Precinct - Laboratory Redevelopment
172
-
(172)
133
1,258
Slips and Trips
16
1,258
1,242
(13)
-
St David II General Fit-Out
5
-
(5)
(1)
-
Studholme Seismic & Fire
-
-
-
(1)
-
Union Court
-
-
-
335
-
University Plaza Building One
100
-
(100)
(1)
2,400
UOW Project
243
1,200
957
8
-
Wickliffe Block - Demolition & Car Parking
-
-
-
90,429
100,000
44,654
66,390
21,736
CDC Capex - New Buildings
-
-
Property Purchases
-
-
-
-
-
-
-
-
CDC Capex - Approved IT Projects
11
-
Aconex - Implementation & Integration
2
-
(2)
-
263
Ascender v19 Upgrade
57
123
66
5
-
CCTV
-
-
-
-
653
CI Anywhere - Finance one
210
326
116
1
-
Clocktower ICT
125
-
(125)
-
3
Configuring Agency Portal
-
3
3
652
483
Customer Relationship Mgt - Phase One
470
252
(218)
-
2,755
Customer Relationship Mgt - Phase Two
413
965
552
644
525
Dental ICT Requirements
177
350
173
-
1,050
Digital Exams
1,071
635
(436)
-
1,261
Energy Efficiency - ICT and Analytics
39
473
434
5
9
Event Management
35
9
(26)
1,287
-
Exodus Upgrade - Network Internet Edge Replacement
62
-
(62)
3,008
1,870
Network Upgrade Project - Phase 2
2,325
1,870
(455)
212
-
Oracle Service Cloud phase I enhancements
19
-
(19)
42
-
Placement Administration System
-
-
-
1
-
Principal Investigator Reporting
5
-
(5)
126
-
Professional Development ¿ Learning Deployment
-
-
-
-
364
Room Booking Consolidation
30
136
106
3
-
Service Delivery Management
-
-
-
196
-
Student Management System Enhancements
407
-
(407)
61
-
Student Mobile App
-
-
-
57
-
Student Placement ¿ Stage 3
242
-
(242)
6,311
9,236
5,689
5,142
547
Property Services - Capital Portion of R & M Budgets
2,114
2,500
Statutory Projects
609
1,458
849
2,742
2,000
Adaption Projects
1,866
1,167
(699)
9,246
11,922
Preventative Maintenance
4,705
6,809
2,104
12

University of Otago
Statement of Capital Works, Significant Equipment and Other Projects
Period Ended 31 July 2020
31 July 2020
Full Year
Year to Date
Last Year
Budget
Actual
Budget
Variance
$000's
$000's
$000's
$000's
$000's
14,102
16,422
7,180
9,434
2,254
110,842
125,658
TOTAL
57,523
80,966
23,443
Available Funding for Projects not yet Approved
-
3,264
CDC - ICT Projects available funds
-
2,149
2,149
-
3,264
-
2,149
2,149
110,842
128,922
CAPITAL WORKS ADDITIONS TO FIXED ASSETS
57,523
83,115
25,592
13
Document Outline